SlideShare a Scribd company logo
1 of 43
Download to read offline
The Influence of Light Intensity and Light Quality Upon the Growth of Plants
Author(s): Hardy L. Shirley
Reviewed work(s):
Source: American Journal of Botany, Vol. 16, No. 5 (May, 1929), pp. 354-390
Published by: Botanical Society of America
Stable URL: http://www.jstor.org/stable/2435785 .
Accessed: 02/01/2013 09:45
Your use of the JSTOR archive indicates your acceptance of the Terms & Conditions of Use, available at .
http://www.jstor.org/page/info/about/policies/terms.jsp
.
JSTOR is a not-for-profit service that helps scholars, researchers, and students discover, use, and build upon a wide range of
content in a trusted digital archive. We use information technology and tools to increase productivity and facilitate new forms
of scholarship. For more information about JSTOR, please contact support@jstor.org.
.
Botanical Society of America is collaborating with JSTOR to digitize, preserve and extend access to American
Journal of Botany.
http://www.jstor.org
This content downloaded on Wed, 2 Jan 2013 09:45:23 AM
All use subject to JSTOR Terms and Conditions
THE INFLUENCE OF LIGHT INTENSITY AND LIGHT QUALITY
UPON THE GROWTH OF PLANTS
HARDY L. SHIRLEY
(Received for publication March 30, 1929) 1
INTRODUCTION
Since the discovery that green plants can assimilate carbon in the
presence of light, light has been recognized as being one of the major factors
influencing the growth and other characteristics of vegetation. Plant
ecologists have considered light conditions to be one of the important
factors in instituting succession. Foresters have based their theories and
practices of silviculture upon the light requirements of the forest trees.
When it became possible to measure light conditions under the forest,
the decrease in intensity was found to be exceedingly great. Salisbury
(24) gave values as low as o.I6 to 1.3 percent of full sunlight in an oak-
hornbeam forest. His upper values were about IO percent. Kvapil and
Nemec (i8) gave the average intensities under Austrian forests as 2 to 15
percent of outside light. Measurements of the total radiant energy under
a 70-year-old mixed hardwood stand near the Boyce Thompson Institute
gave values ranging from o.5 percent in dense shade to i6 percent in sun
"flecks." A dense stand of sumach allowed only 2 percent of the energy
to pass through. Measurements by other workers indicate that under a
well stocked stand the light intensity is usually below IOpercent of outside
intensity and often as low as I percent. The intensity at any one spot
varies greatly from time to time depending upon whether or not a "fleck"
of direct sunlight strikes it.
Light under a forest canopy suffers not only a great depletion in intensity
but also a change in quality or spectral energy distribution. Knuchel (I7)
found the light under a beech forest to contain about I2 percent green and
yellow, 7 percent red, and less than 5 percent of blue and violet, as compared
with zenith skylight in the open. Similar results were obtained for other
broad-leaved trees. The change in quality was more pronounced when
the sun was shining than when the sun was hidden by clouds. Knuchel
found no significant change in the light quality under spruce and fir canopies
or other needle-leaved species. The measurement of the light quality
under a forest canopy is a difficult problem. Knuchel's measurements
seem to be the most reliable ones made to date.
1 Contributions from the Boyce Thompson Institute for Plant Research, Inc., Yonkers,
New York, published at the expense of the Institute out of the order determined by the
date of receipt of the manuscript.
354
This content downloaded on Wed, 2 Jan 2013 09:45:23 AM
All use subject to JSTOR Terms and Conditions
May, I929] SHIRLEY -LIGHT AND GROWTH 355
Klugh (I5, I6) measured the spectral quality of forest light. He
found a spruce-cedar swamp forest to transmit 0.036 percent in the orange
region, 0.33 percent in the green, and 3.05 percent in the blue-violet region.
The reason for the discrepancy between these two sets of measurements is
largely due to the fact that Knuchel compared forest light with skylight,
while Klugh compared it with sunlight. Skylight has its maximum in-
tensity in the blue-violet region of the spectrum, while the maximum energy
of sunlight is in the yellow-green region (Kimball, I4). In the forest,
skylight forms a much higher percentage of the total light than it does
outside. The quality of daylight is thus changed in two ways in passing
through a leafy canopy. Through partial absorption by leaves the light
loses more red and blue than green and yellow. By decreasing the pro-
portion of sunlight to skylight the red region is diminished more than the
blue. The latter change seems to be of much greater importance than the
former.
In the past there has been a tendency among plant ecologists and
foresters to over-emphasize the importance of light at the expense of other
factors. Experiments on trenched areas by Fricke (9) and Toumey (28)
have clearly demonstrated that survival and growth are often determined
by the extent of root competition for moisture and nutrients rather than by
light. However, moisture conditions alone are not sufficient to explain
why bunch grass and red cedar will grow in dry exposed rock crevices and
not in shaded ravines. Root competition does not account for the large
numbers of epiphytes and lianas which give the characteristic appearance
to the tropical rain forest.
The problem of the light requirements of plants is of importance to
the greenhouse man as well as the forester and the plant ecologist. Even
the fancier, who tries to grow plants in living rooms or sun porches, is
concerned with the light required to get healthy, vigorous growth of his
plants.
In the study which follows an attempt has been made to discover what
the light requirements for the survival of a few plants are, and how the
rate of growth changes with increasing light intensities. A study of the
effects of light quality upon growth has also been made, with particular
emphasis upon the blue region of the spectrum, as compared with the red.
DISCUSSION OF LITERATURE
Effect of Light Intensity Upon Photosynthesis
Blackman and Matthaei (2) and others have shown that with low
light intensities the rate of photosynthesis is almost directly proportional
to the light intensity if other factors are not limiting. At higher intensities
the slope of the curve falls off and approaches a line parallel to the axis, as
shown by Boysen-Jensen (4) and Harder (I3).
25
This content downloaded on Wed, 2 Jan 2013 09:45:23 AM
All use subject to JSTOR Terms and Conditions
356 AMERICAN JOURNAL OF BOTANY [Vol. I6,
Effect of Shading on Plant Growth
The effects of shading on plant growth were studied by Combes (6),
Garner and Allard (io), Lubimenko (I9), Popp (2I), Rose (23), Shantz
(27), and Zillich (29).
Lubimenko found that the almount of dry matter produced increased
with increasing light intensity up to a certain maximum and then decreased.
He states that the optimum intensity for growth increases as the chlorophyll
concentration decreases. His light intensities are all expressed in terms of
the transmission of a certain piece of glass. Robinia Pseudo-Acacia, Pinus
silvestris, Fraxinus excelsior, and Tilia parvifolia attained maximum dry
weight at intensities corresponding to that which would pass through 7, 9, 9,
and 27 layers of the glass respectively. Helianthus annuus attained
maximum dry weight under full sunlight. Lubimenko states that chloro-
phyll concentration increases with decreasing light intensity until a certain
maximum is attained and then diminishes. Plants having a high chloro-
phyll concentration have greater power to vary it, and can thus adapt
themselves to a wider range of intensities than those which have a low
chlorophyll concentration. They also attain maximum dry weight at
lower light intensities than plants having low chlorophyll concentration.
He found that height and leaf area behaved as dry weight but attained
maximum development at lower intensities. The percentage of dry matter
usually decreased with decreasing light intensity. He noticed that in
general root growth increases and stem growth decreases with increasing
light intensity within certain limits. Since no measurements of light
intensities were made it is difficult to compare his results with those obtained
by other investigators.
Combes (6) found the optimum light intensity for the production of
dry matter in plants to increase with increasing age of the plant. Maximum
dry weight of fruit always occurred in full light intensity. His optimum
intensities are somewhat higher than those given by Lubimenko, but
otherwise his conclusions are in general accord. Rose (23) obtained
maximum growth with full sunlight intensity. The shades used by Combes
and Rose were much larger and more satisfactory than those of Lubimenko.
Shantz (27) found the fresh weight of potato, cotton, lettuce, and
radish to increase with decreasing light intensity from 50 to I5 percent of
full sunlight in Louisiana. None of the plants he tested were able to grow
past the seedling stage when the light was reduced to 6 percent of full
sunlight. Dry weight determinations were not made.
Garner and Allard (io) found decrease in seed production and in dry
weight of tops of soy-beans when grown under shades. Zillich (29) noticed
a delay in the time of flowering and fruiting of plants grown under lattice
shades. The optimum intensity for green weight was 50 to 75 percent
intensity for most of the plants he used. He found that weeds attained
greater dry weight under reduced light intensities while cultivated plants
This content downloaded on Wed, 2 Jan 2013 09:45:23 AM
All use subject to JSTOR Terms and Conditions
May, I929] SHIRLEY -LIGHT AND GROWTH 357
always had maximum dry weight when grown in the open. He also con-
firmed many of the conclusions of Lubimenko.
Popp (2I) obtained the greatest vigor of growth of soy-beans in his un-
shaded plot, although the shaded plants had longer stems. Dry weight
measurements were not given.
In general, shading experiments show that the light intensity cannot be
reduced much below 50 percent of full sunlight in temperate regions without
causing a decrease in the growth of many plants. In the majority of
cases maximum dry weight was produced by plants receiving the full
normal sunlight of the region in which they were grown.
Experiments with Artificial Light
Burns (5) determined the amount of radiation from a Mazda lamp
required to maintain a carbon dioxid balance between the plant and the
surrounding air. At this intensity the carbon dioxid utilized in photo-
synthesis would just be equal to that given off in respiration. Comparing
this radiation intensity to that from the sun at noon of December 22, at
Burlington, Vermont, he found various tree species to have minimum light
requirements of from 2 to 17 percent of total solar radiation. In this
paper the radiation from neither the lamp nor the sun were given in absolute
heat units. Thermopile measurements of total heat energies cannot be
used directly to compare artificial light with sunlight in their effects on
photosynthesis due to the differences in color temperature or spectral
energy distribution of the sources. The carbon dioxid concentrations
maintained by Burns in the assimilation chamber were considerably above
that of normal air, being on the average o.5 percent. Since the rate of
photosynthesis varies with the carbon dioxid concentration as well as the
light intensity, a concentration of o.5 percent would cause a carbon dioxid
balance at lower light intensities than at a concentration of 0.035 percent.
It must also be borne in mind that the photosynthetic performance of any
plant is influenced not only by the light conditions under which it has been
kept during the twenty-four hours preceding the test period, but also upon
the light conditions during a much longer preceding period. Rose (23)
showed that plants grown under a low light intensity were able to assimilate
carbon dioxid at a much faster rate in low intensities than similar plants
which had previously been growing under high light intensities. Short-
time experiments upon the rate of gas exchange of plants under artificial
conditions are valuable in studying the physiology of the plant, but it
seems highly improbable that the results of any such experiments can be
applied directly to account for the growth of plants growing under natural
conditions.
Grasovsky (II), using the apparatus developed by Burns, found a
zero carbon-dioxid exchange with white pine at 174 foot-candles. This is
probably about the same intensity found by Burns but is expressed in
relative light units.
This content downloaded on Wed, 2 Jan 2013 09:45:23 AM
All use subject to JSTOR Terms and Conditions
358 AMERICAN JOURNAL OF BOTANY IVol. i6,
d 1- L
O H LO O
0
= O -
C |
CT
02< 1o m sci
x U) O
rs | (1 U>) LOH O
C C I D
CfC'I
m C C) 1 - ss0
C O
C l0
C/). CICCI
'U) ' 0
CZ
Z. C.0U)O
. a E ~~~~O
t- 
So
S _ __
_B C
) C )
CZ)
4.1 . .111 LO
.
C:
C) 00000
C) ~ ~ CCC
.C 0C-Cf
This content downloaded on Wed, 2 Jan 2013 09:45:23 AM
All use subject to JSTOR Terms and Conditions
May, I929] SHIRLEY -LIGHT AND GROWTH 359
Bates and Roeser (I) grew coniferous seedlings for a period of nine
months under artificial illumination of IO hours daily duration. The
experiment was arranged so that the plants grew at varying distances
from the light source. By measuring the radiation intensities under
which the plants survived, a minimum light requirement was obtained.
This intensity was compared by the use of a thermopile with noon summer
sunlight at Colorado Springs, Colorado, for the year of 1926. The method
of comparison is open to the criticism made of Burns's work. Redwood
survived with 0.62 percent and pifion pine with 6.3 percent of total solar
radiation. Their curves showing the amount of dry weight produced at
different light intensities show a straight line for redwood, which has the
lowest light requirement, and curves convex downward for western yellow
pine, Douglas fir, and pifion pine. The curve for Engelmann spruce is
S-shaped.
Davis and Hoagland (8) reported on the growth of wheat under artificial
conditions. They found the dry weight produced to be directly pro-
portional to the light intensity over the range of intensities they used.
Dry weight seemed to bear an exponential relation to the length of day.
Effects of Light Quality on Growth
The effects of light quality upon the.growth and form of plants was
studied by Popp (22). He found very little difference between plants
grown under full sunlight conditions and those grown in the absence of
ultra-violet radiation. When all wave lengths shorter than 529 m,uwere
removed the growth was poor, the plants were weak, and lower in fresh and
dry weight. When the dry weight per unit intensity is considered the
plants grown under the complete solar spectrum appear to have the ad-
vantage. This result is exaggerated by the fact that the intensity was
lower in this light quality than in any other except that of house 5, which
eliminates all the blue. Table I is taken from Popp's data.
The effects of different ranges of wave lengths on the anatomical develop-
ment of plants were studied by Miss Pfeiffer (20). The full solar spectrum
gave better development as expressed by greater stem thickness, height, leaf
thickness and differentiation, and extent of root system, than any of the
other qualities used, with the visible spectrum next best. The red and
blue were poorest, partially due to their lower intensities.
Sayre (25) studied the chlorophyll development in different spectral
regions. He found no chlorophyll development in wave lengths longer
than 68o millimicrons. In the visible region chlorophyll formation occurred
in all spectral regions if sufficient energy were present, the red being most
effective, followed by the green and blue. The chlorophyll development
was judged by noting the relative greenness of the plants.
This content downloaded on Wed, 2 Jan 2013 09:45:23 AM
All use subject to JSTOR Terms and Conditions
360 AMERICAN JOURNAL OF BOTANY [Vol. i6,
METHODS
Light Conditions
In experiments designed to study the effects of light conditions Llpon
plant growth either sunlight or artificial light may be used. Sunlight
varies over wide limits from day to day and from hour to hour, in addition
to its seasonal variations. Davis and Hoagland (7) grew wheat plants
for 30 days at different times during the year and found variations in dry
weight of from I5.2 grams to 97.5 grams per IOOtops. The temperature
was maintained at 20.50 C. throughout the year. These results are
attributed to variations in solar radiation. The magnitude of the daily
and seasonal variation in solar radiation may be appreciated from an
examination of meteorological reports. All light experiments described
below were carried out at the Boyce Thompson Institute for Plant Research
at Yonkers, New York. The sunlight conditions prevailing during the
time of any experiment are shown in the reports of the New York Meteoro-
logical Observatory.
Owing to these great variations in sunlight, it is difficult to carry out
quantitative experiments on the effects of sunlight intensity on plant
growth, and it is impossible ever to duplicate exactly the light conditions
of one experiment in a later one. Artificial light may be maintained fairly
constant, but it differs greatly in quality from sunlight. In this work both
artificial light and sunlight have been used.
Constant-condition Room
The plants grown under artificial light were placed in the constant-
condition room at the Boyce Thompson Institute (3). In order to get a
range of intensities two I,soo-watt lamps were suspended in front of the
air inlet (P1. XXVIII, fig. i). The light intensities varied from 20 to 700
foot-candles depending upon the position in the room. Hourly variations
in light intensity were negligible as shown by the pyrheliometric record.
TABLE2. ShadingClothUsedfor Greenhouse
antdOut-of-door
Shades
Average LighitIntensity
Green- Oult- Mesih (Percent of Outside)
house side ShiadingCloth Used (No. Threads
Shade Shade per Inch)
Greenhouse Outside
E 2 layers muslin 52 x 56 I.0
D d I layer muslin 52 x 56 8 20
C c i layer cheesecloth 36 x 40 I9 47
B b i layer cheesecloth 24 X 24 40 74
A a none - 71I 00
The lamps did deteriorate during the course of the experiment and were
replaced on May i. Temperatures were uniform throughout the room.
At a distance of two feet below the lamps the rise in temperature due to
This content downloaded on Wed, 2 Jan 2013 09:45:23 AM
All use subject to JSTOR Terms and Conditions
May, I929] SHIRLEY -LIGHT AND GROWTH 36I
their heat was less than o.5? C. Continuous records of temperature as
measured by both wet and dry bulb thermometers were taken by Cambridge
resistance thermometers. The temperature varied from 250 to 270 C.
with an average of 260 C. and the relative humidity varied from 89 to 93
percent in both light and dark rooms. Normal atmospheric carbon dioxid
concentration was used.
The plants shaded one another to some extent. This shading was
taken into account in making the light measurements.
Greenhouse Shades
Four wooden frames, 3 x 52 x 4 feet high, were placed in the green-
house and covered with different weaves of cloth to provide a range of
light intensities (P1. XXVIII, fig. 2). Table 2 shows the arrangement.
The transmission of the shading cloth was measured at 8 different wave
lengths distributed over the visible spectrum by means of a Konig-Martens
spectrophotometer. The transmission of the cloths used was the same
for all wave lengths tested.
Measurements of light intensity in the different shades were taken with
the Macbeth illuminometer on cloudless days between the hours of
I I:OO A.M. and I2:30 P.M. The measurements were taken in foot-candles
and compared to total daylight intensity. These percentage intensities
TABLE 3. Temperature and Humidity Conditions in Greenhouse Shades,
October24-March 23, I927-28
Shade ............................. E D C B A
Temperature, degrees C.
Maximum recorded .28 28 29 30 30
Minimum recorded.............9 ..I9 I9 I9 I9 Ig
Mean .24.2 24.0 23.9 23.3 23.7
Average algebraic deviation from daily
mean. +0.5 +0.3 +0.2 -o.6 -0 .4
Average absolute deviation from daily
mean .o.6 0.4 0.4 o.8 0.9
Mean weekly evaporation from Living-
ston standardized atmometers, cc.
of water ........i.i............ II8 95 IOO 76 73
showed some variations with the progress of the season, due in part to the
change in the angle with which the sun's rays struck the greenhouse glass.
Owing to the seasonal variations in illumination only plants grown at the
same time can be safely compared.
Each shade was provided with forced ventilation from a commercial air-
conditioning machine. The temperature and humidity variations in the
different shades were thus kept at a minimum (table 3).
Temperature conditions during the summer were higher and showed
average deviations of 0.50 to 0.90 C.
This content downloaded on Wed, 2 Jan 2013 09:45:23 AM
All use subject to JSTOR Terms and Conditions
362 AMERICAN JOURNAL OF BOTANY [Vol. i6,
The temperature table was made up from daily readings of thermometers
placed in the different shades. Readings were made at all hours of the day,
but most of them were made at about noon when the deviations were largest.
Outside Shades
Three cubical wooden frames 8 feet on a side were set up in the garden
and covered with one layer of the three shading cloths used in the green-
house shades. Figure 3 of Plate XXVIII shows a view of a shade with
one side removed. Forced ventilation was supplied the three shades from
a fan at a rate calculated to provide for a complete air change every one
and one-half minutes.
Temperature and evaporation conditions are shown in table 4.
TABLE 4. Temperature and Evaporation Conditions in Outside Cages, June 8-August i
Shade .............................................. D C B A
Light intensity, percent ....................... 20 47 74 100
Temperature, degrees C.
Maximum recorded .......................... 32 34 34 33
Minimum recorded........................... 15 14 14 14
Mean . 25.2 25.0 24.7 24.8
Average algebraic deviation from daily +0.3 -0. I
- 0.3
Average absolute deviation from daily mean .... 0.5 0.4 0.3 0.5
Mean weekly evaporation from Livingston stand-
ardized atmometer cups .47 66 72 85
Spectral Houses
To test the effect of light quality upon growth, plants were grown in
the spectral glass houses at the Institute. These houses were described by
Popp (22). A blue glass has been substituted for the window glass and
Corex has been substituted for G 86 B. The house numbers have been
rearranged slightly.
Text-figure I shows the spectral transmission curves in the visible
region of the different glasses used as measured on the Konig-Martens
spectrophotometer. Text figure 2 and table 5 show the limits of trans-
mission as determined by the Hilgar quartz spectrograph.
TABLE 5. Visible and Ultra-violet Spectral Regions Transmitted by the
Various Light Filters Used
House Name of Wave Lengths Trans-
No. Glass mitted (millimicrons)
I. Noviol "0" 389-720
II. Corex" 290-720
.I. G 403 ED 374-585
IV.Noviol "C," 472-720
V.. G 34 529-720
The glass was manufactured by the Corning Glass Company.
This content downloaded on Wed, 2 Jan 2013 09:45:23 AM
All use subject to JSTOR Terms and Conditions
May, I929] SHIRLEY -LIGHT AND GROWTH 363
Temperature and humidity conditions prevailing in the houses at the
time of growth are shown in table 6.
TABLE 6. Temperature and Evaporation Conditions in Spectral Houtses, July i-October 22
House . .................................. I II III IV v
Temperature, degrees C.
Maximum recorded ................. 42 40 40 38 39
Minimum recorded .................. 20 20 I9 I9 I9
Mean ............................. 29.8 27.8 27.4 27.3 27.2
Average algebraic deviation from daily
mean . +2.0 -0.I -0.3 -o.6 -o.6
Average absolute deviation from daily
mean ............................ 2.0 0.5 o.6 0.7 0.7
Mean weekly evaporation from Living-
ston standardized atmometers, cc.
of water ......................... I04 I43 I30 I43 I22
TRANSI//SI/OA OF 69PEC7TPA
L GLA SSES
_~~I T. T F"'"
*8 W/LET BL.UE GREEN YELLtR
'/ORANG&E RED
V
f2 0 1/60 6J00~40 .580 62O 660 700
WAVE L ENGTH I/L
L/Af/CRONS
TEXT FIG. I. Transmission curves for glass of spectral houses. The Corex, house II.
was unpolished. Actually it transmits about 8o percent of the light instead of 25 percent,
The measurements were made on a Konig-Martens spectrophotometer.
In order to secure comparable light intensities two shades were arranged
in each house, so that in each quality condition three intensity conditions
were maintained. Light intensity measurements were made with thermo-
piles and with the Macbeth illuminometer. Measurements made with the
two instruments showed fairly close agreement.
This content downloaded on Wed, 2 Jan 2013 09:45:23 AM
All use subject to JSTOR Terms and Conditions
364 AMERICAN JOURNAL OF BOTANY [Vol. I6,
'0
.0
Y~~~~~~~~~
C
CO
C
C
0
N
0X
'0
10)
.0
1-4
Cl)C.
bOw
X .m,
0 )0
0
C.)
0)
a
YE
&i~~~~~~~~~~~
a
=~~~~~~~~~~~~~~~~~~~~~
.ut~~~~~~~~~~~
This content downloaded on Wed, 2 Jan 2013 09:45:23 AM
All use subject to JSTOR Terms and Conditions
May, 1929] SHIRLEY - LIGHT AND GROWTH 365
Effects of Differences in Soil Moisture on the Dry Weight and
Root Development of the Bean Plant
Since it is very difficult to maintain soil moisture uniform in pots placed in a series of
shades, the question arises as to whether or not slight variations in moisture are likely to
cause significant differences in the dry weight. Accordingly a special experiment was car-
ried out at the Connecticut Agricultural Experiment Station in New Haven, to answer this
question.
An early variety of red bunch bean was grown in a rich medium sand soil in two-gallon
glazed jars. The moisture content of the jars was controlled by filling to weight every other
day. The water was added through a glass U-tube which ended in an inverted clay pot
filled with gravel. The water distributed itself uniformly through the soil except for the
upper inch in the drier pots.
The soil moisture varied from a point where the particles of soil would scarcely cohere,
to a point where moisture would drip from the soil. The plants in the driest soils sometimes
TABLE 7. The Influence of Soil Moisture on the Dry Weight and
Root Development of the Bean
Soil Moisture Dry Weight
(percent of of Tops, io Root Development
dry weight) Plants (grams)
7.. 22.6 very extensive
IO. 22.3 very extensive
II . 20.8 very good
I2 . 23.7 very good
I5. 22.6 good
I6. ............................ good
I8 20.3 good
i8 .......................... 2 4 .92. good
25 ..... 29.4 poor
27 .-. .... 24. I poor
wilted slightly on bright days. Table 7 shows the results obtained. An examination of the
table shows that no significant differences in dry weight were produced by the experimental
conditions imposed on the plants.
Species Used
The following species of plants were used in these investigations: buck-
wheat (Fagopyrum esculentum Moench.) variety Japanese; dwarf sunflower
(Helianthus cucumerifolius Torr. and Gray); Galinsoga parviflora Cav.;
avens (Geum canadense Jacq.); green and purple wandering Jew (Trade-
scantiafluminensis Vell. and Zebrina pendula Schnizl.); hog peanut (Amphi-
carpa monoica (L.) Ell.); California redwood (Sequoia sempervirens Endl.);
loblolly pine (Pinus Taeda L.), tomato (Lycopersicum esculentum Mill.)
variety Bonny Best; tobacco (Nicotiana Tabacum L.), variety Turkish.
Treatment of Plant Material Before and During the Experimental Period
The plants were grown in a rich composted loam soil, containing a
high sand fraction. The soil was sterilized with steam and leached before
using. Eight-inch clay pots were used for growing all plants except tomato
and tobacco, which were grown in two-gallon jars perforated at the bottom.
Buckwheat seed was sown in the pots. When the cotyledons had com-
This content downloaded on Wed, 2 Jan 2013 09:45:23 AM
All use subject to JSTOR Terms and Conditions
366 AMERICAN JOURNAL OF BOTANY [Vol. x6,
_
2
?~0
/.8 -
1.6
/4
1.0
ConstoonLl9ht Room
/2 Hoilr Day
0.8
0
|ockwheat
48 days
8| Sunf/os'er 48dayT
(JoRedwood J5days
/ Geum c54c/ays
z as
lr I / J e Galinsoqa 3Sdays
0,C6
404
/00 20 00 400 500 600 700
Liqht intensity Foot Candles
TEXT FiG. 3. The influence of 12 hours daily artificial illumination of different
intensities on the production of dry matter in plants. The dry weight is almost directly
proportional to the light intensity.
This content downloaded on Wed, 2 Jan 2013 09:45:23 AM
All use subject to JSTOR Terms and Conditions
May, I929] SHIRLEY -LIGHT AND GROWTH 367
pletely unfolded the plants were thinned to I5 to 25 plants per pot, and
allowed two or three days to adjust themselves before placing under the
shades. All other plants were transplanted to the pots soon after their
first pair of leaves had unfolded. Redwood and loblolly pine seedlings
were usually 2 to 5 centimeters high when placed in the cages. Geumwas
I to 2 months old. A sample of each species of plants was taken for dry-
weight determinations at the start of an experiment to determine the
05
04
Coanstofnl
L,ghr Room
Com'inoes l/t/fl(JifatIa //
03
02
0/ eum
'3
Hoy Peanwot
b / @ GaZirsoga~G
,/ @ s/ Jcaff
o Redwood
Q /0 20 30 f0 50 60 70
L/ght Intens/ty Foot C(and/es
TEXT FIG. 4. The influence of continuous artificial illumination of different in-
tensities on the production of dry matter in plants.
initial dry weight. For sunflower, buckwheat, and Gal'insoga 15 to 20
plants were grown per pot. Loblolly pine was grown IO to the pot, and
Geum and redwood 5 plants to the pot. Tobacco and tomato were grown
in in dividual pots.
This content downloaded on Wed, 2 Jan 2013 09:45:23 AM
All use subject to JSTOR Terms and Conditions
368 AMERICAN JOURNAL OF BOTANY [Vol. i6,
The plants were watered and examined daily. Measurements were
made of height each week, and notes taken on the general appearance and
progress of the plants.
Analysis of Plant Material
The annual plants were grown until flowering and usually until fruiting
had started. Before harvesting, one or more average dominant plants
were chosen from each pot for leaf area and chlorophyll determinations,
except in tomato and tobacco where only one leaf from each plant was
used. A blueprint of the leaves was made and the area determined by a
planimeter. After blueprinting, the leaves were used for chlorophyll
GREEI7HO/S
Firsr Series
I Z6'uc/wheat OCt/a-Nov-25T
* Ga/lnsoga Oct:24-iov229
V./ 0 r 7 o Sunflower 0ct24-A0oz13-0
065 0 /Jo3 36 4to 50 .60 71
Li
/ght intensity per ce7t of toata sun/iht
TEXT FIG. 5. The production of dry matter in different intensities of daylight.
The curve for buckwheat is convex upwards while the others are approximately straight
lines.
determinations. Chlorophyll was estimated by the method of Willstatter
and Stoll as modified by Schertz (26). A colorimeter was used to compare
the pigment with a standard made up from crystalline chlorophyll, and the
standard described by Guthrie (I2).
The remaining plants were used for fresh- and dry-weight determinations.
The plants were cut off at the surface of the soil and the tops weighed
This content downloaded on Wed, 2 Jan 2013 09:45:23 AM
All use subject to JSTOR Terms and Conditions
May, I929J SHIRLEY -LIGHT AND GROWTH 369
immediately. TI'heywere then taken to a cold room and frozen. The
next day the frozen plants were run through a food chopper. The ground
material was thoroughly mixed and a proportionate sample taken for
GREENA/O1SE
SHA
DES /927-1928
7-
.6-
4
4 &eaccotdseries/
ouelcAwheat Dec 25- Fe'/ /
* Ga/r7soya Dec /6 -Jlar/14-
o6Surn/owler Dec/16-J-?aJ//
SUNFLOWC
/a5 /0 /6 20 30 L0 50 55 60
I I/ght 1ntensity per cenrr o07 o7-at/ s&nl//917
TEXT FIG. 6. The influence of shading in midwinter on the production of dry matter.
These curves approximate straight lines closer than those of text figure 5 where the total
amount of light received was greater.
moisture determination. If the plants were small the entire plant was
used for a moisture sample. The moisture samples were dried to constant
weight in a vacuum oven run at 700 C. The roots of redwood, loblolly
pine, and Geumwere washed otutand dried separated from the tops.
This content downloaded on Wed, 2 Jan 2013 09:45:23 AM
All use subject to JSTOR Terms and Conditions
370 AMERICAN JOURNAL OF BOTANY [Vol. i6,
In each experiment from 2 to 6 pots of plants were used in each light
condition. In the analysis of the material for fresh and dry weight the
plants of each pot were treated separately so that the average deviations
for the individual pots could be calculated. The complete data taken on
each set of plants were considered too bulky to be included in this paper.
The curves and data presented are the mean values from a large number of
plants. In the constant-condition room 20 redwood and Geum plants
were grown in each intensity and 40 of all other plants. In the spectral
house shades io Geum plants and 30 sunflowers and Galinsoga plants were
grown in each condition. In the greenhouse and outside shades from 15
to 30 of each perennial species, and 30 to I50 of each annual species, were
used in each shade except tomato and tobacco, of which six were used.
RESULTS
Light Intensity Studies
In the constant-condition room with 12 hours daily illumination all
plants except sunflower survived for the period grown with less than 50
foot-candles illumination (table 8). Although sunflower showed some
TABLE 8. Survival at Low Intensities
No. of Light In- Per- Percentage In-
Plant Days tensity (foot- centage crease in Dry
Grown candles) Survival Weight
Sunflower ....................... 48 46 0
Geum .......................... 54 41 90 358
Redwood ....................... 55 30 90 66
Galinsoga ....................... 35 25 92 I ,670
Buckwheat ..................... 48 26 96 2,500
growth at first in the lower intensities, it died before the experiment was
closed. The buckwheat plants had started to die in the lower intensities
when harvested.
Of the plants grown under shades, all except sunflower showed 50-
percent survival under the lowest intensities maintained, from 0.5 to 1.5
percent of total sunlight. Sunflower survived better under I-percent
intensity during the winter than during the summer. This was probably
due to the higher temperature in summer which increased the rate of
respiration. Redwood plants survived for 6 months with I-percent sunlight
intensity but half of them had died by the end of the seventh month.
Loblolly pine survived five months under the same conditions but was
dying by the end of the sixth. The herbaceous plants were grown for
much shorter periods of time.
Production of Dry Matter
With twelve hours daily illumination in the constant-condition rooms
the dry weight produced by the plants grown was almost directly pro-
This content downloaded on Wed, 2 Jan 2013 09:45:23 AM
All use subject to JSTOR Terms and Conditions
May, I929] SHIRLEY - LIGHT AND GROWTH 37I
portional to the light intensity up to the highest intensities available under
the two 1,500-watt lamps. A similar result was obtained with continuous
illumination except that at 70 foot-candles hog peanut showed a decrease
due to the injury caused by continuous illumination (text figs. 3 and 4).
During the winter the dry weight produced by the shaded plants was
almost directly proportional to the light intensity received up to the highest
intensities available in the greenhouse (text figs. 5, 6, 7). During the
summer, some plants in the greenhouse shades showed a tendency to use
the light less efficiently at the higher intensities (text fig. 8). The plants
grown in the outside shades under lower night and day temperature con-
ditions showed different shaped curves (text fig. 9). The slope of the
GPEE/V
HOISE SHA
DE? /928
W,. I . I . I
202
L
1~~~ET
OO voV/7-A/AR/'I-
GAIDJN06
20 *0 60
8
L/6HT /NTEN/J TY PE'RCENT OF SUNL/6/IT
TEXT FIG. 7. The effect of different daylight intensities on the productionof dry
matter in plants in the early spring. Only one series of redwoodand Geumgave curves
convex upwards. The relative positions of the curvesare not significant.
curves decreased and there was a tendency to develop maximum dry weight
at lower light intensities than inside. The light intensity may be reduced
50 percent during midsummer without seriously affecting the growth of
the plants studied. A further reduction to 20-percent intensity caused
decreased dry weight for most of the plants used. Later in the season
the same plants gave curves convex downward but not tending to run
parallel to the axis (text fig. io).
Redwood and Geum produced maximum dry weight at 50 and 75
26
This content downloaded on Wed, 2 Jan 2013 09:45:23 AM
All use subject to JSTOR Terms and Conditions
372 AMERICAN JOURNAL OF BOTANY [Vol. i6,
Greehouse Shades /928
8 P~~~~~~~~~~~~~ellwood
A/arch1
2 7- 0cZac?
7.0
Tomato Apr 30-duPe5 |
6.0
GetunA/arch2 7-dJne 4
40
Q / / Sunf/ow,erJut7e5-Auy. /13
La
b/oily Apr.30 Oct9
// f/ower sep7;26-&c7; 29
04
goLI/Hog Peanutr Aarch2 7-dlone
61a/h7soga Sepr7- Ocr) /1
0 20 '9o 60 80 /00
L/htite/neity percent- of taTa/ snun/hb7t
TEXT FIG. 8. The effect of different degrees of shading on the production of dry
matter in plants grown in the greenhouse in midsummer. Tomato, hog peanut, and Geurn
show a decrease in the efficiency with which they use light at the higher intensities. For
all other plants the dry weight is almost directly proportional to the light intensity. The
relative position of these curves is not significant.
This content downloaded on Wed, 2 Jan 2013 09:45:23 AM
All use subject to JSTOR Terms and Conditions
May, I929] SHIRLEY- LIGHT AND GROWTH 373
percent of full summer sunlight. When placed in direct sunlight, growth
in these plants, together with loblolly pine, appeared to have been arrested.
They immediately developed considerable red pigment in the leaves, while
the tips of the leaves turned brown and died. Later they apparently
Oi,Aside sh/des L4A'e
/ fo' Sept 26, /928
8~
/670
'.0 ,
T~~~~ ~e
o-~ ~ ~uto-or in mismmr At thstm-fyarardcint
~~~~~~~~~~~~~~~~~~~~~~~~~~~~~~~~~~~~~~~~~~~~~~~10
13
e0 40 608 o
on-afof full daylight caused-little decrease in dry weight.
beaeadjusted and were growing nicely when harvested. All other
ulassed produced maximum dry weight in full summer sunlight.
Tcareful examination of the curves will show a slightly different shape
This content downloaded on Wed, 2 Jan 2013 09:45:23 AM
All use subject to JSTOR Terms and Conditions
374 AMERICAN JOURNAI, OF BOTANY [Vol. i6,
for different species under comparable light intensities. The curves for
Geum, hog peanut, redwood, tomato, and buckwheat show a tendency
towards being convex upwards while for sunflowers, tobacco, and Galinsoga
the curves are nearer straight lines or convex downward. As one would
expect, plants which usually grow in the shade, as Geumrand hog peanut,
(2/&ade shades Au9./0to Sept. 20, 1928
-I - -
10,ep1,
2600
o~~~~~~~~c~~f
15.0 0
k Or
i-..~~~~~~~~~~~~~~~~~~~6
0.0 a AV S
4~~~,
.0, 110"~ ~ ~ ~ 11
20 /0 60 80 /00
Light inten4sity per cent of to-al sul/i//ht
TEXT FIG. IO. The production of dry matter in plants under a range of daylight
intensities in the late summer. Any decrease in intensity at this time of year caused a
corresponding decrease in the production of dry matter.
were found to use light less efficiently at high intensities than at low ones.
On the other hand, one would expect plants which usually grow in sunny
habitats to use light with equal or greater efficiency at moderately high
intensities than at low intensities. Sunflower and Galinsoga maintained
their initial efficiency rate at considerably higher intensities than Geum
and hog peanut.
Total Solar Radiation Requiredfor Growth
Hourly records of the total solar radiation in gram calories received on a
square centimeter of horizontal surface are published each month by the
This content downloaded on Wed, 2 Jan 2013 09:45:23 AM
All use subject to JSTOR Terms and Conditions
May, I929] SHIRLEY -LIGHT AND GROWTH 375
New York Meteorological observatory located in Central Park, New York
City. The Boyce Thompson Institute for Plant Research is only I3 miles
from this observatory, so it seems reasonable to assume that the radiation
GREEA///O/SE S/A4DES /1927-/929
I~ ~ ~~~~~~~~~~~~~
I
.8_/
.6
f1 t St41WFLOWER
.2 A
R. rCJA
NTI'
X~~~~~~~~~~O~1 NOVfS029
3 4 GAL/
INOGA
.2 PDC
6M
./
O-e
0 /000 J00 3000 4000 5000
TOUALSOL5AR/?DAT/&/ CE/VED GPAA CALORIES
TEXT FIG. II. The influence of total solar radiation received on the production of
dry matter in plants. Note that the plants receiving the longer daily period of illumination
grew better than those grown in midwinter.
received at the Institute over a period of a month or more would be approxi-
mately equal to that received at Central Park.
Text figure ii shows the amount of dry weight produced per plant per
gram calory of radiation received on a square centimeter of horizontal
This content downloaded on Wed, 2 Jan 2013 09:45:23 AM
All use subject to JSTOR Terms and Conditions
376 AMERICAN JOURNAL OF BOTANY [Vol. I6,
surface. During the period over which these plants were grown the
temperatures were held fairly uniformnas shown above. It will be noticed
that for both Galinsoga and sunflower the plants grown in midwinter with
62ctside 6She s /
7
I~~~~~~~~~~
/3
7
0 20 .9C 60 80 /00
L1h9'tisfenifty per cel7t of fotcl/ sun/li/ht
TEXT FIG. I2. The influence of light intensity upon the percentage of dry matter in
plants.
the shortest day lengths produced the least dry matter per unit energy
received. This is in accord with results presented by Davis and Hoagland
(8). Aside from this point the correlation between plants grown at one
This content downloaded on Wed, 2 Jan 2013 09:45:23 AM
All use subject to JSTOR Terms and Conditions
May, I929] SHIRLEY -LIGHT AND GROWTH 377
time as compared with another is not close. This lack of correlation is
partly due to the fact that the plants were not all harvested at the same age.
Percentage of Dry Matter
The percentage of dry matter in the tops of plants increased with
increasing light intensity, as shown in text figure 12.
OAit/de shades /928
, I 'I lI
/~~~~~~~~~~~~~~~~~~~~
1-..~ ~ ~~~~~1
Loll jun?e'
o~~~~~~~~~~~~~~~~~~~~~~~~~~~
O f90 60 80 /00
LiXhfb intensityper cent of totial sal7li9ht
TEXT FIG. I3. The influence of light intensity on the proportion of root to shoot,
Ratio of Root to Shoot
Low light intensity favors top growth at the expense of root growth.
This is well demonstrated in the ratio of dry weight of roots to dry weight
of tops (text fig. I3 and P1. XXIX).
Height Growth
With decreasing light intensity the plants studied tend to increase their
height. The height attains a maximum at about 20 percent of full summer
sunlight, or 6o percent of late summer sunlight (text figs. I4 and I5 and Pls.
XXIX-XXXI). Upon further decrease in light intensity the height
This content downloaded on Wed, 2 Jan 2013 09:45:23 AM
All use subject to JSTOR Terms and Conditions
378 AMERICAN JOURNAL OF BOTANY [Vol. i6,
falls off rapidly. It seems evident that the light intensity cannot be reduced
below the point at which maximum height growth occurs without causing
incipient starvation of the plant. Plants under high light intensities tend
6tfSide Shades' /192P
i .-
Z
/20
20
f8 60 80 /00
Liqht
intenosity
pe?r
cent7
of-taol
Jwsunllyht
TEX:T FIG. 14. The influence of light intensity on the height growth of plants.
Contrast with text figure 9, which shows the dry weight of the same plants. The tallest
plants usually had the least dry weight.
to attain complete height growth earlier than shaded plants due to the fact
that they mature earlier (text fig. i6).
This content downloaded on Wed, 2 Jan 2013 09:45:23 AM
All use subject to JSTOR Terms and Conditions
May, I929] SHIRLEY - LIGHT AND GROWTH 379
Strength of Stem and Form of Plant
The stems of the plants grown under low intensities were weak and
succulent, often too weak to support the plant (Pls. XXIX-XXXI).
The lack of sufficient woody material accounts for their weakness and
brittleness. The heavily shaded plants had long internodes and few
branches. The density of growth increased with increasing light intensity
te1~~~~~ I I
60 (Sw,.coIf
1.
t /~~~~~~~~~~~~~t
Z>20 Outside Shades /1928
00 20 g,o 60 80 /00
L1ift 17/-enslty per cewt of total awn//ght
TEXT FIG. I5. The influence of shading in late summer on the height growth of
plants. At this season a decrease to 20-percent intensity caused a decrease in height
growth. Text figureIO shows the dry weights of these plants.
Leaf Development
The leaf area per plant seemed to follow height growth rather closely
and attained a maximum at about the same light intensities. Leaf thick-
ness increased with increasing light intensity as shown by the weight of
Ioo square centimeters of leaves and by cross section studies (text fig. I7).
The internal structure was also modified by light intensities. Under low
intensities the palisade tissue decreased from two layers to one layer, while
the intercellular spaces increased slightly.
Chlorophyll Concentration
Table 9 shows the chlorophyll concentrations per unit leaf weight and
per unit leaf area. For all plants studied there is a tendency to increase
the chlorophyll concentration with decreasing light intensities until a
critical intensity is reached. Further decrease in light intensity causes a
decrease in chlorophyll concentration. This is more pronounced when
This content downloaded on Wed, 2 Jan 2013 09:45:23 AM
All use subject to JSTOR Terms and Conditions
380 AMERICAN JOURNAL OF BOTANY [Vol. i6,
TABLE 9. Chlorophyll
Concentration
in Leaves
Plant Material ............................. Chlorophyll per io Grams Chlorophyll per IOO Sq. Cms.
Fresh Leaves (milligrams) Leaves (milligrams)
Outside Shades
Light Intensity (percent) ............ 20 47 74 IOO 20 47 74 IOO
Sunflowers, June 5-Aug. 20 .......... I7 II II 9 3.I 2.3 2.3 2.7
Tomato, June i-Aug. 8.............. 20 I5 I4 I2 3.5 3.3 3.2 3.6
Tobacco, June 5-Aug. I5 ............ I4 IO II 9 2.7 2.9 3.4 2.7
Galinsoga,June I-July 5............. I8 II II I2 2.7 I.8 I.9 2.3
Geum,June 5-Sept. 2I .............. I6 i6 IO I2 3-5 4.7 3-3 3-7
Galinsoga, Aug. i6-Sept. i6 .......... 32 20 24 i8 5.I 2.8 3.7 2.9
Tomato, Aug. io-Sept. 17 ........... 26 I5 I5 IO 3.5 3.0 3.2 2.9
Buckwheat, Aug. I7-Sept. I6. . . . I9 23 I9 I6 2.9 3.4 2.8 2.5
Greenhouse Shades
Light Intensity (percent) ............ I 8 I9 40 7I I 8 I9 40 71
Hog peanut, March 27-June 4 ... ..... 55 63 4I 38 28 3.I I.9 I.3 I.3 I.2
Geum, March 27-June 4............. 28 34 33 27 24 3.6 4.I 4.6 4.7 4.0
Galinsoga, June 5-Aug. 8 .. .......... 2I 29 3 I 25 22 3.3 3. I 3.4 3.0 3.0
Tomato, April 30-June 5............ 9 22 I8 I3 II I.9 2.8 3.I 3.I 2.4
Sunflower, June 5-Aug. I3 ........... - I7 I7 20 I2 - 2.5 2.8 3.3 2.3
considered on the basis of leaf weight than on the basis of leaf area. Sun-
flower has a relatively low pigment concentration, and shows relatively
slight variations with light intensity. Hog peanut, on the other hand,
showed higher concentrations and larger variations under different intensities
than the other plants used.
Flowering and Fruiting
The first flowers were produced at about the same time under all light
intensities unless the light intensity was so low as to seriously stunt the
growth. While shading caused no appreciable delay in the time of appear-
ance of the first flowers, maximum flower development occurred earlier
with the plants receiving the higher intensities. Ripened fruit also could
be found in all intensities at about the same time; however, in the higher
intensities maximum fruit development was earlier. Shading seemed to
prolong the vegetative and fruiting periods, while full sunlight intensities
hastened maturity. These observations on flowering and fruiting are
based on buckwheat and Galinsoga which flower and fruit on any day
length from 9 hours to 24 hours. Plants grown with less than io percent
of full summer sunlight produced only occasional flowers and no ripened
fruit. Sunflower never flowered on less than Ig-percent intensity; buck-
wheat and Gal'insoga,on the other hand, flowered with 8-percent intensity
but did not fruit.
Light QualityStudies
Dry Weight
Table io shows the production of dry matter with Io-percent light
intensity in the different spectral regions. The dry weight curves for Geum
are shown in text figure i8.
This content downloaded on Wed, 2 Jan 2013 09:45:23 AM
All use subject to JSTOR Terms and Conditions
May, I929] SHIRLEY- LIGHT AND GROWTH 38I
The entire visible and ultra-violet solar spectrum, house II, is more
efficient for the production of dry matter in the plants grown than any of
the other qualities used. Removal of the ultra-violet and some violet,
house I, causes no very significant decrease in efficiency. Blue light, house
III, also gave satisfactory growth. When all the blue is removed, as in
Height_9ro/thcurive
I I I II - - I' I I - I
Sunf/owers Oc2tside Sh/adees
Agnein-A .
w0ee
~~~~~~~
70 ~ ~ ~ ~ ~ ~ ~ ~ ~ ~ ~ ~~~~~~4
q) 60 Ar.
'1..~~~~~~~~~~~~~~~~~~~~~~~~~~~~~~~~~~~~1
~20
Aye In vveek6
TEXTFIG. i6. The influenceof different daylight intensities on the weekly height
growth of sunflowers. The plants in full daylight were always shorter. Those receiving
20-percent intensity continuedrapid height growth after the others had begun to mature.
TABLE IO. SpectralShades. Dry WeightperPlant in GramsUnderIo-
PercentLightIntensity
Wave Lengths Transmitted (millimicrons)
II III I IV v
290-720 374-585 389-720 472-720 529-720
Galinsoga, May 30-July 5.. 57 .3I .40 .30 .26
Galinsoga, July i-Aug. I5 .28 .20 .29 .i6 .10
Galinsoga,Sept. 9-Oct. I9 .. 55 .27 .63 .37 .17
Sunflower, June 5-Aug. I3 .i.i6 .55 .49 .13 .04
Sunflower, Sept. I9-Nov. I .40 .22 .55 .20 .II
Geum,July IO-Oct. 24 ..................2.30 I.32 i.o8 I.26 .63
This content downloaded on Wed, 2 Jan 2013 09:45:23 AM
All use subject to JSTOR Terms and Conditions
382 AMERICAN JOURNAL OF BOTANY [Vol. I6,
8ED 2
BED !
835D2
RED 5
TEXT FIG. I7. Camera lucida drawings of cross sections of buckwheat leaves of
This content downloaded on Wed, 2 Jan 2013 09:45:23 AM
All use subject to JSTOR Terms and Conditions
May, I929] SHIRLEY - LIGHT AND GROWTH 383
house V, a serious decrease in efficienicy results, while house IV is inter-
mediate in efficiency.
Form and Vigor
Normal plants have not been grown without the use of blue light (see
P1. XXXII). The plants of house V, minus blue, were tall and weak, thus
suggesting etiolated plants in appearance. The leaves were badly rolled
and often crinkled. Plants grown under the blue glass seemed to be stunted
somewhat, having very short internodes but rather sturdy stems. The
GecImSpectlral Shades
7,0 du/y/~0- Oct; 2L, /928 /
6.C
2 .0
K
~jA0
0 /0 20 30 4?0 50 60 70 80
Light intensity per cent of totat sunlfgh/t
TEXT FIG. I8. The effect of different light qualities and intensities on the production
of dry matter in Geum. Curve II is for normal daylight; curve I is minus ultra-violet;
curve III (dotted) is blue light; curve IV is minus violet and part of blue; curve V is minus
all the blue. Quality II is most efficient and quality V is the least efficient.
This content downloaded on Wed, 2 Jan 2013 09:45:23 AM
All use subject to JSTOR Terms and Conditions
384 AMERICAN JOURNAL OF BOTANY [Vol. i6,
plants from house II were always most sturdy and vigorous, followed by
those of houses I and IV. Blue light if of sufficient intensity prevents
excessive elongation and an etiolated type of growth.
Chlorophyll Concentration
Table ii shows the chlorophyll concentrations in the different houses.
TABLE II. Chlorophyll Concentration, Spectral House Shades
Chlorophyll per IO Gms. Clhlorophyll per Ioo Sq. Cms.
Fresh Leaves (mgs.) Leaves (mgs.)
- 4 o
25 2 23
~~~~~~)
~~~~~~~~~~~~~.~~~C
65 I5 I2 I7 14 15 3.7 2.0 5.8 2.2 2.2
290-720 I0 29 I6 27 28 38 5 5 2.8 4.6 3.8
4I .
5 27 - 22 29 3I 3.7 - 3.6 3.6 3.7
IO 20 i6 49 25 29 3.9 3.4 4.0 3.6 4.0
374-585 4 25 - 25 26 23 3.3 5.2 3.7 3.8
I 49 - 20 3I 28 7,3 - 4.2 4.5 4.7
47 13 I4 20 I7 i8 2.7 3.I 3.9 2.3 2.2
472-720 25 23 i8 27 29 24 3.6 2.7 4.4 3.8 3.2
9 i8 - 25 29 29 2.8 - 4.0 3.5 4.I
37 i6 20 I2 i8 19 2.8 4-3 5.3 2.7 3.0
529-720 19 I7 - I 7 24 I I 3.3 4.1I 3.7 3.6
3 24 - I7 23 20 3.9 - 2.4 4.1 3.4
In all light qualities used, the plants increased their chlorophyll concen-
tration with decreasing intensity to a certain point. For io-percent
intensity all qualities gave approximately the same chlorophyll concen-
tration-house V was usually lower and house III often higher than the
others.
DISCUSSION OF RESULTS
The light intensities needed for survival of the plants used seem to be
even much lower than the values given for other plants by Bates and
Roeser (i), Burns (5), and Grasovsky (ii). However, the determination
of the minimum light intensity required for mere existence of a particular
species is probably of little ecological significance, since the plants studied
demand ten times as much light or more for flowering and fruiting. It
seems probable that if several species of plants were competingo n an area
which was illuminated by a light intensity well above that required for
This content downloaded on Wed, 2 Jan 2013 09:45:23 AM
All use subject to JSTOR Terms and Conditions
May, I929] SHIRLEY -LIGHT AND GROWTH 385
survival the plants having the fastest growth rate would become dominant,
at least for the first generation, rather than those having the lowest light
requirement for survival. The difference in the ability to survive under
low light intensities may be due not so much to differences in the efficiency
of the photosynthetic equipment of different species as to differences in
the basal metabolism of the growing plant.
With increasing light intensity the rate of growth as measured by
increase in dry matter is almost directly proportional to the light intensity
up to 20 to 30 percent of full summer sunlight. Above 5o-percent intensity
the amount of growth increases very little with further increases in light.
While slight shading causes no marked deleterious effects, shading which
cuts out 80 percent or more of the light reduces the amount of growth
considerably.
The optimum light intensities for the production of dry matter were
much higher than those found by Grasovsky (II), Lubimenko (I9), and
Shantz (27). They are in approximate accord with the values given by
Combes(6), GarnerandAllard(10), Popp (2I), Ros6 (23), and Zillich(29).
In view of the wide differences in species used, methods of experimentation,
and especially of temperature and sunlight conditions, close agreement
cannot be expected.
The differences in the dry weight curves for the plants grown in the
greenhouse shades compared to the plants grown in the outside shades at
the same time are attributed in part to the higher range of light intensity
outside, but largely to the higher temperature conditions prevailing inside
the greenhouse. Temperature must have acted as a partially limiting
factor in the outside shades. This is in accord with the conclusions of
Blackman and Matthaei (2) for the influence of temperature on the rate of
photosynthesis, and with data presented by Davis and Hoagland (8),
which showed that the temperature required for optimum dry weight
production increased with increasing light intensity, within certain limits.
The correlation between dry weight produced and total solar energy
received is not close. To secure good correlation of these factors the
temperatures should be uniform, the day lengths should be the same, the
plants should be harvested at the same age, and the light intensities should
not be so high at any time as to either directly or indirectly inhibit the rate
of photosynthesis.
A number of investigators have reported on experiments on the effects
of light conditions upon the growth of plants in which height measurements
and notes of general vigor were used as criteria of growth. For the plants
used by the writer height and general appearance proved to be the least
reliable criteria, while dry weight of the entire plant and dry weight of the
fruit proved the most reliable. A comparison of text figures 9 and I0 with
14 and I5 shows that dry weights increased while height decreased with
increasing light intensity. Even fresh weight may be deceptive due to
This content downloaded on Wed, 2 Jan 2013 09:45:23 AM
All use subject to JSTOR Terms and Conditions
386 AMERICAN JOURNAL OF BOTANY [Vol. I6,
the much greater water content of the shaded plants. The necessity of
considering the roots of woody plants is well emphasized by the redwood
from the outside shades. At 2o-percent intensity the root formied only
25 percent of the dry weight of the entire plant, while at 0oo-percentin-
tensity the root formed 46 percent of the total dry weight. Low light
intensities tend to produce vegetative growth at the expense of flowers and
fruit, top growth at the expense of root growth, large leaf area at the expense
of leaf thickness, and succulence at the expense of sturdiness.
Of the plants investigated sunflower is the most exacting. It needed
more light for survival, more for flowering and fruiting, more for maximum
height growth, and more for attaining miaximumdry weight. Not only was
sunflower more exacting in its intensity demands but it also showed much
greater injury when grown in fractional parts of the solar spectrum than the
other plants used. Sunflower was able to use the light with almost equal
efficiency up to the highest intensities used, provided the temperature was
sufficiently high, while Geum and hog peanut showed a decided decrease in
efficiency at the higher intensities. The increased efficiency of Geum and
hog peanut at lower intensities may be attributed in part to their ability
to increase their chlorophyll concentration.
ECOLOGICAL SIGNIFICANCE
Since the light intensities under forest canopies are only O.I6 to 20
percent of full sunlight, and since a reduction of the light intensity below
20 percent of full sunlight causes a marked decrease in the amount of dry
matter produced by plants, it seems evident that the light intensities
prevailing under well stocked stands of forest trees are almost always
below the optimum for the growth of higher plants, and may often approach
the limiting values for survival. However, it should be borne in mind that
light is not the only growth factor which may be below the optimum in the
forest.
The change in quality of the light passing through the forest canopy,
on the other hand is not a serious factor in the growth of the plants. The
loss of the blue spectral region due to absorption by the leaves is more than
compensated for by the gain in percentage of skylight as shown by Klugh's
measurements (15, I6). The loss in the red region causes no significant
difference in the efficiency of the light as shown by studies in the spectral
houses. It seems certain that the poor growth of plants under forest
canopies is not to be attributed to changes in light quality.
The increase in the percentage of the blue spectral region of forest light
compared to daylight will cause intensity determinations, made by the
use of light-sensitive paper, which is affected more by the blue region than
by the red region, to be too high. Only methods which are uniformly
sensitive to all wave lengths can be safely used in comparing forest light
with daylight.
This content downloaded on Wed, 2 Jan 2013 09:45:23 AM
All use subject to JSTOR Terms and Conditions
May, I929] SHIRLEY -LIGHT AND GROWTH 387
SUMMARY
I. Plants were grown under four sets of light conditions: (i) under cloth
shades inside a greenhouse; (2) under cloth shades out-of-doors; (3) in a con-
stant-condition room supplied with artificial illumination; (4) in a series of
houses covered with glasses transmitting definite spectral regions. Curves
are presented showing the influence of light intensity upon the total pro-
duction of dry matter, percentage of dry Inatter, height growth, and ratio of
roots to shoots. Studies of chlorophyll concentration, leaf area, and time
of flowering and fruiting were also made. The effects of different qualities
of light on growth are shown. A discussion of the silvical and ecological
significance of the studies is given.
2. The light needed for the survival of the plants grown is very low,
being less than 40 foot-candles for all except sunflower, which requires a
much higher intensity.
3. Redwood and loblolly pine are able to survive for a period of 6
months under a light intensity at which they are barely able to increase in
dry weight. Sunflowers, on the other hand, died within two or three
weeks.
4. At low light intensities the dry weight produced by the plants studied
is almost directly proportional to the intensity received up to about 20
percent of full summer sunlight. At higher intensities the slope of the
curve falls off, shade plants showing a decrease at lower intensities than sun
plants.
5. The percentage of dry matter in tops, the ratio of dry weight of
roots to dry weight of shoots, the density of growth, the strength of stem,
and the leaf thickness all increased with increasing light intensity.
6. Leaf area and height attained maxima at light intensities of about
20 percent of full summer sunlight.
7. Chlorophyll concentration increased with decreasing light intensity
until the intensity was so low that it hazarded survival. Further decrease
in light intensity caused a decrease in chlorophyll concentration.
8. The time of maximum flowering and fruiting was considerably
delayed by low light intensities. Fruiting did not occur at all in the plants
studied in intensities below 8 percent of full summer sunlight.
9. The entire visible and ultra-violet solar spectrum is more efficient
for the growth of the plants studied than any portion of it used; the blue
region of the spectrum is more efficient than the red region.
io. Light intensity is usually a limiting factor in the growth of the
vegetation under a forest canopy.
ii. Light quality is not a seriously limiting factor in the growth of
plants under forest canopies.
I2. Moderate variations in soil moisture are not likely to cause significant
changes in the dry weight produced by plants provided the moisture content
is not so low that it approaches the wilting coefficient, or so high that it
approaches saturation.
This content downloaded on Wed, 2 Jan 2013 09:45:23 AM
All use subject to JSTOR Terms and Conditions
388 AMERICAN JOURNAL OF BOTANY [Vol. i6,
The writer wishes to acknowledge his indebtedness to the members of
the Botanical Department of Yale University for helpful criticisms of the
work. He is also indebted to Dr. F. M. Schertz, associate biochemist,
Bureau of Chemistry and Soils, U. S. D. A., for his kindness in furnishing
a sample of crystalline chlorophyll, and for allowing the use of his method
prior to its publication.
BOYCE THOMPSON INSTITUTE FOR PLANT RESEARCH, INC.,
YONKERS, NEW YORK
LITERATURE CITED
i. Bates, C. G., and J. Roeser, Jr. Light intensities required for growth of coniferous
seedlings. Amer. Jour. Bot. I5: I85-194. I928.
2. Blackman, F. F., and G. L. C. Matthaei. On vegetative assimilation and respiration.
Proc. Roy. Soc. London B 76: 402-460. i9o5.
3. Boyce Thompson Institute for Plant Research, Inc., Yonkers, N. Y. Contributions I:
i6. I925.
4. Boysen-Jensen, P. Studies on the production of matter in light and shade plants.
Bot. Tidskr. 36: 2I9. I9I8.
5. Burns, G. P. Minimum light requirements referred to a definite standard. Vermont
Agr. Exp. Sta. Bull. 235. I923.
6. Combes, R. D'etermination des intensites lumineuses optima. Ann. Sci. Nat. Bot.
IX, II: 75. I9I0.
7. Davis, A. R., and D. R. Hoagland. An apparatus for the growth of plants in a con-
trolled environment. Plant Physiol. 3: 277-292. I928.
8. . Further experiments on the growth of plants in a controlled environment.
Abst. in Amer. Jour. Bot. I5: 624. I928.
9. Fricke, K. Licht- und Schattenholzen. Centralbl. Ges. Forstwesen 30: 3I5-325.
I904. (Rev. in U. S. Dept. Agr. F. S. Bull. 92. I91I.)
I0. Garner, W. W., and H. A. Allard. Sunlight and plant -growth. Jour. Agr. Res. I8:
580. I920.
II. Grasovsky, A. Some aspects of light in the forest. Yale Univ. School Forestry Bull.
23. I929.
I2. Guthrie, J. D. A stable colorimetric standard for chlorophyll determinations. Amer.
Jour. Bot. I5: 86. I928.
I3. Harder, R. Kritische Versuche zu Blackmans Theorie der " begrenzenden Faktoren"
bei der Kohlensaureassimilation. Jahrb. Wiss. Bot. 6o: 531-57I. I921.
I4. Kimball, H. H. Records of total solar radiation intensity and their relation to day-
light intensity. Monthly Weather Rev. 52: 473-479. I924.
I5. Klugh, A. B. Ecological photometry and a new instrument for measuring light.
Ecology 6: 203. I925.
I6. - . A comparison of certain methods of measuring light for ecological purposes.
Ecology 8: 4I5-427. I927.
I7. Knuchel, H. Spectrophotometrische Untersuchungen im Walde. Mitteil. Schweiz.
Centralanst. Forst. Versuch. II. I924.
I8. Kvapil, K., and A. Nemec. Uber den Einfluss des Lichtes auf einige physikalische
und chemische Bodeneigenschaften in reinen Nadel- und Laubholzbestanden sowie
in gemischten Bestanden. (Abst. in Bot. Centralbl. I53: 473. I928).
I9. Lubimenko, W. Production de la substance seche et de la chlorophylle chez les
vegetaux superieurs aux differentes intensites lumineuses. Ann. Sci. Nat. Bot. IX,
7: 32I-4I5. I908.
20. Pfeiffer, Norma E. Anatomical study of plants grown under glasses transmitting
light of various ranges of wave length. Bot. Gaz. 85: 427-436. I928.
This content downloaded on Wed, 2 Jan 2013 09:45:23 AM
All use subject to JSTOR Terms and Conditions
AMERICAN JOURNAL OF BOTANY. VOLUME XVI, PLATE XXVIII.
i ~~~~~~SHRE LIGH AN ROT
This content downloaded on Wed, 2 Jan 2013 09:45:23 AM
All use subject to JSTOR Terms and Conditions
AMERICAN
JOURNALOF BOTANY. VOLUMEXVI, PLATE XXIX.
..
....
~~~S
HILY:LGTN GOT
This content downloaded on Wed, 2 Jan 2013 09:45:23 AM
All use subject to JSTOR Terms and Conditions
AMERICAN JOURNAL OF BOTANY. VOLUME XVI, PLATE XXX.
SHIRLEY: LIGHT AND GROWTH
This content downloaded on Wed, 2 Jan 2013 09:45:23 AM
All use subject to JSTOR Terms and Conditions
AMERICANJOURNALOF BOTANY. VOLUMEXVI, PLATE XXXI.
IImu~EY: LI
GR
SHIRLEY: LIGHT AND GROWTH
This content downloaded on Wed, 2 Jan 2013 09:45:23 AM
All use subject to JSTOR Terms and Conditions
AMERICANJOURNALOF BOTANY. VOLUMEXVI, PLATE XXXII.
q .
_
_ ~~S~
I_
SHREY IGTAN ROT
This content downloaded on Wed, 2 Jan 2013 09:45:23 AM
All use subject to JSTOR Terms and Conditions
May, I929] SHIRLEY -LIGHT AND GROWTH 389
21. Popp, H. W. Effect of light intensity on growth of soy beans and its relation to the
autocatalyst theory of growth. Bot. Gaze 82: 306-3I9. I926.
22. - . A physiological study of the effect of light of various ranges of wave length on
the growth of plants. Amer. Jour. Bot. I3: 706-736. i926.
23. Rose, E. Energie assimilatrice chez les plantes cultivees sans differents eclairement.
Ann. Sci. Nat. Bot. IX, I7: I-II0. I9I3.
24. Salisbury, E. J. The oak-hornbeam woods of Hertfordshire. Jour. EcOl, 4: 83-117.
I9I6; and 6: 14-52. I9I8.
25. Sayre, J. D. The developmentof chlorophyll in seedlings in different ranges of wave
lengths of light. Plant Physiol. 3: 7I-77. I928.
26. Schertz, F. M. The quantitative determination of chlorophyll. Plant Physiol. 3:
323-334. 1928.
27. Shantz, H. L. Effects of artificial shading on plant growth in Louisiana. U. S.
Dept. Agr. Bur. P1. Ind. Bull. 279. I9I3.
28. Toumey, J. W. Foundations of silviculture upon an ecological basis. New York,
1928.
29. Zillich, R. Uber den Lichtgenuss einiger Unkrauter und Kulturpflanzen. Fortsch.
Landwirtschaft I: 46I-470. I926.
EXPLANATION OF PLATES
PLATEXXVI II
FIG. I. The constant-condition room-showing method of illumination.
FIG. 2. A greenhouse shade showing air inlet, spreader, atmometer, and thermometer.
FIG. 3. An outside shade showing tile air inlet, atmometer, and thermopile. The
front has been removed.
PLATEXXIX
FIG. 4. Redwood plants grown for 55 days on 12-hour days in constant-condition
room. The figures above the plants show the light intensity in foot candles.
FIG. 5. Redwood plant from the greenhouse shades, grown from March 27 to October
22, 1928. The figures on the pots show the light intensity in percentage of full sunlight.
FIG. 6. Redwood plants grown in outside shades June I to Sept. 26, 1928. Figures
on the pots show the light intensities in percentages of full summer sunlight.
PLATEXXX
FIG. 7. Sunflowers from constant-condition room grown for 48 days with I2 hours
daily illumination. The figures on the pots are light intensities in foot-candles.
FIG. 8. Sunflowers from greenhouse shades June 5 to August I3, I928. Figures on
the pots represent light intensities in percentages of full summer sunlight.
FIG. 9. Sunflowers from outside shades June 5 to August 20, I928. Figures on the
pots represent light intensities in percentage of full summer sunlight.
PLATEXXXI
FIG. IO. Galinsoga plants grown in the constant-condition room for 35 days with
I2 hours daily illumination. Figures on the pots show the light intensities in foot-candles.
FIG, I I. Galinsogcaplants grown in greenhouse shades from June 5 to August 8, I928.
Figures on the pots show the light intensities in percentages of full summer sunlight.
FIG. 12. Galinsogaplants grown in outside shades from June I to July 6, I928.
Figures on the pots show the light intensities in percentages of full summer sunlight.
27
This content downloaded on Wed, 2 Jan 2013 09:45:23 AM
All use subject to JSTOR Terms and Conditions
390 AMERICAN JOURNAL OF BOTANY [Vol. i6,
PLATEXXXI I
FIG. I3. Geum plants grown in constant-condition room, for 54 days with I2 hours
daily illumination. Figures on the picture show the light intensities in foot-candles.
FIG. 14. Sunflower plants grown in the spectral-house shades from June 5 to August
15, 1928. The Arabic figures on the pots show light intensities in percentages of outside
sunlight. Roman numerals show the house number.
FIG. IS. Geum plants grown in the spectral-house shades from July Io to October 24,
1928. Arabic figures show light intensities. Roman numerals show the house numbers.
FIG. i6. Galinsoga plants grown in spectral-house shades from May 30 to July 5,
I928. Arabic figures show light intensities. Roman nunmeralsshow house numbers.
FIFTH INTERNATIONAL BOTANICAL CONGRESS: MOTIONS
ON NOMENCLATURE
Motions on the subject of nomenclature for consideration by the Congress
should be in the hand of the Rapporteur general, Dr. John Briquet, before
September30, I929.
Motions must be presented in the form of additional articles (or amend-
ments) to the Rules of 1905-I9io, drawn up in the form adopted in the
International Code, and must be drafted as briefly as possible in Latin,
English, French, German, or Italian. At least 0ooprinted copies must be
presented.
According to the decisions of the Brussels Congress, I910, only motions
relating to new points which were not settled in 1905 and I910 can be
presented. Motions which do not answer to these conditions shall only be
discussed if the Cambridge Congress 1930 decides to take them into con-
sideration.
For further information about the programme of work for nomenclature,
apply to the Rapporteur general, Dr. John Briquet, Conservatoire botani-
que, Geneva (Switzerland).-F. T. BROOKS, Secretary, Cambridge, England.
This content downloaded on Wed, 2 Jan 2013 09:45:23 AM
All use subject to JSTOR Terms and Conditions

More Related Content

Similar to 2435785.pdf

ebooksclub.org_Plant_Ecology_the_Green_World.pdf
ebooksclub.org_Plant_Ecology_the_Green_World.pdfebooksclub.org_Plant_Ecology_the_Green_World.pdf
ebooksclub.org_Plant_Ecology_the_Green_World.pdfAgathaHaselvin
 
crop growth theory
crop growth theorycrop growth theory
crop growth theoryBarkha Singh
 
Silviculture and Agroforestry Presentation.pptx
Silviculture and Agroforestry Presentation.pptxSilviculture and Agroforestry Presentation.pptx
Silviculture and Agroforestry Presentation.pptxpatelks511
 
2015_LRP_FireEcology_PosterFinal
2015_LRP_FireEcology_PosterFinal2015_LRP_FireEcology_PosterFinal
2015_LRP_FireEcology_PosterFinalRyan Suttle
 
FinalChironomidpaper copy
FinalChironomidpaper copyFinalChironomidpaper copy
FinalChironomidpaper copyDevan Rouse
 
Dry shade in the temperate garden. problem and potential
Dry shade in the temperate garden. problem and potentialDry shade in the temperate garden. problem and potential
Dry shade in the temperate garden. problem and potentialGiulio Veronese
 
Impact of photosynthesis on crop yield
Impact of photosynthesis on crop yieldImpact of photosynthesis on crop yield
Impact of photosynthesis on crop yieldANWAR225MD
 
Light and temperature, light and temperature as ecological factors
Light and temperature, light and temperature as ecological factorsLight and temperature, light and temperature as ecological factors
Light and temperature, light and temperature as ecological factorssehriqayyum
 
Leaf litter decomposition and nutrient release from cordia africana lam. and ...
Leaf litter decomposition and nutrient release from cordia africana lam. and ...Leaf litter decomposition and nutrient release from cordia africana lam. and ...
Leaf litter decomposition and nutrient release from cordia africana lam. and ...Alexander Decker
 
RPauloo_edits_1_2_2015 (1)
RPauloo_edits_1_2_2015 (1)RPauloo_edits_1_2_2015 (1)
RPauloo_edits_1_2_2015 (1)Rich Pauloo
 
Mol. plant 2008-inoue-15-26
Mol. plant 2008-inoue-15-26Mol. plant 2008-inoue-15-26
Mol. plant 2008-inoue-15-26andreasniebuhr
 
Reforestation in the Cerro Candelaria Reserve
Reforestation in the Cerro Candelaria ReserveReforestation in the Cerro Candelaria Reserve
Reforestation in the Cerro Candelaria ReserveChristopher Chang
 
Environmental Science Table of Contents 37 L.docx
Environmental Science Table of Contents 37 L.docxEnvironmental Science Table of Contents 37 L.docx
Environmental Science Table of Contents 37 L.docxYASHU40
 
Plant responce to green house.pdf
Plant responce to green house.pdfPlant responce to green house.pdf
Plant responce to green house.pdfPoojaYaddanapudi3
 
Partial shading as significant factor in biodiversity of plants in Israel 2022
Partial shading as significant factor in biodiversity of plants in Israel 2022Partial shading as significant factor in biodiversity of plants in Israel 2022
Partial shading as significant factor in biodiversity of plants in Israel 2022Nir Herr
 

Similar to 2435785.pdf (20)

ebooksclub.org_Plant_Ecology_the_Green_World.pdf
ebooksclub.org_Plant_Ecology_the_Green_World.pdfebooksclub.org_Plant_Ecology_the_Green_World.pdf
ebooksclub.org_Plant_Ecology_the_Green_World.pdf
 
crop growth theory
crop growth theorycrop growth theory
crop growth theory
 
Silviculture and Agroforestry Presentation.pptx
Silviculture and Agroforestry Presentation.pptxSilviculture and Agroforestry Presentation.pptx
Silviculture and Agroforestry Presentation.pptx
 
Essay On Endangered Plants
Essay On Endangered PlantsEssay On Endangered Plants
Essay On Endangered Plants
 
Light
Light Light
Light
 
2015_LRP_FireEcology_PosterFinal
2015_LRP_FireEcology_PosterFinal2015_LRP_FireEcology_PosterFinal
2015_LRP_FireEcology_PosterFinal
 
Ecology Lab 1 Essay
Ecology Lab 1 EssayEcology Lab 1 Essay
Ecology Lab 1 Essay
 
FinalChironomidpaper copy
FinalChironomidpaper copyFinalChironomidpaper copy
FinalChironomidpaper copy
 
Dry shade in the temperate garden. problem and potential
Dry shade in the temperate garden. problem and potentialDry shade in the temperate garden. problem and potential
Dry shade in the temperate garden. problem and potential
 
Impact of photosynthesis on crop yield
Impact of photosynthesis on crop yieldImpact of photosynthesis on crop yield
Impact of photosynthesis on crop yield
 
Light and temperature, light and temperature as ecological factors
Light and temperature, light and temperature as ecological factorsLight and temperature, light and temperature as ecological factors
Light and temperature, light and temperature as ecological factors
 
Chapter 6 7 ecology
Chapter 6 7 ecologyChapter 6 7 ecology
Chapter 6 7 ecology
 
ECOL313_MANUSCRIPT
ECOL313_MANUSCRIPTECOL313_MANUSCRIPT
ECOL313_MANUSCRIPT
 
Leaf litter decomposition and nutrient release from cordia africana lam. and ...
Leaf litter decomposition and nutrient release from cordia africana lam. and ...Leaf litter decomposition and nutrient release from cordia africana lam. and ...
Leaf litter decomposition and nutrient release from cordia africana lam. and ...
 
RPauloo_edits_1_2_2015 (1)
RPauloo_edits_1_2_2015 (1)RPauloo_edits_1_2_2015 (1)
RPauloo_edits_1_2_2015 (1)
 
Mol. plant 2008-inoue-15-26
Mol. plant 2008-inoue-15-26Mol. plant 2008-inoue-15-26
Mol. plant 2008-inoue-15-26
 
Reforestation in the Cerro Candelaria Reserve
Reforestation in the Cerro Candelaria ReserveReforestation in the Cerro Candelaria Reserve
Reforestation in the Cerro Candelaria Reserve
 
Environmental Science Table of Contents 37 L.docx
Environmental Science Table of Contents 37 L.docxEnvironmental Science Table of Contents 37 L.docx
Environmental Science Table of Contents 37 L.docx
 
Plant responce to green house.pdf
Plant responce to green house.pdfPlant responce to green house.pdf
Plant responce to green house.pdf
 
Partial shading as significant factor in biodiversity of plants in Israel 2022
Partial shading as significant factor in biodiversity of plants in Israel 2022Partial shading as significant factor in biodiversity of plants in Israel 2022
Partial shading as significant factor in biodiversity of plants in Israel 2022
 

Recently uploaded

(AISHA) Wagholi Call Girls Just Call 7001035870 [ Cash on Delivery ] Pune Esc...
(AISHA) Wagholi Call Girls Just Call 7001035870 [ Cash on Delivery ] Pune Esc...(AISHA) Wagholi Call Girls Just Call 7001035870 [ Cash on Delivery ] Pune Esc...
(AISHA) Wagholi Call Girls Just Call 7001035870 [ Cash on Delivery ] Pune Esc...ranjana rawat
 
webinaire-green-mirror-episode-2-Smart contracts and virtual purchase agreeme...
webinaire-green-mirror-episode-2-Smart contracts and virtual purchase agreeme...webinaire-green-mirror-episode-2-Smart contracts and virtual purchase agreeme...
webinaire-green-mirror-episode-2-Smart contracts and virtual purchase agreeme...Cluster TWEED
 
VIP Call Girls Saharanpur Aaradhya 8250192130 Independent Escort Service Saha...
VIP Call Girls Saharanpur Aaradhya 8250192130 Independent Escort Service Saha...VIP Call Girls Saharanpur Aaradhya 8250192130 Independent Escort Service Saha...
VIP Call Girls Saharanpur Aaradhya 8250192130 Independent Escort Service Saha...Suhani Kapoor
 
Call Girls South Delhi Delhi reach out to us at ☎ 9711199012
Call Girls South Delhi Delhi reach out to us at ☎ 9711199012Call Girls South Delhi Delhi reach out to us at ☎ 9711199012
Call Girls South Delhi Delhi reach out to us at ☎ 9711199012sapnasaifi408
 
VIP Call Girls Service Chaitanyapuri Hyderabad Call +91-8250192130
VIP Call Girls Service Chaitanyapuri Hyderabad Call +91-8250192130VIP Call Girls Service Chaitanyapuri Hyderabad Call +91-8250192130
VIP Call Girls Service Chaitanyapuri Hyderabad Call +91-8250192130Suhani Kapoor
 
办理学位证(KU证书)堪萨斯大学毕业证成绩单原版一比一
办理学位证(KU证书)堪萨斯大学毕业证成绩单原版一比一办理学位证(KU证书)堪萨斯大学毕业证成绩单原版一比一
办理学位证(KU证书)堪萨斯大学毕业证成绩单原版一比一F dds
 
VIP Call Girls Service Bandlaguda Hyderabad Call +91-8250192130
VIP Call Girls Service Bandlaguda Hyderabad Call +91-8250192130VIP Call Girls Service Bandlaguda Hyderabad Call +91-8250192130
VIP Call Girls Service Bandlaguda Hyderabad Call +91-8250192130Suhani Kapoor
 
(PARI) Viman Nagar Call Girls Just Call 7001035870 [ Cash on Delivery ] Pune ...
(PARI) Viman Nagar Call Girls Just Call 7001035870 [ Cash on Delivery ] Pune ...(PARI) Viman Nagar Call Girls Just Call 7001035870 [ Cash on Delivery ] Pune ...
(PARI) Viman Nagar Call Girls Just Call 7001035870 [ Cash on Delivery ] Pune ...ranjana rawat
 
VIP Call Girl Gorakhpur Aashi 8250192130 Independent Escort Service Gorakhpur
VIP Call Girl Gorakhpur Aashi 8250192130 Independent Escort Service GorakhpurVIP Call Girl Gorakhpur Aashi 8250192130 Independent Escort Service Gorakhpur
VIP Call Girl Gorakhpur Aashi 8250192130 Independent Escort Service GorakhpurSuhani Kapoor
 
ENVIRONMENTAL LAW ppt on laws of environmental law
ENVIRONMENTAL LAW ppt on laws of environmental lawENVIRONMENTAL LAW ppt on laws of environmental law
ENVIRONMENTAL LAW ppt on laws of environmental lawnitinraj1000000
 
Species composition, diversity and community structure of mangroves in Barang...
Species composition, diversity and community structure of mangroves in Barang...Species composition, diversity and community structure of mangroves in Barang...
Species composition, diversity and community structure of mangroves in Barang...Open Access Research Paper
 
Along the Lakefront, "Menacing Unknown"s
Along the Lakefront, "Menacing Unknown"sAlong the Lakefront, "Menacing Unknown"s
Along the Lakefront, "Menacing Unknown"syalehistoricalreview
 
Call Girls Ahmedabad 7397865700 Ridhima Hire Me Full Night
Call Girls Ahmedabad 7397865700 Ridhima Hire Me Full NightCall Girls Ahmedabad 7397865700 Ridhima Hire Me Full Night
Call Girls Ahmedabad 7397865700 Ridhima Hire Me Full Nightssuser7cb4ff
 
(RIYA) Kalyani Nagar Call Girls Just Call 7001035870 [ Cash on Delivery ] Pun...
(RIYA) Kalyani Nagar Call Girls Just Call 7001035870 [ Cash on Delivery ] Pun...(RIYA) Kalyani Nagar Call Girls Just Call 7001035870 [ Cash on Delivery ] Pun...
(RIYA) Kalyani Nagar Call Girls Just Call 7001035870 [ Cash on Delivery ] Pun...ranjana rawat
 
Air pollution soli pollution water pollution noise pollution land pollution
Air pollution soli pollution water pollution noise pollution land pollutionAir pollution soli pollution water pollution noise pollution land pollution
Air pollution soli pollution water pollution noise pollution land pollutionrgxv72jrgc
 
(ZARA) Call Girls Talegaon Dabhade ( 7001035870 ) HI-Fi Pune Escorts Service
(ZARA) Call Girls Talegaon Dabhade ( 7001035870 ) HI-Fi Pune Escorts Service(ZARA) Call Girls Talegaon Dabhade ( 7001035870 ) HI-Fi Pune Escorts Service
(ZARA) Call Girls Talegaon Dabhade ( 7001035870 ) HI-Fi Pune Escorts Serviceranjana rawat
 

Recently uploaded (20)

Hot Sexy call girls in Nehru Place, 🔝 9953056974 🔝 escort Service
Hot Sexy call girls in Nehru Place, 🔝 9953056974 🔝 escort ServiceHot Sexy call girls in Nehru Place, 🔝 9953056974 🔝 escort Service
Hot Sexy call girls in Nehru Place, 🔝 9953056974 🔝 escort Service
 
(AISHA) Wagholi Call Girls Just Call 7001035870 [ Cash on Delivery ] Pune Esc...
(AISHA) Wagholi Call Girls Just Call 7001035870 [ Cash on Delivery ] Pune Esc...(AISHA) Wagholi Call Girls Just Call 7001035870 [ Cash on Delivery ] Pune Esc...
(AISHA) Wagholi Call Girls Just Call 7001035870 [ Cash on Delivery ] Pune Esc...
 
webinaire-green-mirror-episode-2-Smart contracts and virtual purchase agreeme...
webinaire-green-mirror-episode-2-Smart contracts and virtual purchase agreeme...webinaire-green-mirror-episode-2-Smart contracts and virtual purchase agreeme...
webinaire-green-mirror-episode-2-Smart contracts and virtual purchase agreeme...
 
VIP Call Girls Saharanpur Aaradhya 8250192130 Independent Escort Service Saha...
VIP Call Girls Saharanpur Aaradhya 8250192130 Independent Escort Service Saha...VIP Call Girls Saharanpur Aaradhya 8250192130 Independent Escort Service Saha...
VIP Call Girls Saharanpur Aaradhya 8250192130 Independent Escort Service Saha...
 
Call Girls South Delhi Delhi reach out to us at ☎ 9711199012
Call Girls South Delhi Delhi reach out to us at ☎ 9711199012Call Girls South Delhi Delhi reach out to us at ☎ 9711199012
Call Girls South Delhi Delhi reach out to us at ☎ 9711199012
 
E Waste Management
E Waste ManagementE Waste Management
E Waste Management
 
VIP Call Girls Service Chaitanyapuri Hyderabad Call +91-8250192130
VIP Call Girls Service Chaitanyapuri Hyderabad Call +91-8250192130VIP Call Girls Service Chaitanyapuri Hyderabad Call +91-8250192130
VIP Call Girls Service Chaitanyapuri Hyderabad Call +91-8250192130
 
办理学位证(KU证书)堪萨斯大学毕业证成绩单原版一比一
办理学位证(KU证书)堪萨斯大学毕业证成绩单原版一比一办理学位证(KU证书)堪萨斯大学毕业证成绩单原版一比一
办理学位证(KU证书)堪萨斯大学毕业证成绩单原版一比一
 
Sexy Call Girls Patel Nagar New Delhi +918448380779 Call Girls Service in Del...
Sexy Call Girls Patel Nagar New Delhi +918448380779 Call Girls Service in Del...Sexy Call Girls Patel Nagar New Delhi +918448380779 Call Girls Service in Del...
Sexy Call Girls Patel Nagar New Delhi +918448380779 Call Girls Service in Del...
 
VIP Call Girls Service Bandlaguda Hyderabad Call +91-8250192130
VIP Call Girls Service Bandlaguda Hyderabad Call +91-8250192130VIP Call Girls Service Bandlaguda Hyderabad Call +91-8250192130
VIP Call Girls Service Bandlaguda Hyderabad Call +91-8250192130
 
(PARI) Viman Nagar Call Girls Just Call 7001035870 [ Cash on Delivery ] Pune ...
(PARI) Viman Nagar Call Girls Just Call 7001035870 [ Cash on Delivery ] Pune ...(PARI) Viman Nagar Call Girls Just Call 7001035870 [ Cash on Delivery ] Pune ...
(PARI) Viman Nagar Call Girls Just Call 7001035870 [ Cash on Delivery ] Pune ...
 
VIP Call Girl Gorakhpur Aashi 8250192130 Independent Escort Service Gorakhpur
VIP Call Girl Gorakhpur Aashi 8250192130 Independent Escort Service GorakhpurVIP Call Girl Gorakhpur Aashi 8250192130 Independent Escort Service Gorakhpur
VIP Call Girl Gorakhpur Aashi 8250192130 Independent Escort Service Gorakhpur
 
ENVIRONMENTAL LAW ppt on laws of environmental law
ENVIRONMENTAL LAW ppt on laws of environmental lawENVIRONMENTAL LAW ppt on laws of environmental law
ENVIRONMENTAL LAW ppt on laws of environmental law
 
Gandhi Nagar (Delhi) 9953330565 Escorts, Call Girls Services
Gandhi Nagar (Delhi) 9953330565 Escorts, Call Girls ServicesGandhi Nagar (Delhi) 9953330565 Escorts, Call Girls Services
Gandhi Nagar (Delhi) 9953330565 Escorts, Call Girls Services
 
Species composition, diversity and community structure of mangroves in Barang...
Species composition, diversity and community structure of mangroves in Barang...Species composition, diversity and community structure of mangroves in Barang...
Species composition, diversity and community structure of mangroves in Barang...
 
Along the Lakefront, "Menacing Unknown"s
Along the Lakefront, "Menacing Unknown"sAlong the Lakefront, "Menacing Unknown"s
Along the Lakefront, "Menacing Unknown"s
 
Call Girls Ahmedabad 7397865700 Ridhima Hire Me Full Night
Call Girls Ahmedabad 7397865700 Ridhima Hire Me Full NightCall Girls Ahmedabad 7397865700 Ridhima Hire Me Full Night
Call Girls Ahmedabad 7397865700 Ridhima Hire Me Full Night
 
(RIYA) Kalyani Nagar Call Girls Just Call 7001035870 [ Cash on Delivery ] Pun...
(RIYA) Kalyani Nagar Call Girls Just Call 7001035870 [ Cash on Delivery ] Pun...(RIYA) Kalyani Nagar Call Girls Just Call 7001035870 [ Cash on Delivery ] Pun...
(RIYA) Kalyani Nagar Call Girls Just Call 7001035870 [ Cash on Delivery ] Pun...
 
Air pollution soli pollution water pollution noise pollution land pollution
Air pollution soli pollution water pollution noise pollution land pollutionAir pollution soli pollution water pollution noise pollution land pollution
Air pollution soli pollution water pollution noise pollution land pollution
 
(ZARA) Call Girls Talegaon Dabhade ( 7001035870 ) HI-Fi Pune Escorts Service
(ZARA) Call Girls Talegaon Dabhade ( 7001035870 ) HI-Fi Pune Escorts Service(ZARA) Call Girls Talegaon Dabhade ( 7001035870 ) HI-Fi Pune Escorts Service
(ZARA) Call Girls Talegaon Dabhade ( 7001035870 ) HI-Fi Pune Escorts Service
 

2435785.pdf

  • 1. The Influence of Light Intensity and Light Quality Upon the Growth of Plants Author(s): Hardy L. Shirley Reviewed work(s): Source: American Journal of Botany, Vol. 16, No. 5 (May, 1929), pp. 354-390 Published by: Botanical Society of America Stable URL: http://www.jstor.org/stable/2435785 . Accessed: 02/01/2013 09:45 Your use of the JSTOR archive indicates your acceptance of the Terms & Conditions of Use, available at . http://www.jstor.org/page/info/about/policies/terms.jsp . JSTOR is a not-for-profit service that helps scholars, researchers, and students discover, use, and build upon a wide range of content in a trusted digital archive. We use information technology and tools to increase productivity and facilitate new forms of scholarship. For more information about JSTOR, please contact support@jstor.org. . Botanical Society of America is collaborating with JSTOR to digitize, preserve and extend access to American Journal of Botany. http://www.jstor.org This content downloaded on Wed, 2 Jan 2013 09:45:23 AM All use subject to JSTOR Terms and Conditions
  • 2. THE INFLUENCE OF LIGHT INTENSITY AND LIGHT QUALITY UPON THE GROWTH OF PLANTS HARDY L. SHIRLEY (Received for publication March 30, 1929) 1 INTRODUCTION Since the discovery that green plants can assimilate carbon in the presence of light, light has been recognized as being one of the major factors influencing the growth and other characteristics of vegetation. Plant ecologists have considered light conditions to be one of the important factors in instituting succession. Foresters have based their theories and practices of silviculture upon the light requirements of the forest trees. When it became possible to measure light conditions under the forest, the decrease in intensity was found to be exceedingly great. Salisbury (24) gave values as low as o.I6 to 1.3 percent of full sunlight in an oak- hornbeam forest. His upper values were about IO percent. Kvapil and Nemec (i8) gave the average intensities under Austrian forests as 2 to 15 percent of outside light. Measurements of the total radiant energy under a 70-year-old mixed hardwood stand near the Boyce Thompson Institute gave values ranging from o.5 percent in dense shade to i6 percent in sun "flecks." A dense stand of sumach allowed only 2 percent of the energy to pass through. Measurements by other workers indicate that under a well stocked stand the light intensity is usually below IOpercent of outside intensity and often as low as I percent. The intensity at any one spot varies greatly from time to time depending upon whether or not a "fleck" of direct sunlight strikes it. Light under a forest canopy suffers not only a great depletion in intensity but also a change in quality or spectral energy distribution. Knuchel (I7) found the light under a beech forest to contain about I2 percent green and yellow, 7 percent red, and less than 5 percent of blue and violet, as compared with zenith skylight in the open. Similar results were obtained for other broad-leaved trees. The change in quality was more pronounced when the sun was shining than when the sun was hidden by clouds. Knuchel found no significant change in the light quality under spruce and fir canopies or other needle-leaved species. The measurement of the light quality under a forest canopy is a difficult problem. Knuchel's measurements seem to be the most reliable ones made to date. 1 Contributions from the Boyce Thompson Institute for Plant Research, Inc., Yonkers, New York, published at the expense of the Institute out of the order determined by the date of receipt of the manuscript. 354 This content downloaded on Wed, 2 Jan 2013 09:45:23 AM All use subject to JSTOR Terms and Conditions
  • 3. May, I929] SHIRLEY -LIGHT AND GROWTH 355 Klugh (I5, I6) measured the spectral quality of forest light. He found a spruce-cedar swamp forest to transmit 0.036 percent in the orange region, 0.33 percent in the green, and 3.05 percent in the blue-violet region. The reason for the discrepancy between these two sets of measurements is largely due to the fact that Knuchel compared forest light with skylight, while Klugh compared it with sunlight. Skylight has its maximum in- tensity in the blue-violet region of the spectrum, while the maximum energy of sunlight is in the yellow-green region (Kimball, I4). In the forest, skylight forms a much higher percentage of the total light than it does outside. The quality of daylight is thus changed in two ways in passing through a leafy canopy. Through partial absorption by leaves the light loses more red and blue than green and yellow. By decreasing the pro- portion of sunlight to skylight the red region is diminished more than the blue. The latter change seems to be of much greater importance than the former. In the past there has been a tendency among plant ecologists and foresters to over-emphasize the importance of light at the expense of other factors. Experiments on trenched areas by Fricke (9) and Toumey (28) have clearly demonstrated that survival and growth are often determined by the extent of root competition for moisture and nutrients rather than by light. However, moisture conditions alone are not sufficient to explain why bunch grass and red cedar will grow in dry exposed rock crevices and not in shaded ravines. Root competition does not account for the large numbers of epiphytes and lianas which give the characteristic appearance to the tropical rain forest. The problem of the light requirements of plants is of importance to the greenhouse man as well as the forester and the plant ecologist. Even the fancier, who tries to grow plants in living rooms or sun porches, is concerned with the light required to get healthy, vigorous growth of his plants. In the study which follows an attempt has been made to discover what the light requirements for the survival of a few plants are, and how the rate of growth changes with increasing light intensities. A study of the effects of light quality upon growth has also been made, with particular emphasis upon the blue region of the spectrum, as compared with the red. DISCUSSION OF LITERATURE Effect of Light Intensity Upon Photosynthesis Blackman and Matthaei (2) and others have shown that with low light intensities the rate of photosynthesis is almost directly proportional to the light intensity if other factors are not limiting. At higher intensities the slope of the curve falls off and approaches a line parallel to the axis, as shown by Boysen-Jensen (4) and Harder (I3). 25 This content downloaded on Wed, 2 Jan 2013 09:45:23 AM All use subject to JSTOR Terms and Conditions
  • 4. 356 AMERICAN JOURNAL OF BOTANY [Vol. I6, Effect of Shading on Plant Growth The effects of shading on plant growth were studied by Combes (6), Garner and Allard (io), Lubimenko (I9), Popp (2I), Rose (23), Shantz (27), and Zillich (29). Lubimenko found that the almount of dry matter produced increased with increasing light intensity up to a certain maximum and then decreased. He states that the optimum intensity for growth increases as the chlorophyll concentration decreases. His light intensities are all expressed in terms of the transmission of a certain piece of glass. Robinia Pseudo-Acacia, Pinus silvestris, Fraxinus excelsior, and Tilia parvifolia attained maximum dry weight at intensities corresponding to that which would pass through 7, 9, 9, and 27 layers of the glass respectively. Helianthus annuus attained maximum dry weight under full sunlight. Lubimenko states that chloro- phyll concentration increases with decreasing light intensity until a certain maximum is attained and then diminishes. Plants having a high chloro- phyll concentration have greater power to vary it, and can thus adapt themselves to a wider range of intensities than those which have a low chlorophyll concentration. They also attain maximum dry weight at lower light intensities than plants having low chlorophyll concentration. He found that height and leaf area behaved as dry weight but attained maximum development at lower intensities. The percentage of dry matter usually decreased with decreasing light intensity. He noticed that in general root growth increases and stem growth decreases with increasing light intensity within certain limits. Since no measurements of light intensities were made it is difficult to compare his results with those obtained by other investigators. Combes (6) found the optimum light intensity for the production of dry matter in plants to increase with increasing age of the plant. Maximum dry weight of fruit always occurred in full light intensity. His optimum intensities are somewhat higher than those given by Lubimenko, but otherwise his conclusions are in general accord. Rose (23) obtained maximum growth with full sunlight intensity. The shades used by Combes and Rose were much larger and more satisfactory than those of Lubimenko. Shantz (27) found the fresh weight of potato, cotton, lettuce, and radish to increase with decreasing light intensity from 50 to I5 percent of full sunlight in Louisiana. None of the plants he tested were able to grow past the seedling stage when the light was reduced to 6 percent of full sunlight. Dry weight determinations were not made. Garner and Allard (io) found decrease in seed production and in dry weight of tops of soy-beans when grown under shades. Zillich (29) noticed a delay in the time of flowering and fruiting of plants grown under lattice shades. The optimum intensity for green weight was 50 to 75 percent intensity for most of the plants he used. He found that weeds attained greater dry weight under reduced light intensities while cultivated plants This content downloaded on Wed, 2 Jan 2013 09:45:23 AM All use subject to JSTOR Terms and Conditions
  • 5. May, I929] SHIRLEY -LIGHT AND GROWTH 357 always had maximum dry weight when grown in the open. He also con- firmed many of the conclusions of Lubimenko. Popp (2I) obtained the greatest vigor of growth of soy-beans in his un- shaded plot, although the shaded plants had longer stems. Dry weight measurements were not given. In general, shading experiments show that the light intensity cannot be reduced much below 50 percent of full sunlight in temperate regions without causing a decrease in the growth of many plants. In the majority of cases maximum dry weight was produced by plants receiving the full normal sunlight of the region in which they were grown. Experiments with Artificial Light Burns (5) determined the amount of radiation from a Mazda lamp required to maintain a carbon dioxid balance between the plant and the surrounding air. At this intensity the carbon dioxid utilized in photo- synthesis would just be equal to that given off in respiration. Comparing this radiation intensity to that from the sun at noon of December 22, at Burlington, Vermont, he found various tree species to have minimum light requirements of from 2 to 17 percent of total solar radiation. In this paper the radiation from neither the lamp nor the sun were given in absolute heat units. Thermopile measurements of total heat energies cannot be used directly to compare artificial light with sunlight in their effects on photosynthesis due to the differences in color temperature or spectral energy distribution of the sources. The carbon dioxid concentrations maintained by Burns in the assimilation chamber were considerably above that of normal air, being on the average o.5 percent. Since the rate of photosynthesis varies with the carbon dioxid concentration as well as the light intensity, a concentration of o.5 percent would cause a carbon dioxid balance at lower light intensities than at a concentration of 0.035 percent. It must also be borne in mind that the photosynthetic performance of any plant is influenced not only by the light conditions under which it has been kept during the twenty-four hours preceding the test period, but also upon the light conditions during a much longer preceding period. Rose (23) showed that plants grown under a low light intensity were able to assimilate carbon dioxid at a much faster rate in low intensities than similar plants which had previously been growing under high light intensities. Short- time experiments upon the rate of gas exchange of plants under artificial conditions are valuable in studying the physiology of the plant, but it seems highly improbable that the results of any such experiments can be applied directly to account for the growth of plants growing under natural conditions. Grasovsky (II), using the apparatus developed by Burns, found a zero carbon-dioxid exchange with white pine at 174 foot-candles. This is probably about the same intensity found by Burns but is expressed in relative light units. This content downloaded on Wed, 2 Jan 2013 09:45:23 AM All use subject to JSTOR Terms and Conditions
  • 6. 358 AMERICAN JOURNAL OF BOTANY IVol. i6, d 1- L O H LO O 0 = O - C | CT 02< 1o m sci x U) O rs | (1 U>) LOH O C C I D CfC'I m C C) 1 - ss0 C O C l0 C/). CICCI 'U) ' 0 CZ Z. C.0U)O . a E ~~~~O t- So S _ __ _B C ) C ) CZ) 4.1 . .111 LO . C: C) 00000 C) ~ ~ CCC .C 0C-Cf This content downloaded on Wed, 2 Jan 2013 09:45:23 AM All use subject to JSTOR Terms and Conditions
  • 7. May, I929] SHIRLEY -LIGHT AND GROWTH 359 Bates and Roeser (I) grew coniferous seedlings for a period of nine months under artificial illumination of IO hours daily duration. The experiment was arranged so that the plants grew at varying distances from the light source. By measuring the radiation intensities under which the plants survived, a minimum light requirement was obtained. This intensity was compared by the use of a thermopile with noon summer sunlight at Colorado Springs, Colorado, for the year of 1926. The method of comparison is open to the criticism made of Burns's work. Redwood survived with 0.62 percent and pifion pine with 6.3 percent of total solar radiation. Their curves showing the amount of dry weight produced at different light intensities show a straight line for redwood, which has the lowest light requirement, and curves convex downward for western yellow pine, Douglas fir, and pifion pine. The curve for Engelmann spruce is S-shaped. Davis and Hoagland (8) reported on the growth of wheat under artificial conditions. They found the dry weight produced to be directly pro- portional to the light intensity over the range of intensities they used. Dry weight seemed to bear an exponential relation to the length of day. Effects of Light Quality on Growth The effects of light quality upon the.growth and form of plants was studied by Popp (22). He found very little difference between plants grown under full sunlight conditions and those grown in the absence of ultra-violet radiation. When all wave lengths shorter than 529 m,uwere removed the growth was poor, the plants were weak, and lower in fresh and dry weight. When the dry weight per unit intensity is considered the plants grown under the complete solar spectrum appear to have the ad- vantage. This result is exaggerated by the fact that the intensity was lower in this light quality than in any other except that of house 5, which eliminates all the blue. Table I is taken from Popp's data. The effects of different ranges of wave lengths on the anatomical develop- ment of plants were studied by Miss Pfeiffer (20). The full solar spectrum gave better development as expressed by greater stem thickness, height, leaf thickness and differentiation, and extent of root system, than any of the other qualities used, with the visible spectrum next best. The red and blue were poorest, partially due to their lower intensities. Sayre (25) studied the chlorophyll development in different spectral regions. He found no chlorophyll development in wave lengths longer than 68o millimicrons. In the visible region chlorophyll formation occurred in all spectral regions if sufficient energy were present, the red being most effective, followed by the green and blue. The chlorophyll development was judged by noting the relative greenness of the plants. This content downloaded on Wed, 2 Jan 2013 09:45:23 AM All use subject to JSTOR Terms and Conditions
  • 8. 360 AMERICAN JOURNAL OF BOTANY [Vol. i6, METHODS Light Conditions In experiments designed to study the effects of light conditions Llpon plant growth either sunlight or artificial light may be used. Sunlight varies over wide limits from day to day and from hour to hour, in addition to its seasonal variations. Davis and Hoagland (7) grew wheat plants for 30 days at different times during the year and found variations in dry weight of from I5.2 grams to 97.5 grams per IOOtops. The temperature was maintained at 20.50 C. throughout the year. These results are attributed to variations in solar radiation. The magnitude of the daily and seasonal variation in solar radiation may be appreciated from an examination of meteorological reports. All light experiments described below were carried out at the Boyce Thompson Institute for Plant Research at Yonkers, New York. The sunlight conditions prevailing during the time of any experiment are shown in the reports of the New York Meteoro- logical Observatory. Owing to these great variations in sunlight, it is difficult to carry out quantitative experiments on the effects of sunlight intensity on plant growth, and it is impossible ever to duplicate exactly the light conditions of one experiment in a later one. Artificial light may be maintained fairly constant, but it differs greatly in quality from sunlight. In this work both artificial light and sunlight have been used. Constant-condition Room The plants grown under artificial light were placed in the constant- condition room at the Boyce Thompson Institute (3). In order to get a range of intensities two I,soo-watt lamps were suspended in front of the air inlet (P1. XXVIII, fig. i). The light intensities varied from 20 to 700 foot-candles depending upon the position in the room. Hourly variations in light intensity were negligible as shown by the pyrheliometric record. TABLE2. ShadingClothUsedfor Greenhouse antdOut-of-door Shades Average LighitIntensity Green- Oult- Mesih (Percent of Outside) house side ShiadingCloth Used (No. Threads Shade Shade per Inch) Greenhouse Outside E 2 layers muslin 52 x 56 I.0 D d I layer muslin 52 x 56 8 20 C c i layer cheesecloth 36 x 40 I9 47 B b i layer cheesecloth 24 X 24 40 74 A a none - 71I 00 The lamps did deteriorate during the course of the experiment and were replaced on May i. Temperatures were uniform throughout the room. At a distance of two feet below the lamps the rise in temperature due to This content downloaded on Wed, 2 Jan 2013 09:45:23 AM All use subject to JSTOR Terms and Conditions
  • 9. May, I929] SHIRLEY -LIGHT AND GROWTH 36I their heat was less than o.5? C. Continuous records of temperature as measured by both wet and dry bulb thermometers were taken by Cambridge resistance thermometers. The temperature varied from 250 to 270 C. with an average of 260 C. and the relative humidity varied from 89 to 93 percent in both light and dark rooms. Normal atmospheric carbon dioxid concentration was used. The plants shaded one another to some extent. This shading was taken into account in making the light measurements. Greenhouse Shades Four wooden frames, 3 x 52 x 4 feet high, were placed in the green- house and covered with different weaves of cloth to provide a range of light intensities (P1. XXVIII, fig. 2). Table 2 shows the arrangement. The transmission of the shading cloth was measured at 8 different wave lengths distributed over the visible spectrum by means of a Konig-Martens spectrophotometer. The transmission of the cloths used was the same for all wave lengths tested. Measurements of light intensity in the different shades were taken with the Macbeth illuminometer on cloudless days between the hours of I I:OO A.M. and I2:30 P.M. The measurements were taken in foot-candles and compared to total daylight intensity. These percentage intensities TABLE 3. Temperature and Humidity Conditions in Greenhouse Shades, October24-March 23, I927-28 Shade ............................. E D C B A Temperature, degrees C. Maximum recorded .28 28 29 30 30 Minimum recorded.............9 ..I9 I9 I9 I9 Ig Mean .24.2 24.0 23.9 23.3 23.7 Average algebraic deviation from daily mean. +0.5 +0.3 +0.2 -o.6 -0 .4 Average absolute deviation from daily mean .o.6 0.4 0.4 o.8 0.9 Mean weekly evaporation from Living- ston standardized atmometers, cc. of water ........i.i............ II8 95 IOO 76 73 showed some variations with the progress of the season, due in part to the change in the angle with which the sun's rays struck the greenhouse glass. Owing to the seasonal variations in illumination only plants grown at the same time can be safely compared. Each shade was provided with forced ventilation from a commercial air- conditioning machine. The temperature and humidity variations in the different shades were thus kept at a minimum (table 3). Temperature conditions during the summer were higher and showed average deviations of 0.50 to 0.90 C. This content downloaded on Wed, 2 Jan 2013 09:45:23 AM All use subject to JSTOR Terms and Conditions
  • 10. 362 AMERICAN JOURNAL OF BOTANY [Vol. i6, The temperature table was made up from daily readings of thermometers placed in the different shades. Readings were made at all hours of the day, but most of them were made at about noon when the deviations were largest. Outside Shades Three cubical wooden frames 8 feet on a side were set up in the garden and covered with one layer of the three shading cloths used in the green- house shades. Figure 3 of Plate XXVIII shows a view of a shade with one side removed. Forced ventilation was supplied the three shades from a fan at a rate calculated to provide for a complete air change every one and one-half minutes. Temperature and evaporation conditions are shown in table 4. TABLE 4. Temperature and Evaporation Conditions in Outside Cages, June 8-August i Shade .............................................. D C B A Light intensity, percent ....................... 20 47 74 100 Temperature, degrees C. Maximum recorded .......................... 32 34 34 33 Minimum recorded........................... 15 14 14 14 Mean . 25.2 25.0 24.7 24.8 Average algebraic deviation from daily +0.3 -0. I - 0.3 Average absolute deviation from daily mean .... 0.5 0.4 0.3 0.5 Mean weekly evaporation from Livingston stand- ardized atmometer cups .47 66 72 85 Spectral Houses To test the effect of light quality upon growth, plants were grown in the spectral glass houses at the Institute. These houses were described by Popp (22). A blue glass has been substituted for the window glass and Corex has been substituted for G 86 B. The house numbers have been rearranged slightly. Text-figure I shows the spectral transmission curves in the visible region of the different glasses used as measured on the Konig-Martens spectrophotometer. Text figure 2 and table 5 show the limits of trans- mission as determined by the Hilgar quartz spectrograph. TABLE 5. Visible and Ultra-violet Spectral Regions Transmitted by the Various Light Filters Used House Name of Wave Lengths Trans- No. Glass mitted (millimicrons) I. Noviol "0" 389-720 II. Corex" 290-720 .I. G 403 ED 374-585 IV.Noviol "C," 472-720 V.. G 34 529-720 The glass was manufactured by the Corning Glass Company. This content downloaded on Wed, 2 Jan 2013 09:45:23 AM All use subject to JSTOR Terms and Conditions
  • 11. May, I929] SHIRLEY -LIGHT AND GROWTH 363 Temperature and humidity conditions prevailing in the houses at the time of growth are shown in table 6. TABLE 6. Temperature and Evaporation Conditions in Spectral Houtses, July i-October 22 House . .................................. I II III IV v Temperature, degrees C. Maximum recorded ................. 42 40 40 38 39 Minimum recorded .................. 20 20 I9 I9 I9 Mean ............................. 29.8 27.8 27.4 27.3 27.2 Average algebraic deviation from daily mean . +2.0 -0.I -0.3 -o.6 -o.6 Average absolute deviation from daily mean ............................ 2.0 0.5 o.6 0.7 0.7 Mean weekly evaporation from Living- ston standardized atmometers, cc. of water ......................... I04 I43 I30 I43 I22 TRANSI//SI/OA OF 69PEC7TPA L GLA SSES _~~I T. T F"'" *8 W/LET BL.UE GREEN YELLtR '/ORANG&E RED V f2 0 1/60 6J00~40 .580 62O 660 700 WAVE L ENGTH I/L L/Af/CRONS TEXT FIG. I. Transmission curves for glass of spectral houses. The Corex, house II. was unpolished. Actually it transmits about 8o percent of the light instead of 25 percent, The measurements were made on a Konig-Martens spectrophotometer. In order to secure comparable light intensities two shades were arranged in each house, so that in each quality condition three intensity conditions were maintained. Light intensity measurements were made with thermo- piles and with the Macbeth illuminometer. Measurements made with the two instruments showed fairly close agreement. This content downloaded on Wed, 2 Jan 2013 09:45:23 AM All use subject to JSTOR Terms and Conditions
  • 12. 364 AMERICAN JOURNAL OF BOTANY [Vol. I6, '0 .0 Y~~~~~~~~~ C CO C C 0 N 0X '0 10) .0 1-4 Cl)C. bOw X .m, 0 )0 0 C.) 0) a YE &i~~~~~~~~~~~ a =~~~~~~~~~~~~~~~~~~~~~ .ut~~~~~~~~~~~ This content downloaded on Wed, 2 Jan 2013 09:45:23 AM All use subject to JSTOR Terms and Conditions
  • 13. May, 1929] SHIRLEY - LIGHT AND GROWTH 365 Effects of Differences in Soil Moisture on the Dry Weight and Root Development of the Bean Plant Since it is very difficult to maintain soil moisture uniform in pots placed in a series of shades, the question arises as to whether or not slight variations in moisture are likely to cause significant differences in the dry weight. Accordingly a special experiment was car- ried out at the Connecticut Agricultural Experiment Station in New Haven, to answer this question. An early variety of red bunch bean was grown in a rich medium sand soil in two-gallon glazed jars. The moisture content of the jars was controlled by filling to weight every other day. The water was added through a glass U-tube which ended in an inverted clay pot filled with gravel. The water distributed itself uniformly through the soil except for the upper inch in the drier pots. The soil moisture varied from a point where the particles of soil would scarcely cohere, to a point where moisture would drip from the soil. The plants in the driest soils sometimes TABLE 7. The Influence of Soil Moisture on the Dry Weight and Root Development of the Bean Soil Moisture Dry Weight (percent of of Tops, io Root Development dry weight) Plants (grams) 7.. 22.6 very extensive IO. 22.3 very extensive II . 20.8 very good I2 . 23.7 very good I5. 22.6 good I6. ............................ good I8 20.3 good i8 .......................... 2 4 .92. good 25 ..... 29.4 poor 27 .-. .... 24. I poor wilted slightly on bright days. Table 7 shows the results obtained. An examination of the table shows that no significant differences in dry weight were produced by the experimental conditions imposed on the plants. Species Used The following species of plants were used in these investigations: buck- wheat (Fagopyrum esculentum Moench.) variety Japanese; dwarf sunflower (Helianthus cucumerifolius Torr. and Gray); Galinsoga parviflora Cav.; avens (Geum canadense Jacq.); green and purple wandering Jew (Trade- scantiafluminensis Vell. and Zebrina pendula Schnizl.); hog peanut (Amphi- carpa monoica (L.) Ell.); California redwood (Sequoia sempervirens Endl.); loblolly pine (Pinus Taeda L.), tomato (Lycopersicum esculentum Mill.) variety Bonny Best; tobacco (Nicotiana Tabacum L.), variety Turkish. Treatment of Plant Material Before and During the Experimental Period The plants were grown in a rich composted loam soil, containing a high sand fraction. The soil was sterilized with steam and leached before using. Eight-inch clay pots were used for growing all plants except tomato and tobacco, which were grown in two-gallon jars perforated at the bottom. Buckwheat seed was sown in the pots. When the cotyledons had com- This content downloaded on Wed, 2 Jan 2013 09:45:23 AM All use subject to JSTOR Terms and Conditions
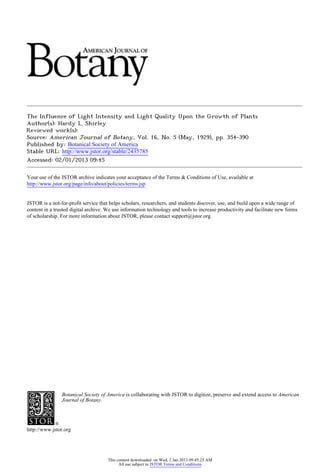
  • 14. 366 AMERICAN JOURNAL OF BOTANY [Vol. x6, _ 2 ?~0 /.8 - 1.6 /4 1.0 ConstoonLl9ht Room /2 Hoilr Day 0.8 0 |ockwheat 48 days 8| Sunf/os'er 48dayT (JoRedwood J5days / Geum c54c/ays z as lr I / J e Galinsoqa 3Sdays 0,C6 404 /00 20 00 400 500 600 700 Liqht intensity Foot Candles TEXT FiG. 3. The influence of 12 hours daily artificial illumination of different intensities on the production of dry matter in plants. The dry weight is almost directly proportional to the light intensity. This content downloaded on Wed, 2 Jan 2013 09:45:23 AM All use subject to JSTOR Terms and Conditions
  • 15. May, I929] SHIRLEY -LIGHT AND GROWTH 367 pletely unfolded the plants were thinned to I5 to 25 plants per pot, and allowed two or three days to adjust themselves before placing under the shades. All other plants were transplanted to the pots soon after their first pair of leaves had unfolded. Redwood and loblolly pine seedlings were usually 2 to 5 centimeters high when placed in the cages. Geumwas I to 2 months old. A sample of each species of plants was taken for dry- weight determinations at the start of an experiment to determine the 05 04 Coanstofnl L,ghr Room Com'inoes l/t/fl(JifatIa // 03 02 0/ eum '3 Hoy Peanwot b / @ GaZirsoga~G ,/ @ s/ Jcaff o Redwood Q /0 20 30 f0 50 60 70 L/ght Intens/ty Foot C(and/es TEXT FIG. 4. The influence of continuous artificial illumination of different in- tensities on the production of dry matter in plants. initial dry weight. For sunflower, buckwheat, and Gal'insoga 15 to 20 plants were grown per pot. Loblolly pine was grown IO to the pot, and Geum and redwood 5 plants to the pot. Tobacco and tomato were grown in in dividual pots. This content downloaded on Wed, 2 Jan 2013 09:45:23 AM All use subject to JSTOR Terms and Conditions
  • 16. 368 AMERICAN JOURNAL OF BOTANY [Vol. i6, The plants were watered and examined daily. Measurements were made of height each week, and notes taken on the general appearance and progress of the plants. Analysis of Plant Material The annual plants were grown until flowering and usually until fruiting had started. Before harvesting, one or more average dominant plants were chosen from each pot for leaf area and chlorophyll determinations, except in tomato and tobacco where only one leaf from each plant was used. A blueprint of the leaves was made and the area determined by a planimeter. After blueprinting, the leaves were used for chlorophyll GREEI7HO/S Firsr Series I Z6'uc/wheat OCt/a-Nov-25T * Ga/lnsoga Oct:24-iov229 V./ 0 r 7 o Sunflower 0ct24-A0oz13-0 065 0 /Jo3 36 4to 50 .60 71 Li /ght intensity per ce7t of toata sun/iht TEXT FIG. 5. The production of dry matter in different intensities of daylight. The curve for buckwheat is convex upwards while the others are approximately straight lines. determinations. Chlorophyll was estimated by the method of Willstatter and Stoll as modified by Schertz (26). A colorimeter was used to compare the pigment with a standard made up from crystalline chlorophyll, and the standard described by Guthrie (I2). The remaining plants were used for fresh- and dry-weight determinations. The plants were cut off at the surface of the soil and the tops weighed This content downloaded on Wed, 2 Jan 2013 09:45:23 AM All use subject to JSTOR Terms and Conditions
  • 17. May, I929J SHIRLEY -LIGHT AND GROWTH 369 immediately. TI'heywere then taken to a cold room and frozen. The next day the frozen plants were run through a food chopper. The ground material was thoroughly mixed and a proportionate sample taken for GREENA/O1SE SHA DES /927-1928 7- .6- 4 4 &eaccotdseries/ ouelcAwheat Dec 25- Fe'/ / * Ga/r7soya Dec /6 -Jlar/14- o6Surn/owler Dec/16-J-?aJ// SUNFLOWC /a5 /0 /6 20 30 L0 50 55 60 I I/ght 1ntensity per cenrr o07 o7-at/ s&nl//917 TEXT FIG. 6. The influence of shading in midwinter on the production of dry matter. These curves approximate straight lines closer than those of text figure 5 where the total amount of light received was greater. moisture determination. If the plants were small the entire plant was used for a moisture sample. The moisture samples were dried to constant weight in a vacuum oven run at 700 C. The roots of redwood, loblolly pine, and Geumwere washed otutand dried separated from the tops. This content downloaded on Wed, 2 Jan 2013 09:45:23 AM All use subject to JSTOR Terms and Conditions
  • 18. 370 AMERICAN JOURNAL OF BOTANY [Vol. i6, In each experiment from 2 to 6 pots of plants were used in each light condition. In the analysis of the material for fresh and dry weight the plants of each pot were treated separately so that the average deviations for the individual pots could be calculated. The complete data taken on each set of plants were considered too bulky to be included in this paper. The curves and data presented are the mean values from a large number of plants. In the constant-condition room 20 redwood and Geum plants were grown in each intensity and 40 of all other plants. In the spectral house shades io Geum plants and 30 sunflowers and Galinsoga plants were grown in each condition. In the greenhouse and outside shades from 15 to 30 of each perennial species, and 30 to I50 of each annual species, were used in each shade except tomato and tobacco, of which six were used. RESULTS Light Intensity Studies In the constant-condition room with 12 hours daily illumination all plants except sunflower survived for the period grown with less than 50 foot-candles illumination (table 8). Although sunflower showed some TABLE 8. Survival at Low Intensities No. of Light In- Per- Percentage In- Plant Days tensity (foot- centage crease in Dry Grown candles) Survival Weight Sunflower ....................... 48 46 0 Geum .......................... 54 41 90 358 Redwood ....................... 55 30 90 66 Galinsoga ....................... 35 25 92 I ,670 Buckwheat ..................... 48 26 96 2,500 growth at first in the lower intensities, it died before the experiment was closed. The buckwheat plants had started to die in the lower intensities when harvested. Of the plants grown under shades, all except sunflower showed 50- percent survival under the lowest intensities maintained, from 0.5 to 1.5 percent of total sunlight. Sunflower survived better under I-percent intensity during the winter than during the summer. This was probably due to the higher temperature in summer which increased the rate of respiration. Redwood plants survived for 6 months with I-percent sunlight intensity but half of them had died by the end of the seventh month. Loblolly pine survived five months under the same conditions but was dying by the end of the sixth. The herbaceous plants were grown for much shorter periods of time. Production of Dry Matter With twelve hours daily illumination in the constant-condition rooms the dry weight produced by the plants grown was almost directly pro- This content downloaded on Wed, 2 Jan 2013 09:45:23 AM All use subject to JSTOR Terms and Conditions
  • 19. May, I929] SHIRLEY - LIGHT AND GROWTH 37I portional to the light intensity up to the highest intensities available under the two 1,500-watt lamps. A similar result was obtained with continuous illumination except that at 70 foot-candles hog peanut showed a decrease due to the injury caused by continuous illumination (text figs. 3 and 4). During the winter the dry weight produced by the shaded plants was almost directly proportional to the light intensity received up to the highest intensities available in the greenhouse (text figs. 5, 6, 7). During the summer, some plants in the greenhouse shades showed a tendency to use the light less efficiently at the higher intensities (text fig. 8). The plants grown in the outside shades under lower night and day temperature con- ditions showed different shaped curves (text fig. 9). The slope of the GPEE/V HOISE SHA DE? /928 W,. I . I . I 202 L 1~~~ET OO voV/7-A/AR/'I- GAIDJN06 20 *0 60 8 L/6HT /NTEN/J TY PE'RCENT OF SUNL/6/IT TEXT FIG. 7. The effect of different daylight intensities on the productionof dry matter in plants in the early spring. Only one series of redwoodand Geumgave curves convex upwards. The relative positions of the curvesare not significant. curves decreased and there was a tendency to develop maximum dry weight at lower light intensities than inside. The light intensity may be reduced 50 percent during midsummer without seriously affecting the growth of the plants studied. A further reduction to 20-percent intensity caused decreased dry weight for most of the plants used. Later in the season the same plants gave curves convex downward but not tending to run parallel to the axis (text fig. io). Redwood and Geum produced maximum dry weight at 50 and 75 26 This content downloaded on Wed, 2 Jan 2013 09:45:23 AM All use subject to JSTOR Terms and Conditions
  • 20. 372 AMERICAN JOURNAL OF BOTANY [Vol. i6, Greehouse Shades /928 8 P~~~~~~~~~~~~~ellwood A/arch1 2 7- 0cZac? 7.0 Tomato Apr 30-duPe5 | 6.0 GetunA/arch2 7-dJne 4 40 Q / / Sunf/ow,erJut7e5-Auy. /13 La b/oily Apr.30 Oct9 // f/ower sep7;26-&c7; 29 04 goLI/Hog Peanutr Aarch2 7-dlone 61a/h7soga Sepr7- Ocr) /1 0 20 '9o 60 80 /00 L/htite/neity percent- of taTa/ snun/hb7t TEXT FIG. 8. The effect of different degrees of shading on the production of dry matter in plants grown in the greenhouse in midsummer. Tomato, hog peanut, and Geurn show a decrease in the efficiency with which they use light at the higher intensities. For all other plants the dry weight is almost directly proportional to the light intensity. The relative position of these curves is not significant. This content downloaded on Wed, 2 Jan 2013 09:45:23 AM All use subject to JSTOR Terms and Conditions
  • 21. May, I929] SHIRLEY- LIGHT AND GROWTH 373 percent of full summer sunlight. When placed in direct sunlight, growth in these plants, together with loblolly pine, appeared to have been arrested. They immediately developed considerable red pigment in the leaves, while the tips of the leaves turned brown and died. Later they apparently Oi,Aside sh/des L4A'e / fo' Sept 26, /928 8~ /670 '.0 , T~~~~ ~e o-~ ~ ~uto-or in mismmr At thstm-fyarardcint ~~~~~~~~~~~~~~~~~~~~~~~~~~~~~~~~~~~~~~~~~~~~~~~10 13 e0 40 608 o on-afof full daylight caused-little decrease in dry weight. beaeadjusted and were growing nicely when harvested. All other ulassed produced maximum dry weight in full summer sunlight. Tcareful examination of the curves will show a slightly different shape This content downloaded on Wed, 2 Jan 2013 09:45:23 AM All use subject to JSTOR Terms and Conditions
  • 22. 374 AMERICAN JOURNAI, OF BOTANY [Vol. i6, for different species under comparable light intensities. The curves for Geum, hog peanut, redwood, tomato, and buckwheat show a tendency towards being convex upwards while for sunflowers, tobacco, and Galinsoga the curves are nearer straight lines or convex downward. As one would expect, plants which usually grow in the shade, as Geumrand hog peanut, (2/&ade shades Au9./0to Sept. 20, 1928 -I - - 10,ep1, 2600 o~~~~~~~~c~~f 15.0 0 k Or i-..~~~~~~~~~~~~~~~~~~~6 0.0 a AV S 4~~~, .0, 110"~ ~ ~ ~ 11 20 /0 60 80 /00 Light inten4sity per cent of to-al sul/i//ht TEXT FIG. IO. The production of dry matter in plants under a range of daylight intensities in the late summer. Any decrease in intensity at this time of year caused a corresponding decrease in the production of dry matter. were found to use light less efficiently at high intensities than at low ones. On the other hand, one would expect plants which usually grow in sunny habitats to use light with equal or greater efficiency at moderately high intensities than at low intensities. Sunflower and Galinsoga maintained their initial efficiency rate at considerably higher intensities than Geum and hog peanut. Total Solar Radiation Requiredfor Growth Hourly records of the total solar radiation in gram calories received on a square centimeter of horizontal surface are published each month by the This content downloaded on Wed, 2 Jan 2013 09:45:23 AM All use subject to JSTOR Terms and Conditions
  • 23. May, I929] SHIRLEY -LIGHT AND GROWTH 375 New York Meteorological observatory located in Central Park, New York City. The Boyce Thompson Institute for Plant Research is only I3 miles from this observatory, so it seems reasonable to assume that the radiation GREEA///O/SE S/A4DES /1927-/929 I~ ~ ~~~~~~~~~~~~~ I .8_/ .6 f1 t St41WFLOWER .2 A R. rCJA NTI' X~~~~~~~~~~O~1 NOVfS029 3 4 GAL/ INOGA .2 PDC 6M ./ O-e 0 /000 J00 3000 4000 5000 TOUALSOL5AR/?DAT/&/ CE/VED GPAA CALORIES TEXT FIG. II. The influence of total solar radiation received on the production of dry matter in plants. Note that the plants receiving the longer daily period of illumination grew better than those grown in midwinter. received at the Institute over a period of a month or more would be approxi- mately equal to that received at Central Park. Text figure ii shows the amount of dry weight produced per plant per gram calory of radiation received on a square centimeter of horizontal This content downloaded on Wed, 2 Jan 2013 09:45:23 AM All use subject to JSTOR Terms and Conditions
  • 24. 376 AMERICAN JOURNAL OF BOTANY [Vol. I6, surface. During the period over which these plants were grown the temperatures were held fairly uniformnas shown above. It will be noticed that for both Galinsoga and sunflower the plants grown in midwinter with 62ctside 6She s / 7 I~~~~~~~~~~ /3 7 0 20 .9C 60 80 /00 L1h9'tisfenifty per cel7t of fotcl/ sun/li/ht TEXT FIG. I2. The influence of light intensity upon the percentage of dry matter in plants. the shortest day lengths produced the least dry matter per unit energy received. This is in accord with results presented by Davis and Hoagland (8). Aside from this point the correlation between plants grown at one This content downloaded on Wed, 2 Jan 2013 09:45:23 AM All use subject to JSTOR Terms and Conditions
  • 25. May, I929] SHIRLEY -LIGHT AND GROWTH 377 time as compared with another is not close. This lack of correlation is partly due to the fact that the plants were not all harvested at the same age. Percentage of Dry Matter The percentage of dry matter in the tops of plants increased with increasing light intensity, as shown in text figure 12. OAit/de shades /928 , I 'I lI /~~~~~~~~~~~~~~~~~~~~ 1-..~ ~ ~~~~~1 Loll jun?e' o~~~~~~~~~~~~~~~~~~~~~~~~~~~ O f90 60 80 /00 LiXhfb intensityper cent of totial sal7li9ht TEXT FIG. I3. The influence of light intensity on the proportion of root to shoot, Ratio of Root to Shoot Low light intensity favors top growth at the expense of root growth. This is well demonstrated in the ratio of dry weight of roots to dry weight of tops (text fig. I3 and P1. XXIX). Height Growth With decreasing light intensity the plants studied tend to increase their height. The height attains a maximum at about 20 percent of full summer sunlight, or 6o percent of late summer sunlight (text figs. I4 and I5 and Pls. XXIX-XXXI). Upon further decrease in light intensity the height This content downloaded on Wed, 2 Jan 2013 09:45:23 AM All use subject to JSTOR Terms and Conditions
  • 26. 378 AMERICAN JOURNAL OF BOTANY [Vol. i6, falls off rapidly. It seems evident that the light intensity cannot be reduced below the point at which maximum height growth occurs without causing incipient starvation of the plant. Plants under high light intensities tend 6tfSide Shades' /192P i .- Z /20 20 f8 60 80 /00 Liqht intenosity pe?r cent7 of-taol Jwsunllyht TEX:T FIG. 14. The influence of light intensity on the height growth of plants. Contrast with text figure 9, which shows the dry weight of the same plants. The tallest plants usually had the least dry weight. to attain complete height growth earlier than shaded plants due to the fact that they mature earlier (text fig. i6). This content downloaded on Wed, 2 Jan 2013 09:45:23 AM All use subject to JSTOR Terms and Conditions
  • 27. May, I929] SHIRLEY - LIGHT AND GROWTH 379 Strength of Stem and Form of Plant The stems of the plants grown under low intensities were weak and succulent, often too weak to support the plant (Pls. XXIX-XXXI). The lack of sufficient woody material accounts for their weakness and brittleness. The heavily shaded plants had long internodes and few branches. The density of growth increased with increasing light intensity te1~~~~~ I I 60 (Sw,.coIf 1. t /~~~~~~~~~~~~~t Z>20 Outside Shades /1928 00 20 g,o 60 80 /00 L1ift 17/-enslty per cewt of total awn//ght TEXT FIG. I5. The influence of shading in late summer on the height growth of plants. At this season a decrease to 20-percent intensity caused a decrease in height growth. Text figureIO shows the dry weights of these plants. Leaf Development The leaf area per plant seemed to follow height growth rather closely and attained a maximum at about the same light intensities. Leaf thick- ness increased with increasing light intensity as shown by the weight of Ioo square centimeters of leaves and by cross section studies (text fig. I7). The internal structure was also modified by light intensities. Under low intensities the palisade tissue decreased from two layers to one layer, while the intercellular spaces increased slightly. Chlorophyll Concentration Table 9 shows the chlorophyll concentrations per unit leaf weight and per unit leaf area. For all plants studied there is a tendency to increase the chlorophyll concentration with decreasing light intensities until a critical intensity is reached. Further decrease in light intensity causes a decrease in chlorophyll concentration. This is more pronounced when This content downloaded on Wed, 2 Jan 2013 09:45:23 AM All use subject to JSTOR Terms and Conditions
  • 28. 380 AMERICAN JOURNAL OF BOTANY [Vol. i6, TABLE 9. Chlorophyll Concentration in Leaves Plant Material ............................. Chlorophyll per io Grams Chlorophyll per IOO Sq. Cms. Fresh Leaves (milligrams) Leaves (milligrams) Outside Shades Light Intensity (percent) ............ 20 47 74 IOO 20 47 74 IOO Sunflowers, June 5-Aug. 20 .......... I7 II II 9 3.I 2.3 2.3 2.7 Tomato, June i-Aug. 8.............. 20 I5 I4 I2 3.5 3.3 3.2 3.6 Tobacco, June 5-Aug. I5 ............ I4 IO II 9 2.7 2.9 3.4 2.7 Galinsoga,June I-July 5............. I8 II II I2 2.7 I.8 I.9 2.3 Geum,June 5-Sept. 2I .............. I6 i6 IO I2 3-5 4.7 3-3 3-7 Galinsoga, Aug. i6-Sept. i6 .......... 32 20 24 i8 5.I 2.8 3.7 2.9 Tomato, Aug. io-Sept. 17 ........... 26 I5 I5 IO 3.5 3.0 3.2 2.9 Buckwheat, Aug. I7-Sept. I6. . . . I9 23 I9 I6 2.9 3.4 2.8 2.5 Greenhouse Shades Light Intensity (percent) ............ I 8 I9 40 7I I 8 I9 40 71 Hog peanut, March 27-June 4 ... ..... 55 63 4I 38 28 3.I I.9 I.3 I.3 I.2 Geum, March 27-June 4............. 28 34 33 27 24 3.6 4.I 4.6 4.7 4.0 Galinsoga, June 5-Aug. 8 .. .......... 2I 29 3 I 25 22 3.3 3. I 3.4 3.0 3.0 Tomato, April 30-June 5............ 9 22 I8 I3 II I.9 2.8 3.I 3.I 2.4 Sunflower, June 5-Aug. I3 ........... - I7 I7 20 I2 - 2.5 2.8 3.3 2.3 considered on the basis of leaf weight than on the basis of leaf area. Sun- flower has a relatively low pigment concentration, and shows relatively slight variations with light intensity. Hog peanut, on the other hand, showed higher concentrations and larger variations under different intensities than the other plants used. Flowering and Fruiting The first flowers were produced at about the same time under all light intensities unless the light intensity was so low as to seriously stunt the growth. While shading caused no appreciable delay in the time of appear- ance of the first flowers, maximum flower development occurred earlier with the plants receiving the higher intensities. Ripened fruit also could be found in all intensities at about the same time; however, in the higher intensities maximum fruit development was earlier. Shading seemed to prolong the vegetative and fruiting periods, while full sunlight intensities hastened maturity. These observations on flowering and fruiting are based on buckwheat and Galinsoga which flower and fruit on any day length from 9 hours to 24 hours. Plants grown with less than io percent of full summer sunlight produced only occasional flowers and no ripened fruit. Sunflower never flowered on less than Ig-percent intensity; buck- wheat and Gal'insoga,on the other hand, flowered with 8-percent intensity but did not fruit. Light QualityStudies Dry Weight Table io shows the production of dry matter with Io-percent light intensity in the different spectral regions. The dry weight curves for Geum are shown in text figure i8. This content downloaded on Wed, 2 Jan 2013 09:45:23 AM All use subject to JSTOR Terms and Conditions
  • 29. May, I929] SHIRLEY- LIGHT AND GROWTH 38I The entire visible and ultra-violet solar spectrum, house II, is more efficient for the production of dry matter in the plants grown than any of the other qualities used. Removal of the ultra-violet and some violet, house I, causes no very significant decrease in efficiency. Blue light, house III, also gave satisfactory growth. When all the blue is removed, as in Height_9ro/thcurive I I I II - - I' I I - I Sunf/owers Oc2tside Sh/adees Agnein-A . w0ee ~~~~~~~ 70 ~ ~ ~ ~ ~ ~ ~ ~ ~ ~ ~ ~~~~~~4 q) 60 Ar. '1..~~~~~~~~~~~~~~~~~~~~~~~~~~~~~~~~~~~~1 ~20 Aye In vveek6 TEXTFIG. i6. The influenceof different daylight intensities on the weekly height growth of sunflowers. The plants in full daylight were always shorter. Those receiving 20-percent intensity continuedrapid height growth after the others had begun to mature. TABLE IO. SpectralShades. Dry WeightperPlant in GramsUnderIo- PercentLightIntensity Wave Lengths Transmitted (millimicrons) II III I IV v 290-720 374-585 389-720 472-720 529-720 Galinsoga, May 30-July 5.. 57 .3I .40 .30 .26 Galinsoga, July i-Aug. I5 .28 .20 .29 .i6 .10 Galinsoga,Sept. 9-Oct. I9 .. 55 .27 .63 .37 .17 Sunflower, June 5-Aug. I3 .i.i6 .55 .49 .13 .04 Sunflower, Sept. I9-Nov. I .40 .22 .55 .20 .II Geum,July IO-Oct. 24 ..................2.30 I.32 i.o8 I.26 .63 This content downloaded on Wed, 2 Jan 2013 09:45:23 AM All use subject to JSTOR Terms and Conditions
  • 30. 382 AMERICAN JOURNAL OF BOTANY [Vol. I6, 8ED 2 BED ! 835D2 RED 5 TEXT FIG. I7. Camera lucida drawings of cross sections of buckwheat leaves of This content downloaded on Wed, 2 Jan 2013 09:45:23 AM All use subject to JSTOR Terms and Conditions
  • 31. May, I929] SHIRLEY - LIGHT AND GROWTH 383 house V, a serious decrease in efficienicy results, while house IV is inter- mediate in efficiency. Form and Vigor Normal plants have not been grown without the use of blue light (see P1. XXXII). The plants of house V, minus blue, were tall and weak, thus suggesting etiolated plants in appearance. The leaves were badly rolled and often crinkled. Plants grown under the blue glass seemed to be stunted somewhat, having very short internodes but rather sturdy stems. The GecImSpectlral Shades 7,0 du/y/~0- Oct; 2L, /928 / 6.C 2 .0 K ~jA0 0 /0 20 30 4?0 50 60 70 80 Light intensity per cent of totat sunlfgh/t TEXT FIG. I8. The effect of different light qualities and intensities on the production of dry matter in Geum. Curve II is for normal daylight; curve I is minus ultra-violet; curve III (dotted) is blue light; curve IV is minus violet and part of blue; curve V is minus all the blue. Quality II is most efficient and quality V is the least efficient. This content downloaded on Wed, 2 Jan 2013 09:45:23 AM All use subject to JSTOR Terms and Conditions
  • 32. 384 AMERICAN JOURNAL OF BOTANY [Vol. i6, plants from house II were always most sturdy and vigorous, followed by those of houses I and IV. Blue light if of sufficient intensity prevents excessive elongation and an etiolated type of growth. Chlorophyll Concentration Table ii shows the chlorophyll concentrations in the different houses. TABLE II. Chlorophyll Concentration, Spectral House Shades Chlorophyll per IO Gms. Clhlorophyll per Ioo Sq. Cms. Fresh Leaves (mgs.) Leaves (mgs.) - 4 o 25 2 23 ~~~~~~) ~~~~~~~~~~~~~.~~~C 65 I5 I2 I7 14 15 3.7 2.0 5.8 2.2 2.2 290-720 I0 29 I6 27 28 38 5 5 2.8 4.6 3.8 4I . 5 27 - 22 29 3I 3.7 - 3.6 3.6 3.7 IO 20 i6 49 25 29 3.9 3.4 4.0 3.6 4.0 374-585 4 25 - 25 26 23 3.3 5.2 3.7 3.8 I 49 - 20 3I 28 7,3 - 4.2 4.5 4.7 47 13 I4 20 I7 i8 2.7 3.I 3.9 2.3 2.2 472-720 25 23 i8 27 29 24 3.6 2.7 4.4 3.8 3.2 9 i8 - 25 29 29 2.8 - 4.0 3.5 4.I 37 i6 20 I2 i8 19 2.8 4-3 5.3 2.7 3.0 529-720 19 I7 - I 7 24 I I 3.3 4.1I 3.7 3.6 3 24 - I7 23 20 3.9 - 2.4 4.1 3.4 In all light qualities used, the plants increased their chlorophyll concen- tration with decreasing intensity to a certain point. For io-percent intensity all qualities gave approximately the same chlorophyll concen- tration-house V was usually lower and house III often higher than the others. DISCUSSION OF RESULTS The light intensities needed for survival of the plants used seem to be even much lower than the values given for other plants by Bates and Roeser (i), Burns (5), and Grasovsky (ii). However, the determination of the minimum light intensity required for mere existence of a particular species is probably of little ecological significance, since the plants studied demand ten times as much light or more for flowering and fruiting. It seems probable that if several species of plants were competingo n an area which was illuminated by a light intensity well above that required for This content downloaded on Wed, 2 Jan 2013 09:45:23 AM All use subject to JSTOR Terms and Conditions
  • 33. May, I929] SHIRLEY -LIGHT AND GROWTH 385 survival the plants having the fastest growth rate would become dominant, at least for the first generation, rather than those having the lowest light requirement for survival. The difference in the ability to survive under low light intensities may be due not so much to differences in the efficiency of the photosynthetic equipment of different species as to differences in the basal metabolism of the growing plant. With increasing light intensity the rate of growth as measured by increase in dry matter is almost directly proportional to the light intensity up to 20 to 30 percent of full summer sunlight. Above 5o-percent intensity the amount of growth increases very little with further increases in light. While slight shading causes no marked deleterious effects, shading which cuts out 80 percent or more of the light reduces the amount of growth considerably. The optimum light intensities for the production of dry matter were much higher than those found by Grasovsky (II), Lubimenko (I9), and Shantz (27). They are in approximate accord with the values given by Combes(6), GarnerandAllard(10), Popp (2I), Ros6 (23), and Zillich(29). In view of the wide differences in species used, methods of experimentation, and especially of temperature and sunlight conditions, close agreement cannot be expected. The differences in the dry weight curves for the plants grown in the greenhouse shades compared to the plants grown in the outside shades at the same time are attributed in part to the higher range of light intensity outside, but largely to the higher temperature conditions prevailing inside the greenhouse. Temperature must have acted as a partially limiting factor in the outside shades. This is in accord with the conclusions of Blackman and Matthaei (2) for the influence of temperature on the rate of photosynthesis, and with data presented by Davis and Hoagland (8), which showed that the temperature required for optimum dry weight production increased with increasing light intensity, within certain limits. The correlation between dry weight produced and total solar energy received is not close. To secure good correlation of these factors the temperatures should be uniform, the day lengths should be the same, the plants should be harvested at the same age, and the light intensities should not be so high at any time as to either directly or indirectly inhibit the rate of photosynthesis. A number of investigators have reported on experiments on the effects of light conditions upon the growth of plants in which height measurements and notes of general vigor were used as criteria of growth. For the plants used by the writer height and general appearance proved to be the least reliable criteria, while dry weight of the entire plant and dry weight of the fruit proved the most reliable. A comparison of text figures 9 and I0 with 14 and I5 shows that dry weights increased while height decreased with increasing light intensity. Even fresh weight may be deceptive due to This content downloaded on Wed, 2 Jan 2013 09:45:23 AM All use subject to JSTOR Terms and Conditions
  • 34. 386 AMERICAN JOURNAL OF BOTANY [Vol. I6, the much greater water content of the shaded plants. The necessity of considering the roots of woody plants is well emphasized by the redwood from the outside shades. At 2o-percent intensity the root formied only 25 percent of the dry weight of the entire plant, while at 0oo-percentin- tensity the root formed 46 percent of the total dry weight. Low light intensities tend to produce vegetative growth at the expense of flowers and fruit, top growth at the expense of root growth, large leaf area at the expense of leaf thickness, and succulence at the expense of sturdiness. Of the plants investigated sunflower is the most exacting. It needed more light for survival, more for flowering and fruiting, more for maximum height growth, and more for attaining miaximumdry weight. Not only was sunflower more exacting in its intensity demands but it also showed much greater injury when grown in fractional parts of the solar spectrum than the other plants used. Sunflower was able to use the light with almost equal efficiency up to the highest intensities used, provided the temperature was sufficiently high, while Geum and hog peanut showed a decided decrease in efficiency at the higher intensities. The increased efficiency of Geum and hog peanut at lower intensities may be attributed in part to their ability to increase their chlorophyll concentration. ECOLOGICAL SIGNIFICANCE Since the light intensities under forest canopies are only O.I6 to 20 percent of full sunlight, and since a reduction of the light intensity below 20 percent of full sunlight causes a marked decrease in the amount of dry matter produced by plants, it seems evident that the light intensities prevailing under well stocked stands of forest trees are almost always below the optimum for the growth of higher plants, and may often approach the limiting values for survival. However, it should be borne in mind that light is not the only growth factor which may be below the optimum in the forest. The change in quality of the light passing through the forest canopy, on the other hand is not a serious factor in the growth of the plants. The loss of the blue spectral region due to absorption by the leaves is more than compensated for by the gain in percentage of skylight as shown by Klugh's measurements (15, I6). The loss in the red region causes no significant difference in the efficiency of the light as shown by studies in the spectral houses. It seems certain that the poor growth of plants under forest canopies is not to be attributed to changes in light quality. The increase in the percentage of the blue spectral region of forest light compared to daylight will cause intensity determinations, made by the use of light-sensitive paper, which is affected more by the blue region than by the red region, to be too high. Only methods which are uniformly sensitive to all wave lengths can be safely used in comparing forest light with daylight. This content downloaded on Wed, 2 Jan 2013 09:45:23 AM All use subject to JSTOR Terms and Conditions
  • 35. May, I929] SHIRLEY -LIGHT AND GROWTH 387 SUMMARY I. Plants were grown under four sets of light conditions: (i) under cloth shades inside a greenhouse; (2) under cloth shades out-of-doors; (3) in a con- stant-condition room supplied with artificial illumination; (4) in a series of houses covered with glasses transmitting definite spectral regions. Curves are presented showing the influence of light intensity upon the total pro- duction of dry matter, percentage of dry Inatter, height growth, and ratio of roots to shoots. Studies of chlorophyll concentration, leaf area, and time of flowering and fruiting were also made. The effects of different qualities of light on growth are shown. A discussion of the silvical and ecological significance of the studies is given. 2. The light needed for the survival of the plants grown is very low, being less than 40 foot-candles for all except sunflower, which requires a much higher intensity. 3. Redwood and loblolly pine are able to survive for a period of 6 months under a light intensity at which they are barely able to increase in dry weight. Sunflowers, on the other hand, died within two or three weeks. 4. At low light intensities the dry weight produced by the plants studied is almost directly proportional to the intensity received up to about 20 percent of full summer sunlight. At higher intensities the slope of the curve falls off, shade plants showing a decrease at lower intensities than sun plants. 5. The percentage of dry matter in tops, the ratio of dry weight of roots to dry weight of shoots, the density of growth, the strength of stem, and the leaf thickness all increased with increasing light intensity. 6. Leaf area and height attained maxima at light intensities of about 20 percent of full summer sunlight. 7. Chlorophyll concentration increased with decreasing light intensity until the intensity was so low that it hazarded survival. Further decrease in light intensity caused a decrease in chlorophyll concentration. 8. The time of maximum flowering and fruiting was considerably delayed by low light intensities. Fruiting did not occur at all in the plants studied in intensities below 8 percent of full summer sunlight. 9. The entire visible and ultra-violet solar spectrum is more efficient for the growth of the plants studied than any portion of it used; the blue region of the spectrum is more efficient than the red region. io. Light intensity is usually a limiting factor in the growth of the vegetation under a forest canopy. ii. Light quality is not a seriously limiting factor in the growth of plants under forest canopies. I2. Moderate variations in soil moisture are not likely to cause significant changes in the dry weight produced by plants provided the moisture content is not so low that it approaches the wilting coefficient, or so high that it approaches saturation. This content downloaded on Wed, 2 Jan 2013 09:45:23 AM All use subject to JSTOR Terms and Conditions
  • 36. 388 AMERICAN JOURNAL OF BOTANY [Vol. i6, The writer wishes to acknowledge his indebtedness to the members of the Botanical Department of Yale University for helpful criticisms of the work. He is also indebted to Dr. F. M. Schertz, associate biochemist, Bureau of Chemistry and Soils, U. S. D. A., for his kindness in furnishing a sample of crystalline chlorophyll, and for allowing the use of his method prior to its publication. BOYCE THOMPSON INSTITUTE FOR PLANT RESEARCH, INC., YONKERS, NEW YORK LITERATURE CITED i. Bates, C. G., and J. Roeser, Jr. Light intensities required for growth of coniferous seedlings. Amer. Jour. Bot. I5: I85-194. I928. 2. Blackman, F. F., and G. L. C. Matthaei. On vegetative assimilation and respiration. Proc. Roy. Soc. London B 76: 402-460. i9o5. 3. Boyce Thompson Institute for Plant Research, Inc., Yonkers, N. Y. Contributions I: i6. I925. 4. Boysen-Jensen, P. Studies on the production of matter in light and shade plants. Bot. Tidskr. 36: 2I9. I9I8. 5. Burns, G. P. Minimum light requirements referred to a definite standard. Vermont Agr. Exp. Sta. Bull. 235. I923. 6. Combes, R. D'etermination des intensites lumineuses optima. Ann. Sci. Nat. Bot. IX, II: 75. I9I0. 7. Davis, A. R., and D. R. Hoagland. An apparatus for the growth of plants in a con- trolled environment. Plant Physiol. 3: 277-292. I928. 8. . Further experiments on the growth of plants in a controlled environment. Abst. in Amer. Jour. Bot. I5: 624. I928. 9. Fricke, K. Licht- und Schattenholzen. Centralbl. Ges. Forstwesen 30: 3I5-325. I904. (Rev. in U. S. Dept. Agr. F. S. Bull. 92. I91I.) I0. Garner, W. W., and H. A. Allard. Sunlight and plant -growth. Jour. Agr. Res. I8: 580. I920. II. Grasovsky, A. Some aspects of light in the forest. Yale Univ. School Forestry Bull. 23. I929. I2. Guthrie, J. D. A stable colorimetric standard for chlorophyll determinations. Amer. Jour. Bot. I5: 86. I928. I3. Harder, R. Kritische Versuche zu Blackmans Theorie der " begrenzenden Faktoren" bei der Kohlensaureassimilation. Jahrb. Wiss. Bot. 6o: 531-57I. I921. I4. Kimball, H. H. Records of total solar radiation intensity and their relation to day- light intensity. Monthly Weather Rev. 52: 473-479. I924. I5. Klugh, A. B. Ecological photometry and a new instrument for measuring light. Ecology 6: 203. I925. I6. - . A comparison of certain methods of measuring light for ecological purposes. Ecology 8: 4I5-427. I927. I7. Knuchel, H. Spectrophotometrische Untersuchungen im Walde. Mitteil. Schweiz. Centralanst. Forst. Versuch. II. I924. I8. Kvapil, K., and A. Nemec. Uber den Einfluss des Lichtes auf einige physikalische und chemische Bodeneigenschaften in reinen Nadel- und Laubholzbestanden sowie in gemischten Bestanden. (Abst. in Bot. Centralbl. I53: 473. I928). I9. Lubimenko, W. Production de la substance seche et de la chlorophylle chez les vegetaux superieurs aux differentes intensites lumineuses. Ann. Sci. Nat. Bot. IX, 7: 32I-4I5. I908. 20. Pfeiffer, Norma E. Anatomical study of plants grown under glasses transmitting light of various ranges of wave length. Bot. Gaz. 85: 427-436. I928. This content downloaded on Wed, 2 Jan 2013 09:45:23 AM All use subject to JSTOR Terms and Conditions
  • 37. AMERICAN JOURNAL OF BOTANY. VOLUME XVI, PLATE XXVIII. i ~~~~~~SHRE LIGH AN ROT This content downloaded on Wed, 2 Jan 2013 09:45:23 AM All use subject to JSTOR Terms and Conditions
  • 38. AMERICAN JOURNALOF BOTANY. VOLUMEXVI, PLATE XXIX. .. .... ~~~S HILY:LGTN GOT This content downloaded on Wed, 2 Jan 2013 09:45:23 AM All use subject to JSTOR Terms and Conditions
  • 39. AMERICAN JOURNAL OF BOTANY. VOLUME XVI, PLATE XXX. SHIRLEY: LIGHT AND GROWTH This content downloaded on Wed, 2 Jan 2013 09:45:23 AM All use subject to JSTOR Terms and Conditions
  • 40. AMERICANJOURNALOF BOTANY. VOLUMEXVI, PLATE XXXI. IImu~EY: LI GR SHIRLEY: LIGHT AND GROWTH This content downloaded on Wed, 2 Jan 2013 09:45:23 AM All use subject to JSTOR Terms and Conditions
  • 41. AMERICANJOURNALOF BOTANY. VOLUMEXVI, PLATE XXXII. q . _ _ ~~S~ I_ SHREY IGTAN ROT This content downloaded on Wed, 2 Jan 2013 09:45:23 AM All use subject to JSTOR Terms and Conditions
  • 42. May, I929] SHIRLEY -LIGHT AND GROWTH 389 21. Popp, H. W. Effect of light intensity on growth of soy beans and its relation to the autocatalyst theory of growth. Bot. Gaze 82: 306-3I9. I926. 22. - . A physiological study of the effect of light of various ranges of wave length on the growth of plants. Amer. Jour. Bot. I3: 706-736. i926. 23. Rose, E. Energie assimilatrice chez les plantes cultivees sans differents eclairement. Ann. Sci. Nat. Bot. IX, I7: I-II0. I9I3. 24. Salisbury, E. J. The oak-hornbeam woods of Hertfordshire. Jour. EcOl, 4: 83-117. I9I6; and 6: 14-52. I9I8. 25. Sayre, J. D. The developmentof chlorophyll in seedlings in different ranges of wave lengths of light. Plant Physiol. 3: 7I-77. I928. 26. Schertz, F. M. The quantitative determination of chlorophyll. Plant Physiol. 3: 323-334. 1928. 27. Shantz, H. L. Effects of artificial shading on plant growth in Louisiana. U. S. Dept. Agr. Bur. P1. Ind. Bull. 279. I9I3. 28. Toumey, J. W. Foundations of silviculture upon an ecological basis. New York, 1928. 29. Zillich, R. Uber den Lichtgenuss einiger Unkrauter und Kulturpflanzen. Fortsch. Landwirtschaft I: 46I-470. I926. EXPLANATION OF PLATES PLATEXXVI II FIG. I. The constant-condition room-showing method of illumination. FIG. 2. A greenhouse shade showing air inlet, spreader, atmometer, and thermometer. FIG. 3. An outside shade showing tile air inlet, atmometer, and thermopile. The front has been removed. PLATEXXIX FIG. 4. Redwood plants grown for 55 days on 12-hour days in constant-condition room. The figures above the plants show the light intensity in foot candles. FIG. 5. Redwood plant from the greenhouse shades, grown from March 27 to October 22, 1928. The figures on the pots show the light intensity in percentage of full sunlight. FIG. 6. Redwood plants grown in outside shades June I to Sept. 26, 1928. Figures on the pots show the light intensities in percentages of full summer sunlight. PLATEXXX FIG. 7. Sunflowers from constant-condition room grown for 48 days with I2 hours daily illumination. The figures on the pots are light intensities in foot-candles. FIG. 8. Sunflowers from greenhouse shades June 5 to August I3, I928. Figures on the pots represent light intensities in percentages of full summer sunlight. FIG. 9. Sunflowers from outside shades June 5 to August 20, I928. Figures on the pots represent light intensities in percentage of full summer sunlight. PLATEXXXI FIG. IO. Galinsoga plants grown in the constant-condition room for 35 days with I2 hours daily illumination. Figures on the pots show the light intensities in foot-candles. FIG, I I. Galinsogcaplants grown in greenhouse shades from June 5 to August 8, I928. Figures on the pots show the light intensities in percentages of full summer sunlight. FIG. 12. Galinsogaplants grown in outside shades from June I to July 6, I928. Figures on the pots show the light intensities in percentages of full summer sunlight. 27 This content downloaded on Wed, 2 Jan 2013 09:45:23 AM All use subject to JSTOR Terms and Conditions
  • 43. 390 AMERICAN JOURNAL OF BOTANY [Vol. i6, PLATEXXXI I FIG. I3. Geum plants grown in constant-condition room, for 54 days with I2 hours daily illumination. Figures on the picture show the light intensities in foot-candles. FIG. 14. Sunflower plants grown in the spectral-house shades from June 5 to August 15, 1928. The Arabic figures on the pots show light intensities in percentages of outside sunlight. Roman numerals show the house number. FIG. IS. Geum plants grown in the spectral-house shades from July Io to October 24, 1928. Arabic figures show light intensities. Roman numerals show the house numbers. FIG. i6. Galinsoga plants grown in spectral-house shades from May 30 to July 5, I928. Arabic figures show light intensities. Roman nunmeralsshow house numbers. FIFTH INTERNATIONAL BOTANICAL CONGRESS: MOTIONS ON NOMENCLATURE Motions on the subject of nomenclature for consideration by the Congress should be in the hand of the Rapporteur general, Dr. John Briquet, before September30, I929. Motions must be presented in the form of additional articles (or amend- ments) to the Rules of 1905-I9io, drawn up in the form adopted in the International Code, and must be drafted as briefly as possible in Latin, English, French, German, or Italian. At least 0ooprinted copies must be presented. According to the decisions of the Brussels Congress, I910, only motions relating to new points which were not settled in 1905 and I910 can be presented. Motions which do not answer to these conditions shall only be discussed if the Cambridge Congress 1930 decides to take them into con- sideration. For further information about the programme of work for nomenclature, apply to the Rapporteur general, Dr. John Briquet, Conservatoire botani- que, Geneva (Switzerland).-F. T. BROOKS, Secretary, Cambridge, England. This content downloaded on Wed, 2 Jan 2013 09:45:23 AM All use subject to JSTOR Terms and Conditions