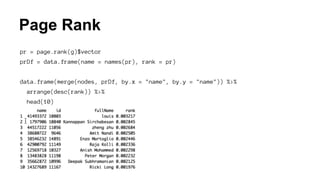
Download as PDF, PPTX


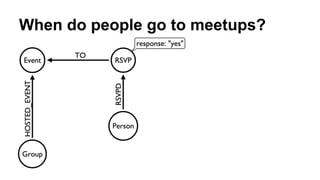
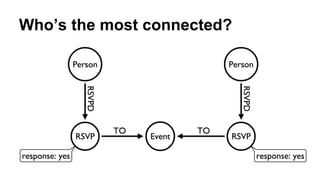
![When do people go to meetups?
(g:Group)-[:HOSTED_EVENT]->(event)<-[:TO]-
({response: 'yes'})<-[:RSVPD]-()](https://image.slidesharecdn.com/meetupanalyticswithrandneo4j-150202062940-conversion-gate02/85/Meetup-Analytics-with-R-and-Neo4j-12-320.jpg)
![When do people go to meetups?
MATCH (g:Group)-[:HOSTED_EVENT]->(event)<-[:TO]-
({response: 'yes'})<-[:RSVPD]-()
WHERE (event.time + event.utc_offset) < timestamp()
RETURN g.name,
event.time + event.utc_offset AS eventTime,
event.announced_at AS announcedAt,
event.name,
COUNT(*) AS rsvps](https://image.slidesharecdn.com/meetupanalyticswithrandneo4j-150202062940-conversion-gate02/85/Meetup-Analytics-with-R-and-Neo4j-13-320.jpg)
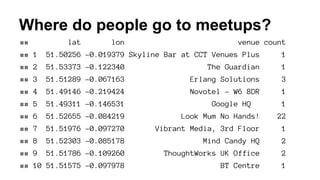
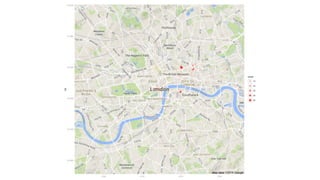
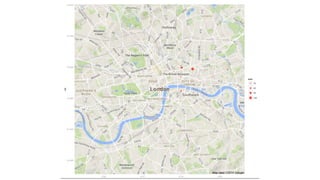
![Where do people go to meetups?
(g:Group)-[:HOSTED_EVENT]->(event)<-[:TO]-
({response: 'yes'})<-[:RSVPD]-(),
(event)-[:HELD_AT]->(venue)](https://image.slidesharecdn.com/meetupanalyticswithrandneo4j-150202062940-conversion-gate02/85/Meetup-Analytics-with-R-and-Neo4j-22-320.jpg)
![Where do people go to meetups?
MATCH (g:Group)-[:HOSTED_EVENT]->(event)<-[:TO]-
({response: 'yes'})<-[:RSVPD]-(), (event)-[:HELD_AT]->(venue)
WHERE (event.time + event.utc_offset) < timestamp()
RETURN g.name,
event.time + event.utc_offset AS eventTime,
event.announced_at AS announcedAt,
event.name,
venue.name AS venue,
venue.lat AS lat,
venue.lon AS lon,
COUNT(*) AS rsvps](https://image.slidesharecdn.com/meetupanalyticswithrandneo4j-150202062940-conversion-gate02/85/Meetup-Analytics-with-R-and-Neo4j-23-320.jpg)
![Where do people go to meetups?
MATCH (g:Group)-[:HOSTED_EVENT]->(event)<-[:TO]-
({response: 'yes'})<-[:RSVPD]-(), (event)-[:HELD_AT]->(venue)
WHERE (event.time + event.utc_offset) < timestamp()
RETURN g.name,
event.time + event.utc_offset AS eventTime,
event.announced_at AS announcedAt,
event.name,
venue.name AS venue,
venue.lat AS lat,
venue.lon AS lon,
COUNT(*) AS rsvps](https://image.slidesharecdn.com/meetupanalyticswithrandneo4j-150202062940-conversion-gate02/85/Meetup-Analytics-with-R-and-Neo4j-24-320.jpg)
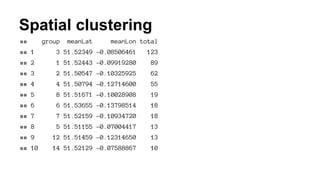
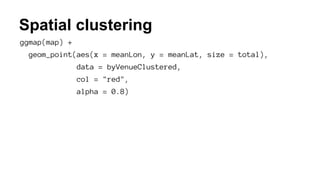
![byVenue %>%
filter(group == byVenueClustered$group[1])
What’s going on in Shoreditch?](https://image.slidesharecdn.com/meetupanalyticswithrandneo4j-150202062940-conversion-gate02/85/Meetup-Analytics-with-R-and-Neo4j-33-320.jpg)
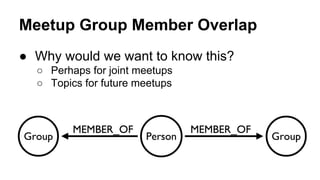
![Extracting the data
MATCH (group1:Group), (group2:Group)
WHERE group1 <> group2
OPTIONAL MATCH p =
(group1)<-[:MEMBER_OF]-()-[:MEMBER_OF]->(group2)
WITH group1, group2, COLLECT(p) AS paths
RETURN group1.name, group2.name,
LENGTH(paths) as commonMembers
ORDER BY group1.name, group2.name](https://image.slidesharecdn.com/meetupanalyticswithrandneo4j-150202062940-conversion-gate02/85/Meetup-Analytics-with-R-and-Neo4j-35-320.jpg)
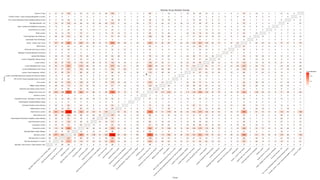
![MATCH (group1:Group), (group2:Group)
WHERE group1 <> group2
OPTIONAL MATCH (group1)<-[:MEMBER_OF]-(member)
WITH group1, group2, COLLECT(member) AS group1Members
WITH group1, group2, group1Members,
LENGTH(group1Members) AS numberOfGroup1Members
UNWIND group1Members AS member
OPTIONAL MATCH path = (member)-[:MEMBER_OF]->(group2)
WITH group1, group2, COLLECT(path) AS paths, numberOfGroup1Members
WITH group1, group2, LENGTH(paths) as commonMembers, numberOfGroup1Members
RETURN group1.name, group2.name,
toInt(round(100.0 * commonMembers / numberOfGroup1Members)) AS percentage
ORDER BY group1.name, group1.name
Finding overlap as a percentage](https://image.slidesharecdn.com/meetupanalyticswithrandneo4j-150202062940-conversion-gate02/85/Meetup-Analytics-with-R-and-Neo4j-37-320.jpg)
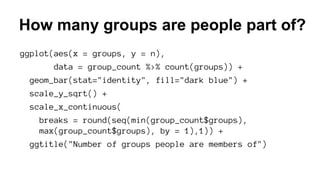
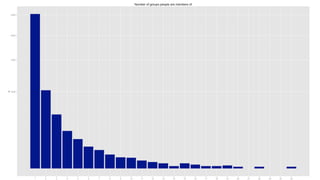
![How many groups are people part of?
MATCH (p:MeetupProfile)-[:MEMBER_OF]->()
RETURN ID(p), COUNT(*) AS groups
ORDER BY groups DESC](https://image.slidesharecdn.com/meetupanalyticswithrandneo4j-150202062940-conversion-gate02/85/Meetup-Analytics-with-R-and-Neo4j-39-320.jpg)
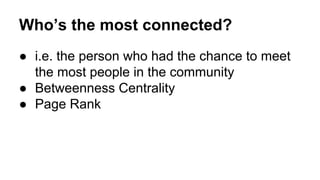
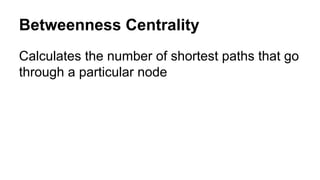
![Betweenness Centrality
library(igraph)
nodes_query = "MATCH (p:MeetupProfile)-[:RSVPD]->({response: 'yes'})-[:TO]->(event)
RETURN DISTINCT ID(p) AS id, p.id AS name, p.name AS fullName"
nodes = cypher(graph, nodes_query)
edges_query = "MATCH (p:MeetupProfile)-[:RSVPD]->({response: 'yes'})-[:TO]->(event),
(event)<-[:TO]-({response:'yes'})<-[:RSVPD]-(other)
RETURN ID(p) AS source, ID(other) AS target, COUNT(*) AS weight"
edges = cypher(graph, edges_query)
g = graph.data.frame(edges, directed = T, nodes)
bwGraph = betweenness(g)
bwDf = data.frame(id = names(bwGraph), score = bwGraph)](https://image.slidesharecdn.com/meetupanalyticswithrandneo4j-150202062940-conversion-gate02/85/Meetup-Analytics-with-R-and-Neo4j-45-320.jpg)

![Blending back into the graph
query = "MATCH (p:MeetupProfile {id: {id}}) SET p.betweenness = {score}"
tx = newTransaction(graph)
for(i in 1:nrow(bwDf)) {
if(i %% 1000 == 0) {
commit(tx)
print(paste("Batch", i / 1000, "committed."))
tx = newTransaction(graph)
}
id = bwDf[i, "id"]
score = bwDf[i, "score"]
appendCypher(tx, query, id = id, score = as.double(score))
}
commit(tx)](https://image.slidesharecdn.com/meetupanalyticswithrandneo4j-150202062940-conversion-gate02/85/Meetup-Analytics-with-R-and-Neo4j-50-320.jpg)
![Blending back into the graph
query = "MATCH (p:MeetupProfile {id: {id}}) SET p.pageRank = {score}"
tx = newTransaction(graph)
for(i in 1:nrow(prDf)) {
if(i %% 1000 == 0) {
commit(tx)
print(paste("Batch", i / 1000, "committed."))
tx = newTransaction(graph)
}
name = prDf[i, "name"]
rank = prDf[i, "rank"]
appendCypher(tx, query, id = name, score = as.double(rank))
}
commit(tx)](https://image.slidesharecdn.com/meetupanalyticswithrandneo4j-150202062940-conversion-gate02/85/Meetup-Analytics-with-R-and-Neo4j-51-320.jpg)
![Are they in the Neo4j group?
MATCH (p:MeetupProfile)
WITH p
ORDER BY p.pageRank DESC
LIMIT 20
OPTIONAL MATCH member = (p)-[m:MEMBER_OF]->(g:Group)
WHERE group.name = "Neo4j - London User Group"
RETURN p.name, p.id, p.pageRank, NOT m is null AS isMember
ORDER BY p.pageRank DESC](https://image.slidesharecdn.com/meetupanalyticswithrandneo4j-150202062940-conversion-gate02/85/Meetup-Analytics-with-R-and-Neo4j-52-320.jpg)
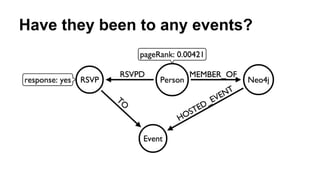
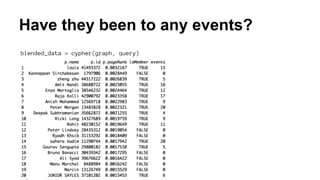
![Have they been to any events?
MATCH (p:MeetupProfile)
WITH p
ORDER BY p.pageRank DESC
LIMIT 20
OPTIONAL MATCH member = (p)-[m:MEMBER_OF]->(g:Group)
WHERE g.name = "Neo4j - London User Group"
WITH p, NOT m is null AS isMember, g
OPTIONAL MATCH event= (p)-[:RSVPD]-({response:'yes'})-[:TO]->()<-[:HOSTED_EVENT]-(g)
WITH p, isMember, COLLECT(event) as events
RETURN p.name, p.id, p.pageRank, isMember, LENGTH(events) AS events
ORDER BY p.pageRank DESC](https://image.slidesharecdn.com/meetupanalyticswithrandneo4j-150202062940-conversion-gate02/85/Meetup-Analytics-with-R-and-Neo4j-55-320.jpg)

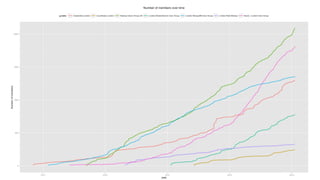

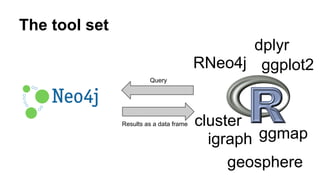
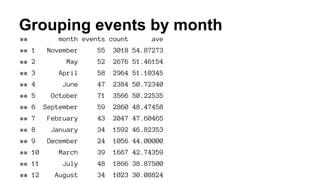
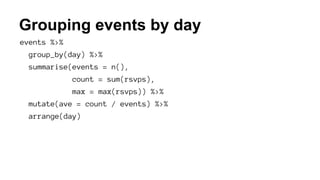
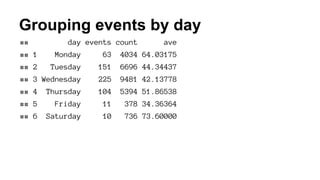
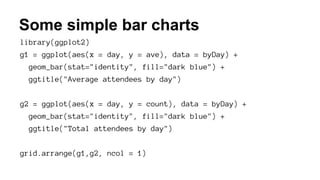
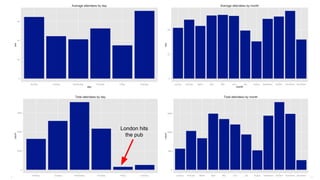
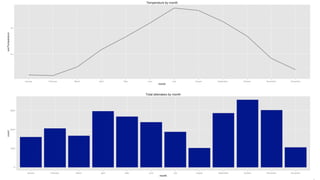
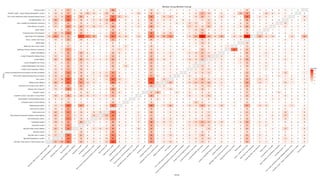
The document outlines an analysis of NoSQL meetups in London using R, focusing on the data gathered from events, attendees, and venues. It explores various questions such as attendance patterns, common interests among members, and member overlap between groups, supported by data visualization tools like ggplot2 and dplyr. The findings include insights on event attendance by day, common venues, and the identification of key individuals within the community based on centrality measures and rankings.