USENIX ATC 2017 Performance Superpowers with Enhanced BPF

Talk for USENIX ATC 2017 by Brendan Gregg "The Berkeley Packet Filter (BPF) in Linux has been enhanced in very recent versions to do much more than just filter packets, and has become a hot area of operating systems innovation, with much more yet to be discovered. BPF is a sandboxed virtual machine that runs user-level defined programs in kernel context, and is part of many kernels. The Linux enhancements allow it to run custom programs on other events, including kernel- and user-level dynamic tracing (kprobes and uprobes), static tracing (tracepoints), and hardware events. This is finding uses for the generation of new performance analysis tools, network acceleration technologies, and security intrusion detection systems. This talk will explain the BPF enhancements, then discuss the new performance observability tools that are in use and being created, especially from the BPF compiler collection (bcc) open source project. These tools provide new insights for file system and storage performance, CPU scheduler performance, TCP performance, and much more. This is a major turning point for Linux systems engineering, as custom advanced performance instrumentation can be used safely in production environments, powering a new generation of tools and visualizations. Because these BPF enhancements are only in very recent Linux (such as Linux 4.9), most companies are not yet running new enough kernels to be exploring BPF yet. This will change in the next year or two, as companies including Netflix upgrade their kernels. This talk will give you a head start on this growing technology, and also discuss areas of future work and unsolved problems."

Recommended
Recommended
More Related Content
What's hot
What's hot (20)
Similar to USENIX ATC 2017 Performance Superpowers with Enhanced BPF
Similar to USENIX ATC 2017 Performance Superpowers with Enhanced BPF (20)
More from Brendan Gregg
More from Brendan Gregg (16)
Recently uploaded
Recently uploaded (20)
USENIX ATC 2017 Performance Superpowers with Enhanced BPF
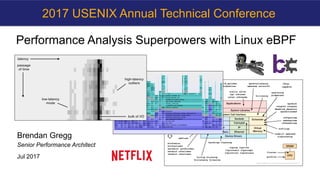
- 1. Performance Analysis Superpowers with Linux eBPF Brendan Gregg Senior Performance Architect Jul 2017 2017 USENIX Annual Technical Conference
- 3. Efficiently trace TCP sessions with PID, bytes, and dura:on using tcplife # /usr/share/bcc/tools/tcplife PID COMM LADDR LPORT RADDR RPORT TX_KB RX_KB MS 2509 java 100.82.34.63 8078 100.82.130.159 12410 0 0 5.44 2509 java 100.82.34.63 8078 100.82.78.215 55564 0 0 135.32 2509 java 100.82.34.63 60778 100.82.207.252 7001 0 13 15126.87 2509 java 100.82.34.63 38884 100.82.208.178 7001 0 0 15568.25 2509 java 127.0.0.1 4243 127.0.0.1 42166 0 0 0.61 2509 java 127.0.0.1 42166 127.0.0.1 4243 0 0 0.67 12030 upload-mes 127.0.0.1 34020 127.0.0.1 8078 11 0 3.38 2509 java 127.0.0.1 8078 127.0.0.1 34020 0 11 3.41 12030 upload-mes 127.0.0.1 21196 127.0.0.1 7101 0 0 12.61 3964 mesos-slav 127.0.0.1 7101 127.0.0.1 21196 0 0 12.64 12021 upload-sys 127.0.0.1 34022 127.0.0.1 8078 372 0 15.28 2509 java 127.0.0.1 8078 127.0.0.1 34022 0 372 15.31 2235 dockerd 100.82.34.63 13730 100.82.136.233 7002 0 4 18.50 2235 dockerd 100.82.34.63 34314 100.82.64.53 7002 0 8 56.73 12068 titus-reap 127.0.0.1 46476 127.0.0.1 19609 0 0 1.25 [...]
- 6. Take aways 1. Understand Linux tracing components 2. Understand the role and state of enhanced BPF 3. Discover opportuni?es for future development
- 10. Ye Olde BPF Berkeley Packet Filter # tcpdump host 127.0.0.1 and port 22 -d (000) ldh [12] (001) jeq #0x800 jt 2 jf 18 (002) ld [26] (003) jeq #0x7f000001 jt 6 jf 4 (004) ld [30] (005) jeq #0x7f000001 jt 6 jf 18 (006) ldb [23] (007) jeq #0x84 jt 10 jf 8 (008) jeq #0x6 jt 10 jf 9 (009) jeq #0x11 jt 10 jf 18 (010) ldh [20] (011) jset #0x1fff jt 18 jf 12 (012) ldxb 4*([14]&0xf) (013) ldh [x + 14] [...] User-defined bytecode executed by an in-kernel sandboxed virtual machine Steven McCanne and Van Jacobson, 1993 2 x 32-bit registers & scratch memory Op?mizes packet filter performance
- 13. Dynamic Tracing
- 17. A Linux Tracing Timeline - 1990’s: Sta?c tracers, prototype dynamic tracers - 2000: LTT + DProbes (dynamic tracing; not integrated) - 2004: kprobes (2.6.9) - 2005: DTrace (not Linux), SystemTap (out-of-tree) - 2008: Rrace (2.6.27) - 2009: perf_events (2.6.31) - 2009: tracepoints (2.6.32) - 2010-2016: Rrace & perf_events enhancements - 2012: uprobes (3.5) - 2014-2017: enhanced BPF patches: suppor:ng tracing events - 2016-2017: Rrace hist triggers also: LTTng, ktap, sysdig, ...
- 19. bcc • BPF Compiler Collec?on – hbps://github.com/iovisor/bcc – Lead developer: Brenden Blanco • Includes tracing tools • Provides BPF front-ends: – Python – Lua – C++ – C helper libraries – golang (gobpf) BPF Python Events Kernel lua bcc front-ends bcc tool bcc tool … … user kernel Tracing layers:
- 26. Pre-BPF: Linux Perf Analysis in 60s 1. uptime 2. dmesg -T | tail 3. vmstat 1 4. mpstat -P ALL 1 5. pidstat 1 6. iostat -xz 1 7. free -m 8. sar -n DEV 1 9. sar -n TCP,ETCP 1 10. top hbp://techblog.neNlix.com/2015/11/linux-performance-analysis-in-60s.html
- 27. bcc Installa?on • hbps://github.com/iovisor/bcc/blob/master/INSTALL.md • eg, Ubuntu Xenial: – Also available as an Ubuntu snap – Ubuntu 16.04 is good, 16.10 beber: more tools work • Installs many tools – In /usr/share/bcc/tools, and …/tools/old for older kernels # echo "deb [trusted=yes] https://repo.iovisor.org/apt/xenial xenial-nightly main" | sudo tee /etc/apt/sources.list.d/iovisor.list # sudo apt-get update # sudo apt-get install bcc-tools
- 28. bcc General Performance Checklist 1. execsnoop 2. opensnoop 3. ext4slower (…) 4. biolatency 5. biosnoop 6. cachestat 7. tcpconnect 8. tcpaccept 9. tcpretrans 10. gethostlatency 11. runqlat 12. profile
- 29. Discover short-lived process issues using execsnoop # execsnoop -t TIME(s) PCOMM PID PPID RET ARGS 0.031 dirname 23832 23808 0 /usr/bin/dirname /apps/tomcat/bin/catalina.sh 0.888 run 23833 2344 0 ./run 0.889 run 23833 2344 -2 /command/bash 0.889 run 23833 2344 -2 /usr/local/bin/bash 0.889 run 23833 2344 -2 /usr/local/sbin/bash 0.889 bash 23833 2344 0 /bin/bash 0.894 svstat 23835 23834 0 /command/svstat /service/nflx-httpd 0.894 perl 23836 23834 0 /usr/bin/perl -e $l=<>;$l=~/(d+) sec/;print $1||0; 0.899 ps 23838 23837 0 /bin/ps --ppid 1 -o pid,cmd,args 0.900 grep 23839 23837 0 /bin/grep org.apache.catalina 0.900 sed 23840 23837 0 /bin/sed s/^ *//; 0.900 cut 23841 23837 0 /usr/bin/cut -d -f 1 0.901 xargs 23842 23837 0 /usr/bin/xargs 0.912 xargs 23843 23842 -2 /command/echo 0.912 xargs 23843 23842 -2 /usr/local/bin/echo 0.912 xargs 23843 23842 -2 /usr/local/sbin/echo 0.912 echo 23843 23842 0 /bin/echo [...] Efficient: only traces exec()
- 30. Discover short-lived process issues using execsnoop # execsnoop -t TIME(s) PCOMM PID PPID RET ARGS 0.031 dirname 23832 23808 0 /usr/bin/dirname /apps/tomcat/bin/catalina.sh 0.888 run 23833 2344 0 ./run 0.889 run 23833 2344 -2 /command/bash 0.889 run 23833 2344 -2 /usr/local/bin/bash 0.889 run 23833 2344 -2 /usr/local/sbin/bash 0.889 bash 23833 2344 0 /bin/bash 0.894 svstat 23835 23834 0 /command/svstat /service/nflx-httpd 0.894 perl 23836 23834 0 /usr/bin/perl -e $l=<>;$l=~/(d+) sec/;print $1||0; 0.899 ps 23838 23837 0 /bin/ps --ppid 1 -o pid,cmd,args 0.900 grep 23839 23837 0 /bin/grep org.apache.catalina 0.900 sed 23840 23837 0 /bin/sed s/^ *//; 0.900 cut 23841 23837 0 /usr/bin/cut -d -f 1 0.901 xargs 23842 23837 0 /usr/bin/xargs 0.912 xargs 23843 23842 -2 /command/echo 0.912 xargs 23843 23842 -2 /usr/local/bin/echo 0.912 xargs 23843 23842 -2 /usr/local/sbin/echo 0.912 echo 23843 23842 0 /bin/echo [...] Efficient: only traces exec()
- 31. Exonerate or confirm storage latency issues and outliers with ext4slower # /usr/share/bcc/tools/ext4slower 1 Tracing ext4 operations slower than 1 ms TIME COMM PID T BYTES OFF_KB LAT(ms) FILENAME 17:31:42 postdrop 15523 S 0 0 2.32 5630D406E4 17:31:42 cleanup 15524 S 0 0 1.89 57BB7406EC 17:32:09 titus-log-ship 19735 S 0 0 1.94 slurper_checkpoint.db 17:35:37 dhclient 1061 S 0 0 3.32 dhclient.eth0.leases 17:35:39 systemd-journa 504 S 0 0 26.62 system.journal 17:35:39 systemd-journa 504 S 0 0 1.56 system.journal 17:35:39 systemd-journa 504 S 0 0 1.73 system.journal 17:35:45 postdrop 16187 S 0 0 2.41 C0369406E4 17:35:45 cleanup 16188 S 0 0 6.52 C1B90406EC […] Tracing at the file system is a more reliable and complete indicator than measuring disk I/O latency Also: btrfsslower, xfsslower, zfsslower
- 32. Exonerate or confirm storage latency issues and outliers with ext4slower # /usr/share/bcc/tools/ext4slower 1 Tracing ext4 operations slower than 1 ms TIME COMM PID T BYTES OFF_KB LAT(ms) FILENAME 17:31:42 postdrop 15523 S 0 0 2.32 5630D406E4 17:31:42 cleanup 15524 S 0 0 1.89 57BB7406EC 17:32:09 titus-log-ship 19735 S 0 0 1.94 slurper_checkpoint.db 17:35:37 dhclient 1061 S 0 0 3.32 dhclient.eth0.leases 17:35:39 systemd-journa 504 S 0 0 26.62 system.journal 17:35:39 systemd-journa 504 S 0 0 1.56 system.journal 17:35:39 systemd-journa 504 S 0 0 1.73 system.journal 17:35:45 postdrop 16187 S 0 0 2.41 C0369406E4 17:35:45 cleanup 16188 S 0 0 6.52 C1B90406EC […] Tracing at the file system is a more reliable and complete indicator than measuring disk I/O latency Also: btrfsslower, xfsslower, zfsslower
- 33. Iden:fy mul:modal disk I/O latency and outliers with biolatency # biolatency -mT 10 Tracing block device I/O... Hit Ctrl-C to end. 19:19:04 msecs : count distribution 0 -> 1 : 238 |********* | 2 -> 3 : 424 |***************** | 4 -> 7 : 834 |********************************* | 8 -> 15 : 506 |******************** | 16 -> 31 : 986 |****************************************| 32 -> 63 : 97 |*** | 64 -> 127 : 7 | | 128 -> 255 : 27 |* | 19:19:14 msecs : count distribution 0 -> 1 : 427 |******************* | 2 -> 3 : 424 |****************** | […] Average latency (iostat/sar) may not be represen??ve with mul?ple modes or outliers The "count" column is summarized in-kernel
- 34. Iden:fy mul:modal disk I/O latency and outliers with biolatency # biolatency -mT 10 Tracing block device I/O... Hit Ctrl-C to end. 19:19:04 msecs : count distribution 0 -> 1 : 238 |********* | 2 -> 3 : 424 |***************** | 4 -> 7 : 834 |********************************* | 8 -> 15 : 506 |******************** | 16 -> 31 : 986 |****************************************| 32 -> 63 : 97 |*** | 64 -> 127 : 7 | | 128 -> 255 : 27 |* | 19:19:14 msecs : count distribution 0 -> 1 : 427 |******************* | 2 -> 3 : 424 |****************** | […] Average latency (iostat/sar) may not be represen??ve with mul?ple modes or outliers The "count" column is summarized in-kernel
- 35. Efficiently trace TCP sessions with PID, bytes, and dura:on using tcplife # /usr/share/bcc/tools/tcplife PID COMM LADDR LPORT RADDR RPORT TX_KB RX_KB MS 2509 java 100.82.34.63 8078 100.82.130.159 12410 0 0 5.44 2509 java 100.82.34.63 8078 100.82.78.215 55564 0 0 135.32 2509 java 100.82.34.63 60778 100.82.207.252 7001 0 13 15126.87 2509 java 100.82.34.63 38884 100.82.208.178 7001 0 0 15568.25 2509 java 127.0.0.1 4243 127.0.0.1 42166 0 0 0.61 2509 java 127.0.0.1 42166 127.0.0.1 4243 0 0 0.67 12030 upload-mes 127.0.0.1 34020 127.0.0.1 8078 11 0 3.38 2509 java 127.0.0.1 8078 127.0.0.1 34020 0 11 3.41 12030 upload-mes 127.0.0.1 21196 127.0.0.1 7101 0 0 12.61 3964 mesos-slav 127.0.0.1 7101 127.0.0.1 21196 0 0 12.64 12021 upload-sys 127.0.0.1 34022 127.0.0.1 8078 372 0 15.28 2509 java 127.0.0.1 8078 127.0.0.1 34022 0 372 15.31 2235 dockerd 100.82.34.63 13730 100.82.136.233 7002 0 4 18.50 2235 dockerd 100.82.34.63 34314 100.82.64.53 7002 0 8 56.73 [...] Dynamic tracing of TCP set state only; does not trace send/receive Also see: tcpconnect, tcpaccept, tcpretrans
- 36. Efficiently trace TCP sessions with PID, bytes, and dura:on using tcplife # /usr/share/bcc/tools/tcplife PID COMM LADDR LPORT RADDR RPORT TX_KB RX_KB MS 2509 java 100.82.34.63 8078 100.82.130.159 12410 0 0 5.44 2509 java 100.82.34.63 8078 100.82.78.215 55564 0 0 135.32 2509 java 100.82.34.63 60778 100.82.207.252 7001 0 13 15126.87 2509 java 100.82.34.63 38884 100.82.208.178 7001 0 0 15568.25 2509 java 127.0.0.1 4243 127.0.0.1 42166 0 0 0.61 2509 java 127.0.0.1 42166 127.0.0.1 4243 0 0 0.67 12030 upload-mes 127.0.0.1 34020 127.0.0.1 8078 11 0 3.38 2509 java 127.0.0.1 8078 127.0.0.1 34020 0 11 3.41 12030 upload-mes 127.0.0.1 21196 127.0.0.1 7101 0 0 12.61 3964 mesos-slav 127.0.0.1 7101 127.0.0.1 21196 0 0 12.64 12021 upload-sys 127.0.0.1 34022 127.0.0.1 8078 372 0 15.28 2509 java 127.0.0.1 8078 127.0.0.1 34022 0 372 15.31 2235 dockerd 100.82.34.63 13730 100.82.136.233 7002 0 4 18.50 2235 dockerd 100.82.34.63 34314 100.82.64.53 7002 0 8 56.73 [...] Dynamic tracing of TCP set state only; does not trace send/receive Also see: tcpconnect, tcpaccept, tcpretrans
- 37. Iden:fy DNS latency issues system wide with gethostlatency # /usr/share/bcc/tools/gethostlatency TIME PID COMM LATms HOST 18:56:36 5055 mesos-slave 0.01 100.82.166.217 18:56:40 5590 java 3.53 ec2-…-79.compute-1.amazonaws.com 18:56:51 5055 mesos-slave 0.01 100.82.166.217 18:56:53 30166 ncat 0.21 localhost 18:56:56 6661 java 2.19 atlas-alert-….prod.netflix.net 18:56:59 5589 java 1.50 ec2-…-207.compute-1.amazonaws.com 18:57:03 5370 java 0.04 localhost 18:57:03 30259 sudo 0.07 titusagent-mainvpc-m…3465 18:57:06 5055 mesos-slave 0.01 100.82.166.217 18:57:10 5590 java 3.10 ec2-…-79.compute-1.amazonaws.com 18:57:21 5055 mesos-slave 0.01 100.82.166.217 18:57:29 5589 java 52.36 ec2-…-207.compute-1.amazonaws.com 18:57:36 5055 mesos-slave 0.01 100.82.166.217 18:57:40 5590 java 1.83 ec2-…-79.compute-1.amazonaws.com 18:57:51 5055 mesos-slave 0.01 100.82.166.217 […] Instruments using user-level dynamic tracing of getaddrinfo(), gethostbyname(), etc.
- 38. Iden:fy DNS latency issues system wide with gethostlatency # /usr/share/bcc/tools/gethostlatency TIME PID COMM LATms HOST 18:56:36 5055 mesos-slave 0.01 100.82.166.217 18:56:40 5590 java 3.53 ec2-…-79.compute-1.amazonaws.com 18:56:51 5055 mesos-slave 0.01 100.82.166.217 18:56:53 30166 ncat 0.21 localhost 18:56:56 6661 java 2.19 atlas-alert-….prod.netflix.net 18:56:59 5589 java 1.50 ec2-…-207.compute-1.amazonaws.com 18:57:03 5370 java 0.04 localhost 18:57:03 30259 sudo 0.07 titusagent-mainvpc-m…3465 18:57:06 5055 mesos-slave 0.01 100.82.166.217 18:57:10 5590 java 3.10 ec2-…-79.compute-1.amazonaws.com 18:57:21 5055 mesos-slave 0.01 100.82.166.217 18:57:29 5589 java 52.36 ec2-…-207.compute-1.amazonaws.com 18:57:36 5055 mesos-slave 0.01 100.82.166.217 18:57:40 5590 java 1.83 ec2-…-79.compute-1.amazonaws.com 18:57:51 5055 mesos-slave 0.01 100.82.166.217 […] Instruments using user-level dynamic tracing of getaddrinfo(), gethostbyname(), etc.
- 39. Examine CPU scheduler run queue latency as a histogram with runqlat # /usr/share/bcc/tools/runqlat 10 Tracing run queue latency... Hit Ctrl-C to end. usecs : count distribution 0 -> 1 : 2810 |* | 2 -> 3 : 5248 |** | 4 -> 7 : 12369 |****** | 8 -> 15 : 71312 |****************************************| 16 -> 31 : 55705 |******************************* | 32 -> 63 : 11775 |****** | 64 -> 127 : 6230 |*** | 128 -> 255 : 2758 |* | 256 -> 511 : 549 | | 512 -> 1023 : 46 | | 1024 -> 2047 : 11 | | 2048 -> 4095 : 4 | | 4096 -> 8191 : 5 | | […] As efficient as possible: scheduler calls can become frequent
- 40. Examine CPU scheduler run queue latency as a histogram with runqlat # /usr/share/bcc/tools/runqlat 10 Tracing run queue latency... Hit Ctrl-C to end. usecs : count distribution 0 -> 1 : 2810 |* | 2 -> 3 : 5248 |** | 4 -> 7 : 12369 |****** | 8 -> 15 : 71312 |****************************************| 16 -> 31 : 55705 |******************************* | 32 -> 63 : 11775 |****** | 64 -> 127 : 6230 |*** | 128 -> 255 : 2758 |* | 256 -> 511 : 549 | | 512 -> 1023 : 46 | | 1024 -> 2047 : 11 | | 2048 -> 4095 : 4 | | 4096 -> 8191 : 5 | | […] As efficient as possible: scheduler calls can become frequent
- 41. Advanced Analysis • Find/draw a func?onal diagram • Apply performance methods hbp://www.brendangregg.com/methodology.html 1. Workload Characteriza?on 2. Latency Analysis 3. USE Method • Start with the Q's, then find the A's • Use mul?-tools: – funccount, trace, argdist, stackcount e.g., storage I/O subsystem:
- 42. Construct programma:c one-liners with trace # trace 'sys_read (arg3 > 20000) "read %d bytes", arg3' TIME PID COMM FUNC - 05:18:23 4490 dd sys_read read 1048576 bytes 05:18:23 4490 dd sys_read read 1048576 bytes 05:18:23 4490 dd sys_read read 1048576 bytes ^C argdist by Sasha Goldshtein # trace -h [...] trace –K blk_account_io_start Trace this kernel function, and print info with a kernel stack trace trace 'do_sys_open "%s", arg2' Trace the open syscall and print the filename being opened trace 'sys_read (arg3 > 20000) "read %d bytes", arg3' Trace the read syscall and print a message for reads >20000 bytes trace r::do_sys_return Trace the return from the open syscall trace 'c:open (arg2 == 42) "%s %d", arg1, arg2' Trace the open() call from libc only if the flags (arg2) argument is 42 [...] e.g. reads over 20000 bytes:
- 43. Create in-kernel summaries with argdist # argdist -H 'p::tcp_cleanup_rbuf(struct sock *sk, int copied):int:copied' [15:34:45] copied : count distribution 0 -> 1 : 15088 |********************************** | 2 -> 3 : 0 | | 4 -> 7 : 0 | | 8 -> 15 : 0 | | 16 -> 31 : 0 | | 32 -> 63 : 0 | | 64 -> 127 : 4786 |*********** | 128 -> 255 : 1 | | 256 -> 511 : 1 | | 512 -> 1023 : 4 | | 1024 -> 2047 : 11 | | 2048 -> 4095 : 5 | | 4096 -> 8191 : 27 | | 8192 -> 16383 : 105 | | 16384 -> 32767 : 0 | | argdist by Sasha Goldshtein e.g. histogram of tcp_cleanup_rbuf() copied:
- 45. BPF metrics and analysis can be automated in GUIs Flame Graphs Heat Maps Tracing Reports … Eg, NeNlix Vector (self-service UI): Should be open sourced; you may also build/buy your own
- 49. FUTURE WORK BPF
- 50. BCC Improvements Challenges: • Ini?alize all variables • Extra bpf_probe_read()s • BPF_PERF_OUTPUT() • Verifier errors
- 51. Higher-level Language • bcc's Python/C interface is ok, but verbose • Alternate higher-level language front end? – New front-ends can use exis?ng libbcc, and can be added as part of bcc itself – Whave a problem in search of a new language (instead of the other way around)
- 52. ply • A new BPF-based language and tracer for Linux – Created by Tobias Waldekranz – hbps://github.com/iovisor/ply hbps://wkz.github.io/ply/ • High-level language – Simple one-liners – Short scripts • In development (?) – kprobes and tracepoints only, uprobes/perf_events not yet – Successful so far as a proof of concept – Not produc?on tested yet (bcc is)
- 53. File opens can be traced using a short ply one-liner # ply -c 'kprobe:do_sys_open { printf("opened: %sn", mem(arg(1), "128s")); }' 1 probe active opened: /sys/kernel/debug/tracing/events/enable opened: /etc/ld.so.cache opened: /lib/x86_64-linux-gnu/libselinux.so.1 opened: /lib/x86_64-linux-gnu/libc.so.6 opened: /lib/x86_64-linux-gnu/libpcre.so.3 opened: /lib/x86_64-linux-gnu/libdl.so.2 opened: /lib/x86_64-linux-gnu/libpthread.so.0 opened: /proc/filesystems opened: /usr/lib/locale/locale-archive opened: . [...]
- 54. ply programs are concise, such as measuring read latency # ply -A -c 'kprobe:SyS_read { @start[tid()] = nsecs(); } kretprobe:SyS_read /@start[tid()]/ { @ns.quantize(nsecs() - @start[tid()]); @start[tid()] = nil; }' 2 probes active ^Cde-activating probes [...] @ns: [ 512, 1k) 3 |######## | [ 1k, 2k) 7 |################### | [ 2k, 4k) 12 |################################| [ 4k, 8k) 3 |######## | [ 8k, 16k) 2 |##### | [ 16k, 32k) 0 | | [ 32k, 64k) 0 | | [ 64k, 128k) 3 |######## | [128k, 256k) 1 |### | [256k, 512k) 1 |### | [512k, 1M) 2 |##### | [...]
- 57. Case Studies • Use it • Solve something • Write about it • Talk about it
- 58. Take aways 1. Understand Linux tracing components 2. Understand the role and state of enhanced BPF 3. Discover opportuni?es for future development BPF Tracing in Linux • 3.19: sockets • 3.19: maps • 4.1: kprobes • 4.3: uprobes • 4.4: BPF output • 4.6: stacks • 4.7: tracepoints • 4.9: profiling • 4.9: PMCs Please contribute: - hbps://github.com/ iovisor/bcc - hbps://github.com/ iovisor/ply
- 59. Links & References iovisor bcc: - hbps://github.com/iovisor/bcc hbps://github.com/iovisor/bcc/tree/master/docs - hbp://www.brendangregg.com/blog/ (search for "bcc") - hbp://www.brendangregg.com/ebpf.html#bcc - hbp://blogs.microsoR.co.il/sasha/2016/02/14/two-new-ebpf-tools-memleak-and-argdist/ - On designing tracing tools: hbps://www.youtube.com/watch?v=uibLwoVKjec bcc tutorial: - hbps://github.com/iovisor/bcc/blob/master/INSTALL.md - …/docs/tutorial.md - …/docs/tutorial_bcc_python_developer.md - …/docs/reference_guide.md - .../CONTRIBUTING-SCRIPTS.md ply: hbps://github.com/iovisor/ply BPF: - hbps://www.kernel.org/doc/Documenta?on/networking/filter.txt - hbps://github.com/iovisor/bpf-docs - hbps://suchakra.wordpress.com/tag/bpf/ Flame Graphs: - hbp://www.brendangregg.com/flamegraphs.html - hbp://www.brendangregg.com/blog/2016-01-20/ebpf-offcpu-flame-graph.html - hbp://www.brendangregg.com/blog/2016-02-01/linux-wakeup-offwake-profiling.html NeNlix Tech Blog on Vector: - hbp://techblog.neNlix.com/2015/04/introducing-vector-neNlixs-on-host.html Linux Performance: hbp://www.brendangregg.com/linuxperf.html
- 60. Thank You – Ques?ons? – iovisor bcc: hbps://github.com/iovisor/bcc – hbp://www.brendangregg.com – hbp://slideshare.net/brendangregg – bgregg@neNlix.com – @brendangregg Thanks to Alexei Starovoitov (Facebook), Brenden Blanco (PLUMgrid/VMware), Sasha Goldshtein (Sela), Daniel Borkmann (Cisco), Wang Nan (Huawei), and other BPF and bcc contributors! 2017 USENIX Annual Technical Conference