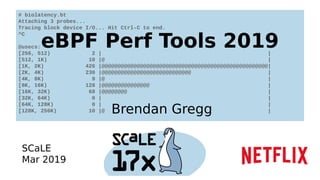
eBPF Perf Tools 2019
•
25 likes•8,421 views

eBPF Performance Tools 2019, by Brendan Gregg for SCaLE17x

Recommended
More Related Content
What's hot
What's hot (20)
Similar to eBPF Perf Tools 2019
Similar to eBPF Perf Tools 2019 (20)
More from Brendan Gregg
More from Brendan Gregg (19)
Recently uploaded
Recently uploaded (20)
eBPF Perf Tools 2019
- 1. # biolatency.bt Attaching 3 probes... Tracing block device I/O... Hit Ctrl-C to end. ^C @usecs: [256, 512) 2 | | [512, 1K) 10 |@ | [1K, 2K) 426 |@@@@@@@@@@@@@@@@@@@@@@@@@@@@@@@@@@@@@@@@@@@@@@@@@@@@| [2K, 4K) 230 |@@@@@@@@@@@@@@@@@@@@@@@@@@@@ | [4K, 8K) 9 |@ | [8K, 16K) 128 |@@@@@@@@@@@@@@@ | [16K, 32K) 68 |@@@@@@@@ | [32K, 64K) 0 | | [64K, 128K) 0 | | [128K, 256K) 10 |@ | eBPF Perf Tools 2019 Brendan Gregg SCaLE Mar 2019
- 2. LIVE DEMO eBPF Minecraft Analysis
- 3. Enhanced BPF Kernel kprobeskprobes uprobesuprobes tracepointstracepoints socketssockets SDN ConfigurationSDN Configuration User-Defined BPF Programs … Event TargetsRuntime also known as just "BPF" Linux 4.* perf_eventsperf_events BPF actions BPF actions BPFBPF verifierverifier DDoS MitigationDDoS Mitigation Intrusion DetectionIntrusion Detection Container SecurityContainer Security ObservabilityObservability Firewalls (bpfilter)Firewalls (bpfilter) Device DriversDevice Drivers
- 4. eBPF bcc Linux 4.4+ https://github.com/iovisor/bcc
- 5. eBPF bpftrace (aka BPFtrace) Linux 4.9+ https://github.com/iovisor/bpftrace # Files opened by process bpftrace -e 't:syscalls:sys_enter_open { printf("%s %sn", comm, str(args->filename)) }' # Read size distribution by process bpftrace -e 't:syscalls:sys_exit_read { @[comm] = hist(args->ret) }' # Count VFS calls bpftrace -e 'kprobe:vfs_* { @[func]++ }' # Show vfs_read latency as a histogram bpftrace -e 'k:vfs_read { @[tid] = nsecs } kr:vfs_read /@[tid]/ { @ns = hist(nsecs - @[tid]); delete(@tid) }’ # Trace user-level function Bpftrace -e 'uretprobe:bash:readline { printf(“%sn”, str(retval)) }’ …
- 6. eBPF is solving new things: off-CPU + wakeup analysis
- 7. Raw BPF samples/bpf/sock_example.c 87 lines truncated
- 9. bcc/BPF (C & Python) bcc examples/tracing/bitehist.py entire program
- 10. bpftrace https://github.com/iovisor/bpftrace entire program bpftrace -e 'kr:vfs_read { @ = hist(retval); }'
- 11. The Tracing Landscape, Mar 2019 Scope & Capability Easeofuse sysdig perf ftrace C/BPF stap Stage of Development (my opinion) (brutal)(lessbrutal) (alpha) (mature) bcc/BPF ply/BPF Raw BPF LTTng (hist triggers) recent changes (many) bpftrace (eBPF) (0.9)
- 12. e.g., identify multimodal disk I/O latency and outliers with bcc/eBPF biolatency # biolatency -mT 10 Tracing block device I/O... Hit Ctrl-C to end. 19:19:04 msecs : count distribution 0 -> 1 : 238 |********* | 2 -> 3 : 424 |***************** | 4 -> 7 : 834 |********************************* | 8 -> 15 : 506 |******************** | 16 -> 31 : 986 |****************************************| 32 -> 63 : 97 |*** | 64 -> 127 : 7 | | 128 -> 255 : 27 |* | 19:19:14 msecs : count distribution 0 -> 1 : 427 |******************* | 2 -> 3 : 424 |****************** | […]
- 13. bcc/eBPF programs can be laborious: biolatency # define BPF program bpf_text = """ #include <uapi/linux/ptrace.h> #include <linux/blkdev.h> typedef struct disk_key { char disk[DISK_NAME_LEN]; u64 slot; } disk_key_t; BPF_HASH(start, struct request *); STORAGE // time block I/O int trace_req_start(struct pt_regs *ctx, struct request *req) { u64 ts = bpf_ktime_get_ns(); start.update(&req, &ts); return 0; } // output int trace_req_completion(struct pt_regs *ctx, struct request *req) { u64 *tsp, delta; // fetch timestamp and calculate delta tsp = start.lookup(&req); if (tsp == 0) { return 0; // missed issue } delta = bpf_ktime_get_ns() - *tsp; FACTOR // store as histogram STORE start.delete(&req); return 0; } """ # code substitutions if args.milliseconds: bpf_text = bpf_text.replace('FACTOR', 'delta /= 1000000;') label = "msecs" else: bpf_text = bpf_text.replace('FACTOR', 'delta /= 1000;') label = "usecs" if args.disks: bpf_text = bpf_text.replace('STORAGE', 'BPF_HISTOGRAM(dist, disk_key_t);') bpf_text = bpf_text.replace('STORE', 'disk_key_t key = {.slot = bpf_log2l(delta)}; ' + 'void *__tmp = (void *)req->rq_disk->disk_name; ' + 'bpf_probe_read(&key.disk, sizeof(key.disk), __tmp); ' + 'dist.increment(key);') else: bpf_text = bpf_text.replace('STORAGE', 'BPF_HISTOGRAM(dist);') bpf_text = bpf_text.replace('STORE', 'dist.increment(bpf_log2l(delta));') if debug or args.ebpf: print(bpf_text) if args.ebpf: exit() # load BPF program b = BPF(text=bpf_text) if args.queued: b.attach_kprobe(event="blk_account_io_start", fn_name="trace_req_start") else: b.attach_kprobe(event="blk_start_request", fn_name="trace_req_start") b.attach_kprobe(event="blk_mq_start_request", fn_name="trace_req_start") b.attach_kprobe(event="blk_account_io_completion", fn_name="trace_req_completion") print("Tracing block device I/O... Hit Ctrl-C to end.") # output exiting = 0 if args.interval else 1 dist = b.get_table("dist") while (1): try: sleep(int(args.interval)) except KeyboardInterrupt: exiting = 1 print() if args.timestamp: print("%-8sn" % strftime("%H:%M:%S"), end="") dist.print_log2_hist(label, "disk") dist.clear() countdown -= 1 if exiting or countdown == 0: exit()
- 14. … rewritten in bpftrace (launched Oct 2018)! #!/usr/local/bin/bpftrace BEGIN { printf("Tracing block device I/O... Hit Ctrl-C to end.n"); } kprobe:blk_account_io_start { @start[arg0] = nsecs; } kprobe:blk_account_io_completion /@start[arg0]/ { @usecs = hist((nsecs - @start[arg0]) / 1000); delete(@start[arg0]); }
- 15. … rewritten in bpftrace # biolatency.bt Attaching 3 probes... Tracing block device I/O... Hit Ctrl-C to end. ^C @usecs: [256, 512) 2 | | [512, 1K) 10 |@ | [1K, 2K) 426 |@@@@@@@@@@@@@@@@@@@@@@@@@@@@@@@@@@@@@@@@@@@@@@@@@@@@| [2K, 4K) 230 |@@@@@@@@@@@@@@@@@@@@@@@@@@@@ | [4K, 8K) 9 |@ | [8K, 16K) 128 |@@@@@@@@@@@@@@@ | [16K, 32K) 68 |@@@@@@@@ | [32K, 64K) 0 | | [64K, 128K) 0 | | [128K, 256K) 10 |@ |
- 16. bcc canned complex tools, agents bpftrace one-liners, custom scripts
- 17. bcc
- 18. eBPF bcc Linux 4.4+ https://github.com/iovisor/bcc
- 19. bpftrace
- 20. eBPF bpftrace Linux 4.9+ https://github.com/iovisor/bcc
- 21. Major Features (v1) Known Bug Fixes Packaging API Stability Stable Docs Oct 2018 v0.90 Mar?2019 v1.0 ?2019Dec 2016 More Bug Fixes v0.80 Jan-2019 Minor Features (v1) ... bpftrace Development
- 22. bpftrace Syntax bpftrace -e ‘k:do_nanosleep /pid > 100/ { @[comm]++ }’ Probe Filter (optional) Action
- 23. Probes
- 24. Probe Type Shortcuts tracepoint t Kernel static tracepoints usdt U User-level statically defined tracing kprobe k Kernel function tracing kretprobe kr Kernel function returns uprobe u User-level function tracing uretprobe ur User-level function returns profile p Timed sampling across all CPUs interval i Interval output software s Kernel software events hardware h Processor hardware events
- 25. Filters ● /pid == 181/ ● /comm != “sshd”/ ● /@ts[tid]/
- 26. Actions ● Per-event output – printf() – system() – join() – time() ● Map Summaries – @ = count() or @++ – @ = hist() – … The following is in the https://github.com/iovisor/bpftrace/blob/master/docs/reference_guide.md
- 27. Functions ● hist(n) Log2 histogram ● lhist(n, min, max, step) Linear hist. ● count() Count events ● sum(n) Sum value ● min(n) Minimum value ● max(n) Maximum value ● avg(n) Average value ● stats(n) Statistics ● str(s) String ● sym(p) Resolve kernel addr ● usym(p) Resolve user addr ● kaddr(n) Resolve kernel symbol ● uaddr(n) Resolve user symbol ● printf(fmt, ...) Print formatted ● print(@x[, top[, div]]) Print map ● delete(@x) Delete map element ● clear(@x) Delete all keys/values ● reg(n) Register lookup ● join(a) Join string array ● time(fmt) Print formatted time ● system(fmt) Run shell command ● exit() Quit bpftrace
- 28. Variable Types ● Basic Variables – @global – @thread_local[tid] – $scratch ● Associative Arrays – @array[key] = value ● Buitins – pid – ...
- 29. Builtin Variables ● pid Process ID (kernel tgid) ● tid Thread ID (kernel pid) ● cgroup Current Cgroup ID ● uid User ID ● gid Group ID ● nsecs Nanosecond timestamp ● cpu Processor ID ● comm Process name ● stack Kernel stack trace ● ustack User stack trace ● arg0, arg1, ... Function arguments ● retval Return value ● func Function name ● probe Full name of the probe ● curtask Current task_struct (u64) ● rand Random number (u32)
- 30. biolatency (again) #!/usr/local/bin/bpftrace BEGIN { printf("Tracing block device I/O... Hit Ctrl-C to end.n"); } kprobe:blk_account_io_start { @start[arg0] = nsecs; } kprobe:blk_account_io_completion /@start[arg0]/ { @usecs = hist((nsecs - @start[arg0]) / 1000); delete(@start[arg0]); }
- 32. Issues ● All major capabilities exist ● Many minor things ● https://github.com/iovisor/bpftrace/issues
- 33. Other Tools
- 34. Netlfix Vector: BPF heat maps https://medium.com/netflix-techblog/extending-vector-with-ebpf-to-inspect-host-and-container-performance- 5da3af4c584b
- 35. Anticipated Worldwide Audience ● BPF Tool Developers: – Raw BPF: <20 – C (or C++) BPF: ~20 – bcc: >200 – bpftrace: >5,000 ● BPF Tool Users: – CLI tools (of any type): >20,000 – GUIs (fronting any type): >200,000
- 36. Other Tools ● kubectl-trace ● sysdig eBPF support
- 37. Take Aways Easily explore systems with bcc/bpftrace Contribute: see bcc/bpftrace issue list Share: posts, talks
- 38. URLs - https://github.com/iovisor/bcc - https://github.com/iovisor/bcc/blob/master/docs/tutorial.md - https://github.com/iovisor/bcc/blob/master/docs/reference_guide.md - https://github.com/iovisor/bpftrace - https://github.com/iovisor/bpftrace/blob/master/docs/tutorial_one_liners.md - https://github.com/iovisor/bpftrace/blob/master/docs/reference_guide.md
- 39. Thanks ● bpftrace – Alastair Robertson (creator) – Netflix: myself so for – Sthima: Matheus Marchini, Willian Gaspar – Facebook: Jon Haslam, Dan Xu – Augusto Mecking Caringi, Dale Hamel, ... ● eBPF/bcc – Facebook: Alexei Starovoitov, Teng Qin, Yonghong Song, Martin Lau, Mark Drayton, … – Netlfix: myself – VMware: Brenden Blanco – Sasha Goldsthein, Paul Chaignon, ...