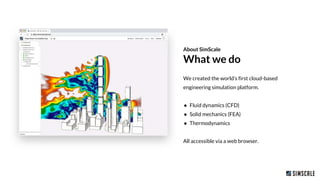
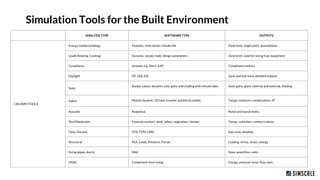
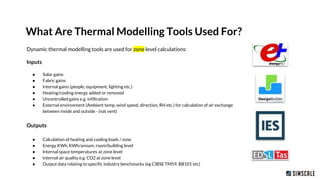
SimScale teams up with Greenlite, a provider of regulatory and building analysis services, to explore how cloud-based CFD software can be used by engineers and architects to quickly and accurately calculate wind pressure coefficients for projects in the built environment. Importing simulation files into IES and thermal modeling tools gives designers an extra advantage to evaluate ventilation and possible overheating.
2. We created the world’s first cloud-based
engineering simulation platform.
● Fluid dynamics (CFD)
● Solid mechanics (FEA)
● Thermodynamics
All accessible via a web browser.
About SimScale
What we do
3. Building physics and compliance consultancy.
● Thermal modelling
● Overheating risk analysis
● HVAC design and optimisation
● Part L, BREEAM, SAP, Passivhaus
We work with consultants, contractors, and
architects.
About Greenlite
What we do
4. Simulation Tools for the Built Environment
SimScale to IES (VE) for Building Simulation
5. Simulation Tools for the Built Environment
ANALYSIS TYPE SOFTWARE TYPE OUTPUTS
CAD/BIM TOOLS
Energy (whole building) Dynamic, time-series, climate file Zone level, single point, assumptions
Loads (heating, Cooling) Dynamic, steady state, design parameters Zone level, used for sizing hvac equipment
Compliance dynamic e.g. Part L (UK) Compliance metrics
Daylight DF, UDI, DA Zone and sub-zone, detailed outputs
Solar
Steady values, dynamic solar gains and shading with climate data Solar gains, glare, internal and external, shading
Fabric Mostly dynamic, 3D heat transfer analytical models Temps, moisture, condensation, dT
Acoustic Analytical, Noise and sound levels,
Site/Masterplan External comfort, wind, safety, vegetation, climate Temps, velocities, comfort indices,
Flow, thermal, CFD, FVM, LBM, Sub-zone, detailed,
Structural FEA, Loads, Pressure, Forces Loading, stress, strain, energy
Sizing (pipes, ducts) M&E Sizes, quantities, costs
HVAC Component level sizing Energy, pressure drop, flow rates
6. What Are Thermal Modelling Tools Used
For?
SimScale to IES (VE) for Building Simulation
7. What Are Thermal Modelling Tools Used For?
Dynamic thermal modelling tools are used for zone level calculations:
Inputs
● Solar gains
● Fabric gains
● Internal gains (people, equipment, lighting etc.)
● Heating/cooling energy added or removed
● Uncontrolled gains e.g. infiltration
● External environment (Ambient temp, wind speed, direction, RH etc.) for calculation of air exchange
between inside and outside - (nat vent)
Outputs
● Calculation of heating and cooling loads / zone
● Energy KWh, KWh/annum, room/building level
● Internal space temperatures at zone level
● Internal air quality e.g. CO2 at zone level
● Output data relating to specific industry benchmarks (eg CIBSE TM59, BB101 etc)
8. What Is CFD Used For?
SimScale to IES (VE) for Building Simulation
9. What Is CFD Used For?
CFD modelling tools are used for ZONE & SUB-ZONE level calculations:
OUTPUTS
● Temperature distribution and gradient within a space
● Air velocities and distribution within a space
● Visualizing air and temperature phenomena
● CO2 spatial mapping
● Calculating actual wind pressure coefficients based on surrounding buildings, wind profile, and facade pressures
● Coupling the external and internal wind/air environment
● HVAC
● Smoke/pollutant extract and dispersion
● Building aerodynamics
● Porous media
● Thermal comfort
11. Channeling Effect
What are the different wind effects generated by buildings?
(Source)
Velocity must increase as it
passes through a constriction.
Buildings and other obstructions
will force an increase in wind
speed through city streets and
other unobstructed channels.
From south west
12. Downwash effect
What are the different wind effects generated by buildings?
Wind velocities at 6.5 m/s at low altitude
From south west
13. 3D Slice
What are the different wind effects generated by buildings?
14. 8.049 m/s8.049 m/s
Front side Back and right side viewLeft side
Wind Loading and Facade Pressures
What are the different wind effects generated by buildings?
15. 1. Natural and mechanical ventilation
2. Thermal comfort & compliance with standards
3. Indoor air quality
4. Contamination spread and control
5. Smoke propagation & extraction
Thermal Comfort &
Indoor Environment
15
16. ● Evaluate design scenarios and variations
● Visualize the flow field (speed, direct,
temperature)
● Comply with industry standards (ASHRAE 55,
ASHRAE 90.4, EN 15251, etc.)
HVAC
16
19. 1. The wind pressure at an opening (Pw) and hence ΔP - difference
between internal and external pressure determines how building
simulation tools calculate air flow (natural ventilation, fresh air etc.)
through windows/openings.
1. This air exchange will have a ΔT - difference between internal and
external temperature.
1. Therefore the amount of air coming in/out of openings has a direct
impact on building:
a. Fresh air and air exchanges - are you calculating the ventilation
and air quality values correctly?
b. Heating and cooling loads - because the amount of air coming
in/out of your building at a certain temperature will either add or
remove thermal energy from your spaces
c. Energy - Gas and electricity due to heating and cooling costs
d. Thermal comfort - air speed, distribution, temperature and
quantity of flow rate.
Why Are Wind Pressure Coefficients (Cp) So Important?
20. Most thermal modelling and building simulation tools use
simple airflow network models to calculate bulk air movement.
They DO NOT capture the following effects:
● Wind turbulence
● External wind conditions
● Local building context
● Terrain is an oversimplified constant
● Exposure types are poorly understood and seldom
applied. They are also based on very simplified wind
tunnel testing conducted a long time ago.
Have you ever thought of how your wind pressure
coefficients can be more accurately calculated?
What Factors Should You Watch Out For?
21. ● All these wind directions are computed in parallel,
a transient (real-time wind) simulation takes less
than 2 hours.
● Results are exported on the building surfaces.
16 Directions, At Once!
22. These pressure coefficients can then be used for a
plethora of purposes—including increasing the
accuracy of thermal models.
Import Into Thermal
Modelling Software
25. ● Densely populated city centre location
● 5 story building
● Naturally ventilated
● High risk of summertime overheating due
to building type
● CIBSE TM59 compliance required
● DTM simulation tool used: IES VE
Case Study: Student Accommodation, Nottingham
26. 26
Import
Geometry
Setup and Run
Simulation
Export Cp Values in
Table Form
1
3-Part Workflow
1. Import the geometry and point file
2. Follow our 2-minute setup workflow to run a
simulation
3. Export the data and run an automated script
How do we assess impacts of buildings on
pedestrian comfort?
2
3
27. N
Step 1
● Simply export the geometry from IES as an STL file
and upload it to SimScale. This should include
relevant context.
Import Geometry
28. Step 1
● The points uploaded to SimScale should contain a
label (this is used to later reference in IES, so
ensure a well documented naming convention) and
the X, Y, Z coordinates for the centre of each
window.
● In this instance, each face is labeled, floor and
window, to make it easier to reference (opposed to
naming each window 1-130). The windows are
referenced left to right.
Import Geometry - Points
Face 1
Face 2
Face 3
Face 4
Floor 0
Floor 3
Window 1
Window 11
29. 29
Define region
Define wind rose
Upload point locations
1
3
2 minute setup
It’s that simple.
1. Define region
2. Define wind rose
3. Upload point locations
Step 2
2
30. Step 3
● Data processing is simple with a python script with
some prerequisites.
○ The data is organised as pictured.
○ The model specific information is defined in the
script.
● Once this is completed, the text file can then
be put into the IES file system and used.
Process the Data
31. Surface Pressures
31
31
● Surface pressures are used to obtain
pressure coefficients.
● The reference velocity is the velocity in the
wind profile at that height.
32. 32
32
● Graph shows natural ventilation flow
rates during a hot week in July.
● When using Simscale data, natural
ventilation flow rates can be more than
twice those modelled when using IES
default data.
Results (Ventilation)
33. 33
33
Results (Temperatures)
● Room temperatures when using SimScale are
up to 2oC +/- from temperatures recorded
when using IES defaults.
● Summertime room temperatures assessed to
be generally cooler when using SimScale data,
owing to increased ventilation flow rates.
34. 34
34
Use of SimScale data alone can provide a TM52 ‘pass’, where otherwise a
room would be found to fail.
Results (Compliance)
35. When comparing to pressure coefficients obtained in building
simulation models we see the following:
● Pressure higher up the building is greater in
comparison to standard methods used, where flow
is faster than expected for this wind profile due to
upstream obstruction.
● Lower down, it is much less as surrounding
buildings are actively obstructing airflow.
● Up to 100% difference in Cp values across the
length and width of the building.
● Imagine the errors which propagate through to
calculating air flow rates, loads, comfort and more!
How will this impact on your:
○ Overheating assessments?
○ Fresh air rates?
○ Energy/loads?
○ Compliance?
Summary