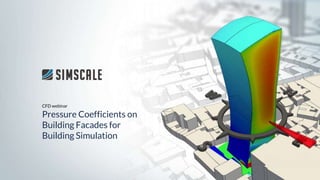
Pressure Coefficients on Building Facades for Building Simulation
•Download as PPTX, PDF•
0 likes•254 views

While accurate wind pressure coefficients are critical to evaluating building design, most engineering software for energy and thermal analysis oversimplifies treatment of wind pressure, which can adversely impact cooling, ventilation, overheating, and fresh air rates assessments. This presentation shows how SimScale provides accurate calculations of wind pressures, quickly and cost-efficiently, to deliver a more comprehensive evaluation of building performance. Watch the webinar recording here: https://www.youtube.com/watch?v=VU4-PN9PYDM

Recommended
Recommended
More Related Content
What's hot
What's hot (20)
Similar to Pressure Coefficients on Building Facades for Building Simulation
Similar to Pressure Coefficients on Building Facades for Building Simulation (20)
More from SimScale
More from SimScale (20)
Recently uploaded
Recently uploaded (20)
Pressure Coefficients on Building Facades for Building Simulation
- 1. CFD webinar Pressure Coefficients on Building Facades for Building Simulation
- 2. In today’s presentation we will explore the importance of accurate wind pressure coefficients, and why these are critical in building design. This is especially important if you use any building simulation tools for thermal modelling, ventilation design, and compliance. Wind pressure coefficients
- 3. Why are wind pressure coefficients (Cp) so important? 1. The wind pressure at an opening (Pw) and hence ΔP - difference between internal and external pressure determines how building simulation tools calculate air flow (natural ventilation, fresh air etc.) through windows/openings. 1. This air exchange will have a ΔT - difference between internal and external temperature 1. Therefore the amount of air coming in/out of openings has a direct impact on building: a. Fresh air and air exchanges - are you calculating the ventilation and air quality values correctly? a. Heating and cooling loads - because the amount of air coming in/out of your building at a certain temperature will either add or remove thermal energy from your spaces a. Energy - Gas and electricity due to heating and cooling costs a. Thermal comfort - air speed, distribution, temperature and quantity of flow rate.
- 4. 1. Pw is dependent on Cp 2. Pw is used to calculate ΔP 3. ΔP is used to calculate mass flow rate exchange between inside and outside (There is also a ΔT) 4. Mass flow rate is an input into the calculation of: a. Heating load b. Cooling load c. Overall energy (KWh) and Cost ($) d. Thermal comfort e. Overall zone and building energy balance f. Impacts on air velocities in rooms for comfort purposes Imagine a 50% error in your Cp and how that error propagates through all of the above Why are wind pressure coefficients (Cp) so important?
- 5. What factors should you watch out for? Most thermal modelling and building simulation tools use simple airflow network models to calculate bulk air movement. They DO NOT capture the following effects: ● Wind turbulence ● External wind conditions ● Local building context ● Terrain is an oversimplified constant ● Exposure types are poorly understood and seldom applied. They are also based on very simplified wind tunnel testing conducted a long time ago. Have you ever thought of how your wind pressure coefficients can be more accurately calculated?
- 6. Setup and run a simulation Pressure coefficient results Import into thermal modelling solution 1 3-Part Workflow 1. Run a PWC simulation on SimScale. 2. Download results and calculate the pressure coefficients in ParaView from the pressure results. 3. Query the results in ParaView and use the results to obtain thermal model’s with higher accuracy. How do we assess pressure coefficients on building facades? 2 3
- 7. The Workflow for Pressure Coefficients Pressure Coefficients on Building Facades for Building Simulation
- 8. Step 1 ● Traditionally the process for running a CFD simulation has been very difficult. ● SimScale has simplified this into a 3 step process and considered all the best practices and documentation. ● A simulation can be setup and run within 10 minutes in most cases. Setup
- 9. Step 2 Pressure Coefficient Results ● To obtain pressure coefficients, the results need to be post processed ● The pressure results are normalised using the wind speed at the same height in the wind profile. ● Results can be queried by simply selecting points on the building.
- 10. These pressure coefficients can be used for many different things including increasing the accuracy of thermal models. Step 3 Import Into Thermal Modelling Solution
- 11. Setting up a simulation Pressure Coefficients on Building Facades for Building Simulation
- 12. Define region Define wind rose Define pedestrian zones 1 3 2-Minute Setup It’s that simple. 1. Define region 2. Define wind rose 3. Define pedestrian zones How simple can it be? 2
- 13. Step 1 ● Position and size the cylindrical region of interest ● Define which direction is North Define City Region
- 14. Step 2 Define Wind Rose Location was searched by address and the wind data automatically imported from the connected database (Wind speed and direction).
- 15. Step 3 ● Pedestrian region was set to be 1.5m from the floor. ● All terrain at pedestrian level was select to be offset. ● In more complex scenarios, terraces, balconies or planes at set heights can be used to record results. Define pedestrian region
- 16. Doing this yourself ● This can of course all be done by you! ● The Example project setup is here ● The ParaView state is here This will allow you to create pressure coefficients to the eurocode wind profile, but can be modified to suit your needs. Useful Links
- 17. ● All these wind directions are computed in parallel, a transient (real time wind) simulation takes less than 2 hours. ● Results are exported on the building surfaces. 8 Directions, At Once! Results
- 18. ● Pressure coefficients on windward side are higher than 1 and on the leeward side, less than 1 as expected. ● A pattern is observed that on the windward face of the building the pressure coefficients are fairly uniform. ● On the next slide we will look at how this alters due to shielding. Wind Pressure Coefficients Results South facade h/H = 0.2 S Cp 0.18
- 19. ● When the wind is coming from the south the pressure is mostly unaffected by the closely surrounding buildings. ● This is different when there is an easterly wind, the shielding from the nearby building on the windward side causes the pressure coefficient to drop at building height. Wind Pressure Coefficients Results
- 20. Results at 0° for SW Direction Nearby Building
- 21. When comparing to pressure coefficients obtained in building simulation models we see the following: ● Pressure higher up the building is much higher in comparison to standard methods used, where flow is much faster than expected for this wind profile due to upstream obstruction. ● Lower down, it is much less as surrounding buildings are actively obstructing the flow. ● Up to 100% difference in Cp values across the length and width of the building. ● Imagine the error which propagates through to calculating air flow rates, loads, comfort and more! Summary How will this impact on your: ○ Overheating assessments? ○ Fresh air rates? ○ Energy/Loads? ○ Compliance?
Editor's Notes
- D
- D
- NK
- N
- N
- D
- D
- D
- D
- D
- D
- D
- D
- D
- D
- D
- D
- D
- NK