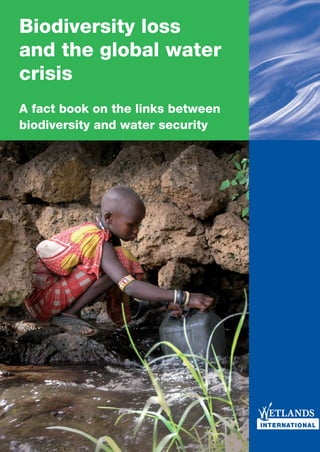
Biodiversity loss and the global water crisis - A fact book on the links between biodiversity and water security
•
3 likes•4,417 views

Biodiversity loss and the global water crisis are closely interlinked. As human demand for water grows to produce food, fuel, and power, less water is available for ecosystems, resulting in biodiversity loss. Freshwater ecosystems support disproportionately high biodiversity but have suffered major losses, with wetlands reduced by over 50% in some places. Growing populations and food needs increase pressure on water resources, with agriculture already using 70% of freshwater, mostly for irrigation. This threatens both ecosystem health and human water security.

Recommended
Recommended
More Related Content
What's hot
What's hot (20)
Viewers also liked
Viewers also liked (20)
Similar to Biodiversity loss and the global water crisis - A fact book on the links between biodiversity and water security
Similar to Biodiversity loss and the global water crisis - A fact book on the links between biodiversity and water security (20)
More from Wetlands International
More from Wetlands International (20)
Recently uploaded
Recently uploaded (20)
Biodiversity loss and the global water crisis - A fact book on the links between biodiversity and water security
- 1. Biodiversity loss and the global water crisis A fact book on the links between biodiversity and water security
- 2. Biodiversity loss and the global water crisis A fact book on the links between biodiversity and water security Wetlands International October 2010
- 3. Contents 1. Introduction: water for life, life for water ...............................................................................3 2. Fresh water: a tiny but crucial resource .................................................................................4 2.1 Global fresh water picture: tiny resources supporting global life .................................................. 4 2.2 Water stress and scarcity: an unequal world ............................................................................... 4 3. The water crises and biodiversity loss .........................................................................5 3.1 Biodiversity and water security go hand in hand.......................................................................... 5 3.2 The importance of freshwater for biodiversity .............................................................................. 5 3.3 Loss of wetlands and fresh water dependent biodiversity ........................................................... 6 4. Competing for water .....................................................................................................8 4.1 Water for food production: the thirstiest sector of all.................................................................... 8 4.1.1 Ecosystems supporting food security at a distance............................................................... 12 4.2 From fossil to biofuels: thirsty cars ............................................................................................. 12 4.3 The impact of hydropower dams ............................................................................................... 14 4.4 The critical role of water in maintaining the carbon content of peatlands .................................. 16 4.5 Water for biodiversity .................................................................................................................. 17 5. Climate change: impacting the patterns of water availability ...................................20 5.1 Losing our ‘water towers’: the Himalaya case ........................................................................... 20 5.2 The dry regions get drier: the Sahel ........................................................................................... 21 6. Looking for the future: drought, floods, famine and biodiversity ..............................24 6.1 Increasing water shortages ........................................................................................................ 24 6.2 More floods ................................................................................................................................ 24 6.3 Less food ................................................................................................................................... 25 7. How to overcome the crisis ........................................................................................26 8. References ..................................................................................................................27 2 Wetlands International BIODIVERSITY LOSS AND THE GLOBAL WATER CRISIS
- 4. 1 Introduction: water for life, life for water Globally we are facing a water crisis. We use and This booklet aims to highlight the links between dispose of more water than ever before: to grow the emerging water crisis and biodiversity loss. food and now increasingly biofuels, for domestic Both are the result of the same root causes and use and to generate power for our homes and both problems reinforce each other. industries. Such activities are viewed as necessary - through them the world’s poorer countries can The booklet draws on the knowledge and develop and those that are already developed can understanding developed by Wetlands Inter- become greener and more sustainable. However, national and its partners over many years and is the growing demand for water is diminishing the supplemented with key information from other, amount, quality and regularity of water available peer reviewed studies. for our ecosystems. This is causing a loss and degradation of biodiversity in ecosystems of all types. It is also diminishing the ability of ecosystems to provide essential services that keep people healthy and out of poverty. Lake Natron, Tanzania is the only significant and regular breeding site for the majority of the East African population of the Lesser flamingo (Phoeniconaias minor), which accounts for 75% of the global population. By Andrew Burton. Wetlands International BIODIVERSITY LOSS AND THE GLOBAL WATER CRISIS 3
- 5. 2 Fresh water: a tiny but crucial resource Water is essential for life in the sea and on land. complex one; sometimes even where there is 70% of the Earth’s surface is covered by water. enough water, there is not enough capacity to However, only a tiny proportion (3%) of this is fresh make it available to different users. In some places water, a large amount (around two thirds) of which water scarcity and stress fuel competition and is unavailable, being frozen as polar ice-caps or even conflict between users. glaciers. Another large part (about a third) is stored as deep groundwater. As a result, all, non-marine, living creatures rely on less than 1% of the planet’s total freshwater for their survival. There is huge competition for this available fresh water. It is necessary to maintain biodiversity, but also to produce food, fuel, generate power, provide water for domestic and industrial uses and maintain the carbon content of ecosystems. Groundwater fulfils some of these needs but the pressure on surface water is huge. 2.1 Global fresh water picture: tiny resources supporting global life Figure 2. Areas of physical and economic water scarcity. Source: Water for Food, Water for Life: A Comprehensive Assessment of Water Management in Agriculture. London: Earthscan, and Colombo: International Water Management Institute, 2007. www.iwmi.cgiar.org/assessment. Figure 1. Distribution of Earth’s water. Source: In addition there are also temporal variations in USGS, in Nature’s Special report Courtland, R water resource availability. Seasonal variability in (2008). Enough water to go around? Nature. water availability is common in many parts of the doi:10.1038/news.2008.678. Can be accessed at world. In some places this seasonal water scarcity http://www.nature.com/news/2008/080319/full/ creates pressure on the quantity and quality of news.2008.678.html. freshwater resources. Furthermore, changing long-term climatic patterns are creating extended 2.2 Water stress and scarcity: an periods of drought or water abundance. The unequal world climatic patterns in the Sahel are thought to be an Although freshwater makes up just a small fraction example of this 1. of the world’s total water resources, it is thought that there is still enough available for the world’s uses. Unfortunately water is not always found in the places where it is most needed. Many places experience water scarcity, creating water stress for different users. The concept of scarcity is a 1 Zwarts, L. 2010. 4 Wetlands International BIODIVERSITY LOSS AND THE GLOBAL WATER CRISIS
- 6. 3 The water crises and biodiversity loss 3.1 Biodiversity and water security go lead to water security problems. Solving water hand in hand security problems also maintains biodiversity. Water security can be jeapordised by a number of man-made factors, including river fragmentation, This can often be done at a lower cost than overgrazing, the draining of marshlands and addressing the symptoms of water stress. For pollution. These problems often increase with instance, maintaining the integrity of upland economic development. The same factors also ecosystems reduces costs for drinking water lead to biodiversity loss 2. treatment. Preserving floodplains is cheaper than building reservoirs for flood control. Richer countries are usually able to cope with water security problems; most commonly by 3.2 The importance of freshwater for addressing the symptoms (e.g. infrastructure to biodiversity cope with increased flood risk or water purification Just 0.3% of all global water resources are fresh to cope with pollution) rather than addressing the surface water. In terms of area, less than 2% of causes. the world’s surface consists of lakes, marshes, Figure 3. The correlation between wealth and threats to human water security. Source: Vörösmarty et al., 2010. Global threats to human water security and river biodiversity. Nature Volume 467, September 2010. Management Institute, 2007. www.iwmi.cgiar.org/assessment. Less wealthy countries are unable to make rivers or other freshwater wetlands. Many species the massive investments required and remain completely depend on these areas. Almost all vulnerable to drought, floods and water pollution. land-dependent life, habitats and ecosystems Figure 4, below, illustrates this: the grey areas with depend on freshwater. Water flows and cycling few threats to biodiversity also have relatively few are critically important to the maintenance water security problems (grey). The red regions of biodiversity. The importance of wetland face biodiversity and water security problems; ecosystems, in terms of global biodiversity, the richer (yellow) areas face a loss of biodiversity strongly illustrates this. but are able to address the symptoms of water security problems with massive investments. An estimated 126,000 known species rely completely on freshwater habitats. This figure There are hardly any (brown) areas where includes 15,000 fish species (some 45% of all biodiversity is doing fine and where water fish species), 4,300 species of amphibians, 5,600 security is low. This thorough analysis shows species of dragonflies and damselflies and 5000 that the stresses on ecosystems, which lead to biodiversity loss, are similar to the stresses that 2 Vörösmarty et al.; 2010 Wetlands International BIODIVERSITY LOSS AND THE GLOBAL WATER CRISIS 5
- 7. Figure 4. Threat to human water security and 3.3 Loss of wetlands and fresh water biodiversity. Source: Vörösmarty et al., 2010. dependent biodiversity Global threats to human water security and river Recent best estimates suggest that there biobiodiversity. Nature Volume 467, September are approximately 1,280 million hectares (1.2 2010. million square kilometres) of wetland in the world (although this is considered to be an species of molluscs; it is estimated that as many underestimate). There used to be many more; in as one million species rely on freshwater habitats parts of North America, Europe, Australia, and - including all undescribed species. Some 37% of New Zealand more than 50% of wetlands were all bird species are dependent on inland waters. lost during the twentieth century. Globally habitats associated with 65% of continental freshwater discharge are moderately to highly threatened 3. Table 1. Status of Species Status (IUCN Red-List) 4 freshwater biodiversity 4. Freshwater mammalian species (145) 38% threatened with extinction * Freshwater fish, crabs, molluscs, dragon flies and Freshwater amphibian species (4242) Over 25% threatened with extinction some plants. Freshwater fish in Africa Nearly 25% threatened with extinction Freshwater fish in Mediterranean Basin Over 55% threatened with extinction Freshwater species in Africa (5,167 Over 20% threatened with extinction assessed)* Extinct birds (136) Over 10% freshwater dependent birds 3 Vorosmarty et al.; 2010 4 IUCN Red List of Threatened Species v. 2010.3 http://www.iucnredlist.org/ 6 Wetlands International BIODIVERSITY LOSS AND THE GLOBAL WATER CRISIS
- 8. Figure 5. Living Planet Index: fresh water species are strong in decline. Source: WWF/ZSL/GFN Living Planet Report 2010 (c) 2010 WWF (panda.org). Freshwater species are being lost at a much more rapid than other species. There are several reasons for this. One major factor is the vulnerability of species that depend on relatively small areas of habitat that are under pressure from increased human demand for water resources. In Africa, the first continent to have completed a major assessment of its freshwater biodiversity, the biggest threats to species stem from agriculture and pollution, water abstraction and dams. The Living Planet Index uses a number of key indicator species to measure trends in the populations of vertebrate species. It shows a steep decline in the populations of freshwater species from the mid 1980s onwards. Lake Naivasha, Kenya suffers heavily from drought, agriculture and related pollution, as well as water extraction for nearby Naivasha town. By Isaac Ouma. Wetlands International BIODIVERSITY LOSS AND THE GLOBAL WATER CRISIS 7
- 9. 4 Competing for water Ecosystems make water available to the organisms that live within them. However, ecosystems can also be considered as users in themselves, having their own needs in terms of water quantity, quality and flow. Ecosystems also provide services that support the livelihoods of millions of people and provide a basis for development. Despite this, human demand for water generally fails to recognise ecosystems’ water requirements. This is the underlying reason for the degradation and loss of wetland ecosystems. Such a lack of recognition can imply high costs for society which may then subsequently have to invest in flood Figure 7. World population and future fresh control, water storage or purification. water needs. Source: FAO, OECD 2008, Water Resources Group 2009. Human pressure means that progressively less water is available for natural areas or to maintain their biodiversity. In order to approach 4.1 Water for food production: the water management in a more balanced way it is thirstiest sector of all essential to understand human patterns of water use and the alarming developments within them More mouths to feed, more water needs in recent decades. Achieving food security for the world’s population is one of the greatest development challenges - at present, the world’s population increases by over 200,000 people per day. The number of undernourished people in the world has increased by 9% since 1990, despite a 12% rise in global food production per capita in the same period 5. Water is a key factor for food production and availability; especially for the rural poor in parts of Africa and Asia. Currently agriculture is responsible for 70% of all freshwater use, a significant proportion of which is used in irrigated agriculture, which supplies 40% of the world’s food. Fifty Figure 6. Increase in water use. 20th century world years ago the world’s population was less than water use, by sector, in cubic kilometres. Source: half of what it is today and agriculture used one World Water Resources and Their Use, UNESCO, third of the water that it does now. An assessment 1999. http://webworld.unesco.org/water/ihp/db/ of the future water needs of agriculture, to feed a shiklomanov/part’3/_Read’me.html. growing population, show that in 50 years time there will still be enough water, but it will not be in the right places. This will lead to major crises 6. 5 Current world population ranked - http://www.xist.org/earth/population1.aspx 6 IWMI, 2007 8 Wetlands International BIODIVERSITY LOSS AND THE GLOBAL WATER CRISIS
- 10. Agricultural intensification and its impacts on biodiversity and livelihoods: the case of Kimana, Southern Kenya Maasai herdsmen have lived for ages on the lower slopes of Mount Kilimanjaro with their cattle, relying on the streams coming from the snow capped mountain and on the vegetation around Amboseli wetlands. In recent years a growing number of farmers have migrated to the area. They have settled upstream from the Maasai, tapped into the local rivers for irrigation and bought new equipment to convert the area to crop production. As a result, the pastoralists have faced increased problems with water supplies, which form a lifeline for their cattle and are the mainstay of their livelihoods, nutrition and culture. Reduced flows from the mountain mean that some sections of the wetlands only receive water during the rainy season, approximately two months a year (as opposed to the normal five months of the year). In addition, the water is now polluted with pesticides. The changes have also isolated the Amboseli National Park, which has now become an island of natural vegetation in a landscape being converted to agriculture. As a result, elephants and other animals now have to cross farmlands on their traditional migrations routes, creating further conflict. In recent dry years (2007-2009) many cattle died as wetland areas that used to remain wet, even during such a drought, dried up. Many wild animals, including the entire local hippo population, also died. As the story spread, the majority of tourists planning to visit the area cancelled their plans - so reducing local incomes. While the drought was a natural weather event, its consequences became a disaster for local people and wildlife due to mismanagement of water resources. Wetlands International works in Kimana on improving access of all stakeholders to water resources and involving them in decision-making processes. Kenya’s Kimana wetlands are converted into agricultural land, limiting access to water for wildlife and cattle. By African Widlife Foundation (AWF). Wetlands International BIODIVERSITY LOSS AND THE GLOBAL WATER CRISIS 9
- 11. Figure 8. Water requirements for different products. Source: Waterfootprint (http:// www.waterfootprint.org), accessed May 15, 2009; Gleick 2008. Future food production faces a number of challenges, many of which are related to climate change. These include: increasing temperatures, declining and more unpredictable rainfall, more frequent extreme weather and more severe attacks of pests and disease 7. More water for a changing diet With increasing purchasing power, people change their diets. There is a continual global increase in demand for animal protein (milk, cheese, meat, and eggs). Yet livestock consumes a large proportion of the world’s crops as well as a great deal of freshwater. A diet rich in animal protein leaves a much bigger water footprint than a vegetarian one. The most common strategies for increasing food production are to increase the area of land in production, and/or establish irrigation systems. However, we already take so much water from our rivers that many can be considered closed basins - little or no water reaches the sea in areas like the Middle East, parts of South Asia and North Africa. Further exploitation of freshwater resources and land could be minimalised if the productivity of water use was raised significantly, producing Figure 9. Water requirements for food production. ‘more crop per drop’. However, progress on this Source : UNEP/Grida http://www.grida.no/ front has been minimal over the last decades. publications/rr/food-crisis/” 7 Parry, M.L., Canziani, O.F., Palutikof, J.P., van der Linden, P.J. and Hanson, C.E., (eds.) 2007, Kotschi, J. 2007, Morton, J.F. 2007, Brown, M.E., and Funk C.C. 2008 and Lobell, D.B., Burke, M.B., Tebaldi, C., Mastrandrea, M.D., Falcon, W.P., and Naylor R.L. 2008. 10 Wetlands International BIODIVERSITY LOSS AND THE GLOBAL WATER CRISIS
- 12. Ruoergai Plateau in China: drying up lakes threaten downstream food security The Tibetan Plateau is the source of all the major rivers in East and South Asia, serving some 2 billion people. The Ruoergai Plateau is a mountain plateau of 10,000 square kilometres spread across the Gansu and Sichuan provinces, China, and is the upper catchment of the Yellow River. The area consists of marshes with deep peat layers with a very high water storage capacity (see table). It is estimated to store 23% of the Yellow River’s annual recharge (32.3 billion m³). The seasonal regime of the river is critically important for downstream agricultural production. A recent study 9 assessed the value of the different services that Ruoergai provides, such as grazing land, water regulation and carbon storage. It showed that only 4% of the ecosystem’s value is derived from its grazing role. The remaining value is mainly related to its carbon storage and water regulation services. This is quite a remarkable statistic, given that the Ruoergai is estimated to have half a million head of cattle and to be one of the largest rangelands in China. Table 3. Water storage capacity of Ruoergai per land cover. Source: Zhang, X.Y., Lu, X.G., Multiple criteria evaluation of ecosystem services for the Ruoergai Plateau Marshes in Southwest China, Ecol. Econ. (2009), doi:10.1016/j.ecolecon.2009.05.017. Ruoergai’s peatland water level is estimated to have lowered in recent years by 1-2m. Drainage, both planned and unplanned (the latter due to overgrazing which has lead to gullying and the lowering of water tables) has strongly diminished the water storage of this area. Wetlands in the Ruoergai are now seasonally as opposed to perennially saturated. Out of 17 lakes surveyed in 1985, 6 have completely dried up, and 11 have shrunk. Gahai Lake, which covers 480 ha in Lugu County, dried up in 1995, 1997 and 2000 and the Musuo Lake in Ruoergai County has completely dried up. The impacts on the Yellow River are not yet fully understood but it is believed that the flows are slowly being affected, with the risk of disruptions to the environment and food security further downstream. Further ecological deterioration has diminished the productivity and quality of the grassland. As this is one of the biggest rangelands in China this will also affect production and the food supply of many millions of people in China. 9 Zhang, X.Y., Lu, X.G., 2009 Wetlands International BIODIVERSITY LOSS AND THE GLOBAL WATER CRISIS 11
- 13. Figure 10. Importance of the Tibetan marshes for Asian rivers. Sources: Center for International Earth Science Information Network, http://sedac. ciesin.columbia.edu/gpw/global.jsp (accessed May 15, 2009); Armstrong and others 2005; ESRI 2002; WDR team. 4.1.1 Ecosystems supporting food 4.2 From fossil fuels to biofuels: thirsty security at a distance cars Food production depends on water availability at Biofuels: a major contribution to the agricutural certain times of the year. Significant investments water needs of the future are made in hard infrastructure (such as barrages, Despite much publicity, biofuel use is still rather dams and other storage and regulatory structures) marginal; accounting for just a small percentage to ensure this. However, it is often overlooked of all the fuels used in a few countries and regions that the water available within these systems (the EU region, the United States and Brazil). But, is also controlled by the ‘natural infrastructure’ it is already having a very large impact on land and upstream. The lakes, swamps and peatlands at water use, one that is anticipated to grow in the higher altitude regions store and release the water coming years. that our food production depends on. Loss or degradation of these ecosystems will change the In some areas, with sufficient rainfall, the impacts availability of water for downstream agriculture of biofuel production are limited to land conversion and ecosystems. One clear example is the peat to grow the source crops and deterioration of swamps of the Tibetan Plateau; the source of water quality due to pesticides. However in many Asian rivers (see box page 13). regions that already suffer from water shortage the growing market for ethanol and vegetable oil is having an impact on water availability and contributing to the water stress experienced in Table 2. The water demand of biofuels and fossil these areas (see box page 15). fuels, per unit of energy 8. Source: R . Dominguez- Faus et al., 2009. The Water Footprint of Biofuels: A Drink or Drive Issue? Environmental Science & Technology 43, 3005-3010. http://pubs.acs.org/doi/ pdfplus/10.1021/es802162x. Fuel type Litres of water per Megawatt Hour (L/MWh) of energy Petroleum extraction plus refining 90 - 190 Corn ethanol under irrigation 2,270,000 - 8,670,000 Soybean bio-diesel under irrigation 13,900,000 - 27,900,000 8 Figures from AidEnvironment 2008 12 Wetlands International BIODIVERSITY LOSS AND THE GLOBAL WATER CRISIS
- 14. Kenya - Tana River Delta falling victim to biofuel conversion A striking example of the potentially destructive impact of the recent surge in the production of biofuels can be found in the Tana River Delta, a mosaic of floodplain wetlands, grasslands, savannah woodlands and mangroves on the northern part of the Kenyan coast. The area is very important for waterbirds and 22 species have been recorded in numbers exceeding the 1% level for international importance. These include many colonially nesting species, but also include three long-distance migrants Little Stint, Marsh Sandpiper and Lesser Sandplover. Encouraged by the Kenyan government, investment from as far away as Canada, the Middle East and China is being made in the area to plant vast acreages of sugar cane for biofuel production. This will place large demands on water resources, which are already under pressure from upstream and from the east of the Tana Delta. In the Tana River District there are plans to convert some 90,000 hectares to growing jahtropa - another source crop for biofuel. And further upstream there are plans to build a hydropower plant - the High Grand Falls power generation project near the head of the Athi and Tana basins. This project will also divert water for agricultural irrigation. Together these projects are likely to substantially reduce the water flowing into the delta, disrupt its wildlife and ecology and threaten the ecosystem services it provides to local inhabitants. Tana River Delta, Kenya - home to thousands of White-faced Whistling Ducks (Dendrocygna viduata) - is being converted into plantations for biofuels. By Oliver Hamerlynck. Wetlands International BIODIVERSITY LOSS AND THE GLOBAL WATER CRISIS 13
- 15. 4.3 The impact of hydropower dams implementing the main findings of this report Developing countries need energy for their found that many of the same issues remain development. There are many potential sources unsolved. of energy but hydropower has long been seen as a relatively clean and sustainable source. In Figure 11 shows the significant fluctuation in countries with significant water resources and investment in dams over twenty years, which limited fossil energy resources, it can appear as steeply dipped in the 1990s but has since risen a cheap and accessible option. For many years again. Figure 12 shows the locations of dams these assumptions have been challenged. The under construction at the end of the 1990s World Commission on Dams highlighted many of and areas where river channels are subject to the potential pitfalls in hydropower development. fragmentation and flow regulation. Ten years later, a review of the progress in Figure 11. Global investment in dams 1992-2008 (adapted from World Bank 2009). Figure 12. River fragmentation and dam construction. Source: World Bank (2000). 14 Wetlands International BIODIVERSITY LOSS AND THE GLOBAL WATER CRISIS
- 16. The impact of dams on ecosystems: the Mali case Dams on the upper reaches of the Niger are causing very significant changes for people living downstream in the Inner Niger Delta Area who are dependent on fisheries, grazing lands for their cattle and agriculture. The dams, which are used to generate power and provide irrigation water upstream, are magnifying the effects of lower rainfall in an environment where life literally depends on water. Over time the seasonally inundated area in the Inner Niger Delta is becoming smaller - reducing the size of the grazing lands and areas suitable for agriculture. There is always a trade-off between the positive and negative impacts of a dam project. The benefits in this case can be found around the Markala dam where there is now more irrigated agricultural land, and the electricity supplied by the Sélingue dam. These edams have also created new wetland habitats, which have attracted populations of waterbirds. Yet at the same time, as shown in Table 4, downstream users have experienced significant losses, in fishery and rice production and the number of grazing cattle. In addition, lower river flows have made navigation on the Niger increasingly difficult and seasonal. It is estimated than more than 1 million downstream inhabitants have lost out from these schemes. The issues are particularly pertinent at present when there are plans in the pipeline to construct a further hydropower dam on the Niger at Fomi. The redistributive effect and the cumulative effects of this project need to be closely considered. Wetlands International works to ensure environmental and socio-economic impacts of new infrastructure are well considered in policy and planning, but also works on flood prediction and livelihood improvement in the Inner Niger Delta. Table 4. Annual costs and benefits of the dams for several regions in Mali and Guinea. Wetlands International BIODIVERSITY LOSS AND THE GLOBAL WATER CRISIS 15
- 17. Peatlands in Central Kalimantan, Indonesia are being logged, drained and burned, which causes huge CO2 emissions. By Marcel Silvius. 10 IPCC 2001, Working Group 1, the scientific basis. 11 Hans Joosten, Greifswald University 2010 16 Wetlands International BIODIVERSITY LOSS AND THE GLOBAL WATER CRISIS
- 18. Table 4. Peatlands and carbon emissions: a global overview. Global peatland carbon stock 450 Gt carbon Percentage of all terrestrial carbon 40% Global peatland area 3,813,553 km2 Percentage of all land 2.5% Of which drained 426,381 km2 Peatland emissions (decomposition, fires) 2 gigaton CO2 Percentage of all global CO2 emissions 6% 4.4 The critical role of water in maintaining the carbon content of peatlands It is estimated that, globally, more than one thousand gigatonnes of carbon are stored in ecosystems. This is a combination of 654 Gt of plant biomass 10 (roughly half of which is stored forests) and 450 ton of peatsoil carbon 11. In total, this is more than all the carbon (CO2 and NH4) in the atmosphere. These carbon pools are rapidly being degraded. Deforestation is responsible for about 20% of annual global carbon emissions. The release of carbon from peatlands occurs mostly through Figure 13. Drained, degraded peatlands per wetland drainage and the loss of vegetation cover. continent. Source: Joosten 2010: The Global Degrading peatlands release about 2 Gt of carbon Peat CO2 Picture. dioxide per year. In addition, the degradation of wetlands causes methane emissions of an unknown magnitude. Some peatland is drainage is done deliberately, for example peatlands in Malaysia and Indonesia are being drained to establish palm oil and paper pulp plantations. In other areas, it is an unplanned process, as is the case in the Tibetan Plateau where the degradation of peat swamps is due to overgrazing. Wetlands International BIODIVERSITY LOSS AND THE GLOBAL WATER CRISIS 17
- 19. Mujib River Basin: biodiversity loss due to a lack of water for the ecosystems Jordan is an extremely dry country, with soaring temperatures in summer and an average annual precipitation of around just 150 mm. A growing population is using more and more water. The story of one of the last rivers in this region shows how increased water stress and biodiversity loss go hand in hand. The Mujib River draws its water from the Jordan Highlands and Plateau, a total drainage area of 6,600 km2, at elevations of 700 to 900 m above sea level. The river plunges down into gorges towards the Dead Sea; about 410 m below sea level. Today the river is just a very small and shallow stream which, in many places, can be easily crossed without getting one’s knees wet. The river is also the lifeline for a large area, including the Mujib Nature Reserve. It has an ecological importance and is home to two endemic fish species: Doctor Fish Garra rufa and a species of ray-finned fish Nemacheilus insignis. On a larger scale, the river is also vital for amphibians, reptiles and large mammals such as the Nubian Ibex Capra Ibex nubiana which needs a regular and consistent source of drinking water. Many bird species, such as the resident passerines, use the vegetation alongside the river for nesting. In 2003 a dam was built to regulate the flow of the main stream of the river. Its main purpose is to provide electricity to Amman, (the capital of Jordan), tourism destinations by the Dead Sea and to the mining and processing industries around southern Ghor. A secondary purpose is to provide irrigation water to the Ghor Mazra’a area (approx. 2 million cubic metres a year). This development is now threatening much of the life that depends on the river. The dam totally blocks water from going downstream, except when the dam is full. The other tributaries to the river, fed by small springs, only provide a very small flow of water. The species that depend on the river are now very vulnerable, the more so since the concentrations of fertiliser and pesticides within the river are now much higher. The seasonal river flood has also been greatly reduced. The flood is a trigger for fish, amphibians, and invertebrates to start breeding. Controlling the annual flooding is disrupting the natural life cycle with potentially devastating consequences on local wildlife populations. Another impact of controlling the flood is the absence of reed-washing processes in the river. A further threat associated with the dam is the introduction of the alien species Blue Tilapia Oreochromis aureus. This species is known to have a destructive impact on native species and habitats. The species has been introduced into the dam lake and has not yet found a way into the Mujib River. However, if it does manage to escape and colonise the river there is a strong chance that it may wipe out the unique endemic fish of the Mujib River. The only sustainable solution for saving the biodiversity of the Mujib River is addressing the root cause. The citizens of Jordan benefit from extremely low water prices (particularly for such a dry country). Increased water prices are needed to reduce the demands from a water intensive agriculture, wasteful patterns of domestic water use and water intensive industries. Wetlands International supports the Royal Society for the Conservation of Nature to help farmers change towards less water intensive agriculture, with less fertiliser and pesticides. 18 Wetlands International BIODIVERSITY LOSS AND THE GLOBAL WATER CRISIS
- 20. The Mujib River, Jordan is nowadays just a very small stream, although endemic biodiversity depends on it. By Alex Kaat. society by wetlands in the developed world can 4.5 Water for biodiversity be valued as being worth $15 trillion annually. This Thousands of species rely on water-rich areas includes their water supply function, on which an and healthy water flows for their survival. If estimated 1.5-3 billion people depend. these species are to survive it is essential to preserve these areas. This makes biodiversity a ‘stakeholder’, with a valid claim on the world’s limited fresh water resources. The relatively small surface of the world that is covered by freshwater is home to almost one third (31%) of the planet’s vertebrate species. This in itself is justification for allocating a fair share of water to maintaining biodiversity; even in areas with water shortages, such as the Middle East (see text box below). In addition to this, healthy and biodiverse ecosystems provide direct and indirect economic benefits, food, tourism, water storage and purification. According to the Millennium Ecosystem Assessment, the services provided to Wetlands International BIODIVERSITY LOSS AND THE GLOBAL WATER CRISIS 19
- 21. 5 Climate change: changing the patterns of water availability Climate change adds to the pressure on defence (see Figure 14). Recent decades have freshwater ecosystem functions, threatening seen the retreat of almost two thirds of these to further damage the ecological services they glaciers, due to a range of factors. Further global provide and the biodiversity they contain. Climate warming is expected to increase the rate of glacial change is anticipated to lead to increased water melting, which is likely lead to higher summer scarcity along with more frequent and more flows in some rivers for a number of decades (in extreme flooding. It will also have a direct effect the case of very large glaciers, this increased run- on biodiversity, changing the distribution ranges off may persist for a century or more, substantially of some species and affecting the habitats and increasing the available regional water resources 12. niches of others. However once the glaciers are gone water flows along these rivers will become much more erratic, Figure 14. River basins and their hydrological significance. 5.1 Losing our ‘water towers’: the with more pronounced peaks and troughs - and Himalaya case serious implications for agriculture and flood Higher temperatures are accelerating glacial melt. protection. Glaciers and other icecaps regulate and provide a steady flow of water, regardless of extremes Figure 15 shows that the Himalayan glaciers are in precipitation (snowfall). This important role is retreating at a far more rapid rate than glaciers reduced when the size of snowcaps and glaciers elsewhere in the world (by 15% between 1960 is reduced. and 2008). Research shows that these Himalayan glaciers are retreating by between 0.3 and 1 metre A large number of rivers of Asia are fed by snow per year 13. Although the impacts of this need and glacial-melt from the Himalayas, which further investigation, it is likely to be significant contain almost 1500 glaciers. A large percentage since more than 2 billion people in South, of the population of China and the Indian sub- continent are dependent on the regulatory role 12 Ramsar, 2002 of these glaciers for their agriculture and flood 13 Wetlands International, Trisal C.L. and Kumar, R. 2008 20 Wetlands International BIODIVERSITY LOSS AND THE GLOBAL WATER CRISIS
- 22. Figure 15. Rapid retreat of greater Himalayan glaciers in comparison to the global average. Source: Dyurgerov and Meier 2005 in Trisal and Kumar. 2008. Southeast and East Asia rely on glacial melt crop yields to increase up to 20 per cent in East water. Higher glacial melt rates in the Himalayas and Southeast Asia, while they could decrease up in the coming two to three decades will increase to 30% in Central and South Asia by the mid-21st water availability (and this may mean more water century 14. is available to agriculture). But at the same time it is likely to increase flooding, this in some of the 5.2 The dry regions get drier: the Sahel most densely populated areas on earth. This will The expected warming due to climate change is be followed by decreased river flows which may - generally - a global phenomenon. The northern have catastrophic effects on the mega-delta half of Africa does not escape this trend. The six at the mouths of some of these rivers. In some warmest years in northern Africa since records mega-deltas, flooding from the rivers could cause began in 1860 have all occurred since 1998. In the Figure 16. The average temperature given as departures from the 1961-1990 average in northern Africa (0-40°N, 20°W-60°E) and worldwide. (Source: www.metoffice.gov.uk/ research/hadleycentre/ CR_data/Monthly/ HadCRUG.txt). The trends show the running mean calculated over an interval of 9 years (4 year before - 4 years after the year concerned). 14 IPCC 2007 Wetlands International BIODIVERSITY LOSS AND THE GLOBAL WATER CRISIS 21
- 23. Sahara-Sahel zone the rise in temperatures since Global Circulation Models also provide predictions 1970 has been faster than the global average, about rainfall. Given the important role that ocean with a 0.2°C rise per decade in the 1980s, which surface seawater temperatures exert on rainfall increased to 0.6°C per decade by the end of the in Africa, it is to be expected that a continuing 20th century. warming of the tropical oceans will lead to a further reduction in rainfall. However, global warming Global Circulation Models predict a further may also change the temperature gradient within warming of Africa in the 21st century, which could tropical and subtropical oceans, which would vary between 0.2 and 0.5°C per decade 15. The complicate predictions about rainfall patterns in rate of increase is expected to be even greater in Africa in the future. the Sahel, where temperatures may rise by 2-7°C over the next 80 years. This will have an enormous A report commissioned by Wetlands International impact on evaporation and increase water stress. shows how the effects of climate change and dams reinforce each other and reduce water Several studies confirm that Africa is one of the availability. The report which focused on the Inner most vulnerable continents to climate variability Niger Delta in Mali showed how the water needs and change because of the multiple stresses and for dams for hydropower and irrigation schemes a low adaptive capacity. It is estimated that by are taking an increased share of less rainfall. This 2020 between 75 and 250 million people in Africa means less water is flowing into the Inner Niger will be exposed to an increase of water stress Delta, reducing the extent of seasonal flooding, due to climate change. Agricultural production which is essential for downstream agriculture, will be severely compromised. In some countries for rejuvenating grazing lands and maintaining yields from rain fed agriculture could be reduced wetland habitats and biodiversity 17. by up to 50% by 2020; local food supplies will be negatively affected by decreasing fisheries resources in large lakes due to rising water temperatures, which may be exacerbated by continued over-fishing 16. Figure 17. Flood extent in the Inner Niger Delta, Mali compared to rainfall. 15 Hulme et al. 2001; Caminade et al. 2006. 16 IPCC 2007. Climate change 2007 17 Zwarts, L. A&W 2010 22 Wetlands International BIODIVERSITY LOSS AND THE GLOBAL WATER CRISIS
- 24. The Markala Dam in Mali has negative implications for the annual flooding of the downstream Inner Niger Delta. By Wetlands International Mali. Wetlands International BIODIVERSITY LOSS AND THE GLOBAL WATER CRISIS 23
- 25. 6 Looking to the future: drought, floods, famine and biodiversity loss The increased pressures on water resources and shortages. By the year 2025, it is estimated that wetlands, combined with climate change and nearly 230 million Africans will be facing water ecosystem loss provide a grim outlook for the scarcity, and 460 million will live in water-stressed future. Wetlands International believes that this countries 19. does not need to be our future. 6.2 More floods 6.1 Increasing water shortages The number and extremity of floods is expected It is expected that by 2025 more than 2.8 billion to increase severely in the coming decades. people in 48 countries will face conditions of water This is in line with the exponential increases in stress or scarcity. Forty of these countries are in flood frequency experienced globally over the the Middle East, North Africa or southern Africa. past fifty years (see Figure 19). Future trends are Over the next two decades, population increases likely to intensify owing to more extreme weather and growing demands are projected to push all conditions, combined with lower water retention the Middle Eastern countries into water scarcity capacity (due to the loss or degradation of conditions. By 2050, the number of countries ecosystems) and the melting of glaciers (causing facing water stress or scarcity could rise to 54, increased runoff. These floods are also likely to with a combined population of four billion people have more serious human consequences due to - about 40% of the projected global population of high population pressure and poor in infrastructure 9.4 billion 18. A large number of African countries, in many areas most vulnerable to floods. with a combined population of nearly 200 million people, are already facing serious water 18 Gardner-Outlaw T. and Engleman R. 1997 19 Falkenmark M., 1989. Figure 18. Change in freshwater availability: 2050 and 1990. 24 Wetlands International BIODIVERSITY LOSS AND THE GLOBAL WATER CRISIS
- 26. Figure 19. Number of floods per decade from the year 1950 to 2000. 6.3 Less food agricultural production is predicted to fall by 4% It has been projected that by 2080, the 40 poorest Asia. This in turn will increase demand for irrigation countries, located predominantly in tropical Africa (by a predicted 5% to 20% worldwide), making and Latin America, could lose between 10 and further demands on an already scarce natural 20 percent of their grain growing capacity due resource and perpetuating a cycle. to drought (Kotschi 2007). The biggest problem for food security will be the predicted increase in These pressures, which are leading to a rapid extreme weather events, such as droughts and increase in water use and biodiversity loss, need floods (Morton 2007). to be addressed. Governments should realise that many types of developments are limited by By 2025, 1.8 billion people will live in countries or water availability. This is particularly true of the regions with absolute water scarcity. By then, if use and production of biofuels, the shift in our current trends continue unabated, sub-Saharan diets towards animal proteins and the expansion Africa will have lost seventy five million hectares of of hydropower for our energy needs. Through land currently used for rain fed agriculture. This in guiding economical development, it is possible to turn will lead to a decline in domestic agricultural arrive at more sustainable solutions that are less production of up to 8% in sub-Saharan Africa. likely to have a negative influence on those with A similar pattern is predicted in Asia where vulnerable livelihoods. Figure 20. Changes in agricultural productivity in 2080 due to climate change. Wetlands International BIODIVERSITY LOSS AND THE GLOBAL WATER CRISIS 25
- 27. 7 How to overcome the crisis Many ecosystems that play a key role in meeting our water security needs and maintaining biodiversity have already been damaged. But experience also shows that these ecosystems can be restored, often profitably, as shown by many of the demonstration projects of Wetlands International (see www.wetlands.org). Young fisherman at the Mahakam river, East Kalimantan, Indonesia with his latest catch, an Ikan Toman or Giant Snakehead (Channa micropeltes). By Nyoman Suryadiputra. 26 Wetlands International BIODIVERSITY LOSS AND THE GLOBAL WATER CRISIS
- 28. 8 References AidEnvironment, 2008. Biofuels in Africa - An Kotschi, J. 2007. Agricultural biodiversity is assessment of risks and benefits for African essential for adapting to climate change. GAIA - wetlands. Commissioned by Wetlands Ecological Perspectives for Science and Society International, Wageningen. 16: 98-101. Zurich. Brown, M.E., and Funk C.C. 2008. Food security Lobell, D.B., Burke, M.B., Tebaldi, C., under climate change. Science 319: 580-581. Mastrandrea, M.D., Falcon, W.P., and Naylor R.L. 2008. Prioritizing climate change adaptation Dominguez-Faus, R., Powers, S.E., Burken, J.G. needs for food security in 2030. Science 319: and Alvarez, P.J., 2009. The Water Footprint of 607-610. Biofuels: A Drink or Drive Issue? Environmental Science & Technology 43, 3005-3010. http:// McAllister, D.E., A.L. Hamilton and B. Harvey, pubs.acs.org/doi/pdfplus/10.1021/es802162x. 1997: Global freshwater biodiversity: striving for the integrity of freshwater ecosystems. Sea Falkenmark M., 1989. Freshwater as a Factor Wind - Bulletin of Ocean Voice International 11(3): in Strategic Policy and Action. In: Davis K., 1-140. Bernstam M. and Sellers H. (eds.), Population and Resources in a Changing World, Morrison Morton, J.F. 2007. Climate change and food Institute for Population and Resource Studies, security special feature: the impact of climate Stanford, California. change on smallholder and subsistence agriculture. Proceedings of the National Academy Garcia N., A Cuttelod, and D Abdul Malak (eds.). of Sciences 104: 19680-19685. Washington DC. 2010. The status and distribution of freshwater biodiversity in northern Africa. Gland, Switzerland: Parry, M.L., Canziani, O.F., Palutikof, J.P., van IUCN. Xiii+141 pp. der Linden, P.J. and Hanson, C.E., (eds.) 2007. Summary for Policymakers. In: Climate Change Gardner-Outlaw T. and Engleman R. 2007: Impacts, adaptation and vulnerability. 1997, Sustaining Water, Easing Scarcity: A Contribution of Working Group II to the Fourth Second Update, Population Action International, Assessment Report of the Intergovernmental Washington DC. Panel on Climate Change. Cambridge University Press, Cambridge, UK, 7-22. IPCC, 2007. Climate change 2007: impacts, adaptation and vulnerability. Working group Ramsar, 2002. Climate change and wetlands: II contribution to the intergovernmental panel impacts, adaptation and mitigation. Information on climate change fourth assessment report. paper developed for Ramsar COP8 (DOC 11). Geneva, Switzerland. UNEP 2008, Vital Water Graphics - An Overview IWMI, 2007. Water for Food. Water for Life. of the State of the World’s Fresh and Marine A Comprehensive Assessment of Water Waters. 2nd Edition. UNEP, Nairobi, Kenya. ISBN: Management in Agriculture. IWMI, London, 92-807-2236-0. Colombo. Vescovi, L., Berteaux, D., Bird, D. and De Blois, Joosten, H. Greifswald University 2010, The S., 2009. The United Nations World Water Global Peat CO2 picture. Wetlands International, Assessment Programme, Scientific Paper, Wageningen. UNESCO. Wetlands International BIODIVERSITY LOSS AND THE GLOBAL WATER CRISIS 27
- 29. Vörösmarty, C. J. , McIntyre, P. B., Gessner, M. O., Dudgeon, D., Prusevich, A., Green, P., Glidden, S., Bunn, S. E., Sullivan, C. A., Reidy Liermann, C. and Davies, P. M., 2010. Global threats to human water security and river biodiversity, Nature 467, 555-561 (30 September 2010) doi:10.1038/nature09440. Wetlands International, Trisal C.L. and Kumar, R. 2008. Integration of High Altitude Wetlands into River Basin Management in the Hindu Kush Himalayas. Wetlands International South Asia, Delhi. Zhang, X.Y., Lu, X.G., 2009. Multiple criteria evaluation of ecosystem services for the Ruoergai Plateau Marshes in Southwest China, Ecol. Econ., doi:10.1016/j.ecolecon.2009.05.017. Zwarts, L. 2010. Will the Inner Niger Delta shrivel up due to climate change and water use upstream? Commissioned by Wetlands International. 28 Wetlands International BIODIVERSITY LOSS AND THE GLOBAL WATER CRISIS
- 30. Mission: Biodiversity loss and the emerging water crisis go hand in hand. Both are the result of the same root causes and each problem reinforces the To sustain and other. The stress from sectors that are increasingly using fresh water and restore wetlands, wetlands, combined with climate change and ecosystem loss provide a grim their resources and outlook. biodiversity for future generations. 70% of the Earth’s surface is water. However, only 0.3% of all global water is fresh surface water. In terms of area, less than 2% of the world’s surface consists of lakes, marshes, rivers or other freshwater wetlands. An estimated 126,000 described species rely directly on freshwater habitats. Only the preservation of water rich areas and healthy water flows ensures the survival of thousands of species. For further information please visit our website or contact our office. Wetlands International PO Box 471 6700 AL Wageningen The Netherlands Tel: +31 318 660 910 Fax: +31 318 660 950 E-mail: post@wetlands.org Website: www.wetlands.org Follow us on Twitter: WetlandsInt www.twitter.com/wetlandsint Watch our YouTube Channel: WetlandsInt www.youtube.com/user/wetlandsint