SlideShare a Scribd company logo
1 of 32
Download to read offline
www.jazzit.pro

December 21, 2011


SCORE DEMO
2nd Floor, 223 - 14th Street NW

Calgary Alberta T2N 1Z6

Attention: Mr. Giorgio Fontaine, President

Dear Mr. Fontaine:

We are pleased to provide you with our in-depth analytical Strategic Client Operations Results Evaluator (SCORE)
report of your operations for the year ended August 31, 2002. The SCORE report has been prepared based on
financial information, assumptions and estimates provided by management, and from external data sources where
available. While every attempt has been made to ensure the completeness and accuracy of the SCORE report,
please be advised that all of the information contained herein is obtained from sources believed to be accurate as
the data and methodologies will allow. However, because of the possibilities of human and mechanical errors
beyond our firm's control, readers are advised that the information is provided without warranty of any kind and are
advised to proceed with caution.

PURPOSE

The purpose of this SCORE report is to provide you, our valued client, with answers concerning the health of your
business. We accomplish this task by completing an in-depth look at your business using financial analytical tools.
This report will highlight areas of strengths and weaknesses in your business, while keeping in mind that the
ultimate goal is for you to turn those weaknesses into strengths. The SCORE report will also provide answers to
important questions including;
         What areas in the business need focus and improvement?
         Is the business able to meet short-term obligations when they come due?
         Are there historical trends that you are not aware of?
         Does the business have the ability to expand its operations through additional borrowing?
         If the need for additional financing is required, do the current financial statements look favourable to the
       lender?
         How does the business's performance stack up against similar competitors in the industry?

INTRODUCTION

Financial statements contain a wealth of information which can be used to assess past performance, current
financial condition, future potential, and the risk associated with that potential.

Ratio analysis is a valuable tool for understanding financial statements and the interpretation of ratios is
fundamental to determining the causes of business problems or successes. Ratio analysis consists of determining
certain relationships among financial items and comparing the results with those of prior years, other companies,
and industry averages. It also assesses a business against industry standards or benchmarks. Ratio analysis also
provides a benchmark to measure future performance and target future goals. Ratios are most effective when they
are used to highlight trends and should be compared with each other over several years. The absolute number is
not as important as the direction of the trend. In summary, ratio analysis can provide useful insight into investment
return, financial structure and management performance.


                 Suite 229, 2116 - 27 Avenue NE, Calgary, Alberta T2E 7A6   Ph: 403.670.7385   Fax: 403.670.7590
There are different types of financial ratios for different purposes which generally fall into four categories:
    Liquidity ratios:

     Liquidity is a measure of a business's ability to pay its current obligations as they become due. They are
     commonly used by bankers and suppliers to measure the creditworthiness of a business. These would include
     bank overdrafts, trade accounts payable and income taxes. Liquidity is of critical importance because of the
     severe consequences that may occur if the bills are not paid on time. Consequences can include creditors
     refusing to provide further goods or services; creditors can sue for payment and may go as far as to force the
     business into receivership or bankruptcy.
    Coverage ratios:

     Most businesses have short-term and long-term debt obligations, therefore coverage ratios measure the
     extent of debt used to finance operations by showing the relative use of borrowed funds as compared to
     resources invested by shareholder's. One area of concern is long-term debt obligations which require payment
     of fixed interest charges. Too much long-term debt can severely restrict management and increase risk to
     creditors because of the fixed interest charges that must be paid from earnings. Once a business exceeds a
     certain threshold, financing will no longer be available at conventional rates which will force them to seek out
     long-term financing at significantly higher interest rates.
    Profitability ratios:

     Profitability ratios are primarily "return on" ratios which measure "profit" against other significant financial
     statement items, such as shareholder's equity, sales and total assets. In other words, profitability ratios relate
     profit to management's performance by assessing how well management has employed assets to generate a
     profit on sales, and thereby create a return on shareholder's equity. Ratios such as return on sales help
     determine if a business is maximizing the bottom line. It is most common to analyze these ratios in light of the
     performance of competitors.
    Activity ratios:

     Often referred to as management performance ratios, they evaluate how effectively management uses assets
     to generate income. The ratios can also inform you of cash flow, inventory efficiency, and how quickly
     products or services sell. For example, a business can tell how well its collections policies are working by
     analyzing the company's receivables turnover ratio or average collections period.

REPORT FORMAT

The report is separated into two distinct segments as follows:

Segment 1

Segment 1 focuses on what are identified and considered as "key ratios" by financial executives, commercial
banks, corporate controllers, and creditors. The report defines each ratio, and determines your present year value
and comparable industry benchmark if available. It also indicates when to apply each ratio, and gives you our
recommendations if warranted.

Segment 2

Segment 2 contains various schedules containing comprehensive data including:

     Ratio components                        the individual ratio components of your financial statements with up to a
                                             five year comparison.

     Balance sheet                           a key of balance sheet accounts are listed with comparable
                                             benchmarks.

     Expenses as a % of total revenue        a schedule that compares income statement items with benchmarks.
                                             There is also a schedule showing up to five years for trends analysis.


Jazzit CaseWare Made Easy
Variance from expected expenses      a schedule that effectively illustrates what deviations from the
                                          benchmarks can mean in dollar amounts to a business. The schedule
                                          shows extracted benchmarks and a completed reverse calculation using
                                          your total revenues to extrapolate what the expected expenses should
                                          be.

     Key ratios                           a schedule that shows ratios and benchmarks where available. There is
                                          also a schedule showing up to five years for trends analysis.


All benchmark information contained within the following schedules are either from benchmarks supplied by our
firm or from data supplied by Industry Canada, where available. Industry Canada has compiled the benchmark data
from tax returns submitted to Canada Revenue Agency (CRA) from the reporting division that is responsible for
revenue filings between $30 thousand and $5 million inclusive.

We trust you will find SCORE valuable in assisting you in understanding your business more fully. Should you have
further questions or require further clarification, please do not hesitate to contact us by email at or call .


Yours truly,


Partner name
Firm name


Jazzit CaseWare Made Easy
Current Ratio (times)

Type of ratio: Liquidity

Ratio definition: [ Current Assets / Current Liabilities ]

Ratio status: Your current ratio is 2.2 times, whereas the prior year was 0.3 times.

Desired trend: An increasing number

What it is:

The current ratio is one of the standard measurements of any business's financial health. The current ratio helps
you determine if you have enough working capital to meet your short term financial obligations. Although high
liquidity may indicate a good ability to meet short-term obligations, it is not always desirable. Liquid assets may
generate returns in the form of interest on short-term securities. However, these returns are generally lower than
what can be obtained from investing the funds in the normal operations of the firm. The general benchmark for the
current ratio of a healthy business is 1.5 to 2 times, meaning it has about twice as many current assets as current
liabilities. This should be compared to other companies in the same industry. A current ratio under 1.5 times may
indicate an inability to pay current financial obligations with a measure of safety. A number above 2.0 times may
indicate that current assets are excessive and capital is under employed, which could indicate problems such as
too much inventory. There are some businesses, especially cash businesses (no receivables), that can operate
comfortably with a lower ratio. The importance of this ratio is that a declining current ratio over several years
indicates that a business could be draining its working capital to pay for capital (long term) assets. Unless there
was excess working capital to begin with, the company may find itself backed into a corner with a tight working
capital position.

When to apply it:

The current ratio should be part of your business's basic financial planning strategy. It's important to keep a close
eye on this figure as it is an early indicator if things start to get out of line. Early warning signs mean the ability to
take early action on your part to prevent your business from ending up in a much more difficult situation later.

Recommendations:

We recommend that you ....


                                                      Current Ratio

                              2.0


                              1.5
                      Times


                              1.0


                              0.5


                              0.0
                                    1998       1999          2000          2001          2002


Jazzit CaseWare Made Easy
Quick Ratio (times)

Type of ratio: Liquidity

Ratio definition: [ Quick Assets / Quick Liabilities ]

Ratio status: Your quick ratio is 0.7 times whereas prior year was 0.2 times.

Desired trend: An increasing number

What it is:

Like the current ratio, the quick ratio (also sometimes called the acid test ratio) measures a business's liquidity. It
provides a test of the ability to meet the immediate demands of creditors by excluding prepaids and inventory which
is more difficult to turn into cash on a short notice than marketable securities and accounts receivable.               It
calculates a business's liquid assets in relation to its liabilities. The higher the ratio is, the higher your business's
ability to meet its obligations. Such information is of particular significance to bankers and short-term creditors who
look at the quick ratio to determine the business's ability to repay loans and weather financial crisis. Loans are often
tied to a minimum quick ratio. A general benchmark is 1.0 times which indicates a good liquid position unless the
majority of your "quick assets" are in accounts receivable and the pattern of accounts receivable collection lags
behind the schedule for paying current liabilities. A consistently high ratio may indicate an unnecessary
accumulation of funds that are not required for ongoing operations and therefore, are unproductive. You can also
use the quick ratio to evaluate the financial health of potential customers since it also indicates whether a business
can pay off its debts quickly.

When to apply it:

This is an important planning tool especially for businesses that can tie up a lot of assets in inventory. By tracking it
monthly, you can keep an eye out for negative trends that could hamper your business's ability to meet its
obligations.

Recommendations:

We recommend that you ...


                                                      Quick Ratio
                              1.0

                              0.8

                              0.6
                      Times


                              0.4

                              0.2

                              0.0
                                    1998       1999          2000          2001          2002


Jazzit CaseWare Made Easy
Current Debt to Equity (percent)

Type of ratio: Liquidity

Ratio definition: [ ( (Current Liabilities)*100 ) / Owners' Equity ]

Ratio status: Your current debt to equity is 10.8% whereas prior year was 73.5%.

Desired trend: A decreasing number

What it is:

This liquidity ratio indicates the relative proportion of debt to shareholder's equity used to finance a company's
assets. This ratio provides guidance on the company's capital structure and its relative ability to meet short-term
debt obligations.

When to apply it:

Apply this ratio to determine the company’s relative ability to meet current debt obligations.

Recommendations:

We recommend that you ...


                                                Current Debt to Equity

                                   100

                                    80
                      Percentage


                                    60

                                    40

                                    20

                                     0
                                         1998   1999          2000        2001          2002


Jazzit CaseWare Made Easy
Debt to Equity Ratio (times)

Type of ratio: Coverage

Ratio definition: [ Total Liabilities / Owners' Equity ]

Ratio status: Your debt to equity ratio is 0.7 times whereas prior year was 0.8 times.

Desired trend: A decreasing number

What it is:

This ratio indicates how much the business relies on borrowed funds to finance its operations. The higher the ratio,
the greater is the dependence on borrowed funds. A high debt to equity ratio could indicate that the company may
be over-leveraged and should look at ways of reducing its debt. Generally, the higher the ratio, the greater the
financial risk for creditors. Too much debt results in increased interest charges which reduces the earnings
available for dividends. In times of recession, large interest charges or increasing interest rates could cause a
financial crisis. A low ratio, which is generally regarded as an indication of financial strength and stability, may
indicate that an entity is not realizing its profit potential. Conversely, a highly leveraged business may be
maximizing profits but could also be courting financial disaster in an economic downturn. An increasing ratio
indicates that a business is funding its growth primarily through debt. If this trend continues on a long-term basis,
indicating weakness in the business, lenders will refuse to provide further credit. As a general rule, lenders could
become concerned with a debt to equity ratio in excess of 3.0 times or even 2.0 times. Clearly, this ratio is
important to lenders. Generally the higher this ratio, the more risky a creditor will perceive its exposure thereby
making it correspondingly harder to obtain credit.

When to apply it:

Equity and debt are two key figures on a financial statement. Lenders or investors often use the relationship of
these two figures to evaluate risk. The ratio of your business's equity to its long-term debt provides a window into
how strong its finances are, so if you're considering obtaining credit for future expansion or operations, use this
ratio to check the health and probability of securing that anticipated loan.

Recommendations:

We recommend that you ...


                                                 Debt to Equity Ratio
                              1.5


                              1.0
                      Times


                              0.5


                              0.0
                                    1998       1999        2000         2001         2002


Jazzit CaseWare Made Easy
Interest Coverage Ratio (times)

Type of ratio: Coverage

Ratio definition: [ (Net Income + Interest + Income Tax) / Interest ]

Ratio status: Your interest coverage ratio is 4.2 times whereas prior year was 2.9 times.

Desired trend: An increasing number

What it is:

This ratio measures the ability to pay interest charges on debt and to protect creditors from interest payment
default. The interest coverage ratio compares your net operating profit, before interest expense, to the interest
expense for the year. Simply put, the interest coverage ratio assesses financial strength and stability and is of
particular importance to businesses that are highly leveraged. When interest rates are rising, the interest coverage
ratio is very important as it provides a measure of a business's ability to meet its interest commitments from
earnings. A steady or rising trend is favourable whereas a weakening or declining trend is usually a danger signal.
Acceptable interest coverage varies from industry to industry. This ratio must be least 1.0 times for the firm to be
able to pay interest from operating profits, however, as there are other obligations that the firm must pay, in
practice, the ratio should generally be higher than this.

When to apply it:

Use this ratio to evaluate if your business is carrying too much debt or paying too much in interest charges.
Compare this ratio to benchmarks in your industry to see how you rank. Also, if you're considering borrowing funds
for future expansion or operations, use this ratio to determine how much debt the business can potentially service.

Recommendations:

We recommend that you ...


                                             Interest Coverage Ratio

                             5

                             4
                     Times


                             3

                             2

                             1

                             0
                                 1998        1999         2000          2001        2002


Jazzit CaseWare Made Easy
Debt Ratio (times)

Type of ratio: Coverage

Ratio definition: [ Total Liabilities / Total Assets ]

Ratio status: Your debt ratio is 0.4 times whereas prior year was 0.4 times.

Desired trend: A decreasing number

What it is:

This ratio indicates what portion of the total invested capital is being financed by long-term debt. This ratio varies
widely from industry to industry and there is no benchmark for determining what is an acceptable debt component
in the total invested capital structure. A firm with high debt ratio faces high interest charges on its income. During
bad economic times, the firm may have difficulty in generating cash flow to cover these charges. The higher the
ratio, the higher is the firm's exposure to risk. Therefore, too high a ratio is not desirable. On the other hand, it does
make sense to have some debt especially if the rate of return is higher than the cost of borrowing. This ratio is of
interest to investors, creditors and banks.

When to apply it:

You will want to be vigilant as to how much you have leveraged your business. There may come a time in the near
future where you require further financing to expand your business. If your debt ratio is too high, getting further
financing will be difficult because of the increased risk to the lender. With any borrowing, one of your basic
considerations is the return must be higher than the cost of borrowing.

Recommendations:

We recommend that you ...


                                                         Debt Ratio
                              0.6

                              0.5

                              0.4
                      Times


                              0.3

                              0.2

                              0.1

                              0.0
                                    1998        1999          2000         2001          2002


Jazzit CaseWare Made Easy
Cash Flow From Operations to Total Debt (times)

Type of ratio: Coverage

Ratio definition: [ (Net Income + Amortization + Non Cash Items) / Total Debt ]

Ratio status: Your cash flow from operations to total debt is 0.2 times whereas prior year was 0.2 times.

Desired trend: An increasing number

What it is:

This ratio measures a business's ability to repay borrowing and to leverage itself. The statement of income may
include many non-cash deductions such as amortization, and therefore it does not necessarily reflect a clear
picture of the business's cash flow. The cash flow is considered by many as a superior indicator of earning power
which shows the business's ability to repay debts and finance expansion. Cash flow is considered a particularly
useful measure for comparing entities in the same industry; it can reveal an entity's ability to repay debts even
though there may be little or no net earning after amortization and write-offs. This ratio is of significant interest to
many user groups including investors and creditors.

When to apply it:

If you are thinking about additional financing and want to know if you have the cash flow to service and repay the
debt, this ratio will certainly assist you in making that determination.

Recommendations:

We recommend that you ...


                                      Cash Flow From Operations to Total Debt
                              0.30

                              0.25

                              0.20
                      Times


                              0.15

                              0.10

                              0.05

                              0.00
                                     1998      1999          2000         2001          2002


Jazzit CaseWare Made Easy
Net Fixed Assets to Equity (percent)

Type of ratio: Coverage

Ratio definition: [ ( (Net Fixed Assets)*100 ) / Owners' Equity ]

Ratio status: Your net fixed assets to equity is 131.4% whereas prior year was 141.9%.

Desired trend: A decreasing number

What it is:

This percentage provides guidance regarding the company's relative ability to cover long-term assets with the
business's equity.

When to apply it:

Employ this ratio to measure the relative extent to which the company has utilized debt to finance, typically non-
liquid fixed assets. A percentage greater than 100% indicates at least some of these assets are financed by debt.

Recommendations:

We recommend that you ...


                                               Net Fixed Assets to Equity
                                  200


                                  150
                     Percentage


                                  100


                                   50


                                    0
                                        1998     1999       2000        2001       2002


Jazzit CaseWare Made Easy
Collection Period for Accounts Receivable (days)

Type of ratio: Coverage

Ratio definition: [ Accounts Receivable / Average Daily Revenue ]

Ratio status: Your collection period for accounts receivable is 1.4 days whereas prior year was 3.0 days.

Desired trend: A decreasing number

What it is:

This ratio calculates the average number of days required to collect receivables from the date of the transaction. A
lower figure indicates the company has an effective collection policy.

When to apply it:

This measurement is particularly useful when a company carries a material accounts receivable balance in the
normal course of its operations. Use this relative measure to ensure that collection periods are within the
company’s policies and to detect a possible build-up of uncollectible receivables.

Recommendations:

We recommend that you ...


                                    Collection Period for Accounts Receivable
                            3.0

                            2.5

                            2.0
                     Days


                            1.5

                            1.0

                            0.5

                            0.0
                                  1998       1999         2000         2001          2002


Jazzit CaseWare Made Easy
Return on Sales (percent)

Type of ratio: Profitability

Ratio definition: [ Net Income / Total Sales ]

Ratio status: Your return on sales is 7.0% whereas prior year was 5.4%.

Desired trend: An increasing number

What it is:

Return on sales is also referred to as "net profit margin". This measurement is often referred to as the bottom line,
taking into account all expenses including interest. It also reflects management's ability to effectively control the
level of costs in relation to revenues generated from the business. The ratio is expressed as a percentage; for
example 10% of sales is being generated as net earnings and is one of the most popular means of evaluating the
profitability of a business because the data is readily available and easy to compute. This ratio varies widely from
industry to industry. The average for companies is 5.5% but the figures vary from 0.75% for supermarkets to 40%
for some software companies. This ratio is of interest to investors and creditors.

When to apply it:

One of the vital parts of a healthy business is to make sure your net profit margins are in line with industry norms.
Looking at trends such as prior year's margins, the budgeted or anticipated margin is also important. An increasing
net profit margin is a positive indicator. If the current profit margin is below a desirable level, management must
seek ways of increasing revenues, decreasing cost of goods sold, decreasing operating expenses, or a
combination of these items. A plan of action should only be taken once a detailed analysis of sales, cost of goods
sold, and operating and administrative expenses has been completed.

Recommendations:

We recommend that you ...


                                                  Return on Sales
                                   15


                                   10
                      Percentage


                                    5


                                    0
                                        1998   1999        2000         2001         2002


Jazzit CaseWare Made Easy
Net Profit to Equity (percent)

Type of ratio: Profitability

Ratio definition: [ Net Income / Average Owners' Equity ]

Ratio status: Your net profit to equity is 11.4% whereas prior year was 9.8%.

Desired trend: An increasing number

What it is:

This ratio measures the adequacy of the return on capital invested by shareholder's and represents their measure
of profitability and indirectly the business's performance in using assets to generate earnings. For example, net
income after taxes of 15% is being generated on common shareholder's equity. When using this ratio, it is
important to be aware that there is no general rule of thumb as it varies from industry to industry.

This ratio is being calculated based on an average balance.

When to apply it:

You want to be sure that you are getting a fair return for your capital invested and the associated risks taken in the
business. If you are getting a return of 4% on your equity and the financial institutions are paying 6% on term
deposits where no risk is involved, it definitely is time to step back and re-evaluate the core business.

Recommendations:

We recommend that you ...


                                                 Net Profit to Equity
                                   20


                                   15
                      Percentage


                                   10


                                    5


                                    0
                                        1998   1999        2000          2001         2002


Jazzit CaseWare Made Easy
Gross Profit Margin (percent)

Type of ratio: Profitability

Ratio definition: [ Gross Profit / Net Sales ]

Ratio status: Your gross profit margin is 63.1% whereas prior year was 60.2%.

Desired trend: An increasing number

What it is:

The gross profit margin indicates the efficiency of management in using its materials and labour in the production
process. It shows the percentage of net sales remaining after subtracting cost of goods sold. A high gross profit
margin indicates that a business can make a reasonable profit on its sales, as long as it keeps overhead costs in
control. This ratio varies from industry to industry depending on factors such as competition, capital investment, and
level of expenses other than cost of sales. Unless a business has an adequate gross profit, it cannot be profitable
or finance essential expenditures such as research and development, or advertising. A ratio less than one means
you are selling your product for less than it costs to produce. If this ratio remains less than one, you will not achieve
profitability regardless of your volume or the efficiency of the rest of your business.

When to apply it:

This figure answers the question, "Am I pricing the goods or services properly?" A low margin - especially in
relation to industry norms - could indicate you are under-pricing. If sales are slow and profits weak, it could indicate
overpricing due to a high margin. This is most useful when viewed in relation to the business's past performance
and the industry average.

Recommendations:

We recommend that you ...


                                                  Gross Profit Margin
                                   60

                                   50
                      Percentage


                                   40

                                   30

                                   20

                                   10

                                    0
                                        1998     1999        2000         2001          2002


Jazzit CaseWare Made Easy
Return on Total Assets (percent)

Type of ratio: Profitability

Ratio definition: [ ( Total Revenue - (Total Cost of Sales + Total Expenses - Interest Expenses) ) / Average
                       Total Assets ]

Ratio status: The return on total assets is 9.3% whereas prior year was 8.7%.

Desired trend: An increasing number

What it is:

This number tells you how effective your business has been at employing its assets to work. This ratio relates the
operating performance to the investments that the business has made, without regard to how the acquisition of
those investments was financed. This ratio is useful when compared with the interest rate paid on the company's
debt. For example, if the return on total assets ratio is 15 percent and the interest rate paid on its debt was 10
percent, the business's profit is 5 percentage points more than it paid in interest. The return is of particular interest
to lenders and creditors in assessing financial leverage. The return varies from industry to industry.

This ratio is being calculated based on an average balance.

When to apply it:

Return on total assets is an indicator of how profitable a company is. Use this ratio annually to compare your
business's performance to your industry's norms. If your return on assets is lower than a competitor, it may be an
indication that they have found a more efficient means to operate through financing, technology, quality control, or
inventory management.

Recommendations:

We recommend that you ...


                                               Return on Total Assets

                                   12

                                   10
                      Percentage


                                    8

                                    6

                                    4

                                    2

                                    0
                                        1998   1999          2000         2001          2002


Jazzit CaseWare Made Easy
Revenue to Equity Ratio

Type of ratio: Profitability

Ratio definition: [ Total Revenue / Owners' Equity ]

Ratio status: Your revenue to equity ratio is 1.6 times whereas prior year was 1.7 times.

Desired trend: An increasing number

What it is:

This ratio measures the profitability of a business and indicates the level of revenue being supported by each $1 of
equity. The higher the percentage, the relatively better the profitability is.

When to apply it:

Use of this ratio can help to determine if the business has sufficient equity to support the current sales and
projected growth in sales. It can also indicate when a business has accumulated too much equity (retained
earnings) and may consider either a stock repurchase or dividend payout.

Recommendations:

We recommend that you ...


                                            Revenue to Equity Ratio

                              2.5

                              2.0
                      Times


                              1.5

                              1.0

                              0.5

                              0.0
                                    1998     1999         2000         2001          2002


Jazzit CaseWare Made Easy
Revenue to Closing Inventory Ratio (times)

Type of ratio: Activity

Ratio definition: [ Total Revenue / Closing Inventory ]

Ratio status: Your revenue to closing inventory ratio is 10.5 times whereas prior year was 18.4 times.

Desired trend: An increasing number

What it is:

This ratio, indicates how efficiently the company converts inventory into revenue over a period.

When to apply it:

Use this ratio to determine if the inventory on hand is sufficient to support the current sales level. If this ratio
increases over time it may indicate that inventory is becoming obsolete.

Recommendations:

We recommend that you ...


                                          Revenue to Closing Inventory Ratio
                              30

                              25

                              20
                      Times


                              15

                              10

                               5

                               0
                                   1998         1999       2000         2001          2002


Jazzit CaseWare Made Easy
Inventory Turnover (days)

Type of ratio: Activity

Ratio definition: [ Cost of Sales / (Average Inventory/365 Days) ]

Ratio status: Your inventory turnover is 74.5 days whereas prior year was 48.4 days.

Desired trend: A decreasing number

What it is:

This ratio measures how efficiently a business turns over inventory during the course of the year. The ratio is often
expressed in days by dividing the inventory turnover ratio into 365 days. For example, inventory turnover is 5 times
during the year, which means it takes an average of 73 days to sell and replace the business's inventory. Inventory
turnover ratio varies significantly from industry to industry. A high turnover ratio in comparison to the average for the
industry usually means good inventory management. A high turnover ratio may result from a dramatic improvement
in the economy or improved merchandising, but it could also mean lost sales because of inadequate inventory on
hand.

Alternatively, a low turnover ratio in comparison to the average for the industry usually means poor inventory
management, possibly signalling a weakening economy, obsolete or damaged inventory, unsalable goods,
overstock or overvalued inventory. In addition, if a large amount of capital is tied up in inventory, it may be more
efficiently used elsewhere, such as reducing short term borrowing to reduce interest carrying costs.

When to apply it:

If your business has significant assets tied up in inventory, tracking your turnover is critical to successful financial
planning. If a trend indicates a continual increasing ratio, this is a red flag for management to give more attention to
inventory control, which may indicate current marketing efforts are inadequate and possibly market share is being
lost, and a change is necessary.

Recommendations:

We recommend that you ...


                                                 Inventory Turnover


                             60
                      Days


                             40


                             20


                              0
                                   1999             2000             2001             2002


Jazzit CaseWare Made Easy
Working Capital Turnover Ratio

Type of ratio: Activity

Ratio definition: [ Cost of Sales / Net Working Capital ]

Ratio status: Your working capital turnover ratio is 4.7 times, whereas the prior year was (1.3) times.

Desired trend: An increasing number

What it is:

The working capital turnover ratio measures the efficiency with which the working capital is being used by a firm. A
high ratio indicates efficient utilization of working capital and a low ratio indicates otherwise. A very high working
capital turnover ratio may also mean lack of sufficient working capital which is not a good situation.

When to apply it:

Use this ratio to analyze how effectively a company is using its working capital to generate sales.

Recommendations:

We recommend that you ....


                                          Working Capital Turnover Ratio

                              8

                              6

                              4
                      Times


                              2

                              0

                              -2


                                   1998      1999           2000         2001         2002


Jazzit CaseWare Made Easy
Actual Compared to Expected Expenses Based on Total Revenue (dollars)

What it is:

This is a measurement of key expenses including cost of goods sold, occupancy (includes amortization, repairs
and maintenance, utilities, and rent), financial (includes interest and professional fees), general (includes
advertising, delivery, and insurance), and wages (includes wages, salaries and benefits) in comparison to
benchmark or expected expenses based on this year's actual total revenue. Total revenue includes revenue from
the sale of goods and services, interest, dividends, commissions, rent and other sources of revenue. It excludes
capital gains or losses, extraordinary gains or losses, and equity in net income of related parties.

When to apply it:

To see if your expenses are in the "ball park" in relation to comparable industry benchmarks, the graph below
illustrates a comparison of expected expenses to your actual expenses. Large variations will indicate that further
investigation is warranted.

Recommendations:

We recommend that you ...


                             Actual Compared to Expected Expenses
                                       Based on Current Year Total Revenue

                                      Actual                                 Expected
              300,000

              200,000
         $


              100,000

                    0
                        COGS          Wages      Occupancy     Financial     General        Other


Jazzit CaseWare Made Easy
Current Year Expenses (percent)

What it is:

This is a summary of key expense areas in the income statement for the current year. The operating expense ratios
measure the efficiency of management in controlling operating expenses. They are expressed as a percentage by
dividing expenses, including cost of goods sold, occupancy (includes amortization, repairs and maintenance,
utilities, and rent), financial (includes interest and professional fees), general (includes advertising, delivery, and
insurance), wages (includes wages, salaries and benefits) and other indirect expenses by total revenue. Total
revenue includes revenue from the sale of goods and services, interest, dividends, commissions, rent and other
sources of revenue. It excludes capital gains or losses, extraordinary gains or losses, and equity in net income of
related parties.

When to apply it:

It is of importance that you keep an eye on the expense ratios to make sure they are in line with your budgets and
expectations. An excellent example is in the area of "cost of sales". Businesses generally want to see this ratio
decreasing which means their direct costs to produce sales are costing less, thereby resulting in increased
profitability.

Recommendations:

We recommend that you ...


                                Current Year Expenses (including COGS)
                                                                  8.7% Net profit


                                                                              5.6% Other indirect expenses

                                                                                    2.8% General


                                                                                        6.2% Financial
                 COGS 36.9%


                                                                                           7.8% Occupancy


                                                                   31.9% Wages


Jazzit CaseWare Made Easy
Altman Z Score

Type of ratio: Other

Ratio definition: [ ( (Working Capital/Total Assets) x 6.56 ) + ( (Retained Earnings/Total Assets) x 3.26 ) + (
                       (Earnings Before Interest & Taxes/Total Assets) x 6.72 ) + ( (Total Equity/Total
                       Liabilities) x 1.05 ) ]

Ratio status: Your Altman Z score is 4.8 whereas prior year was 2.0.

Desired trend: An increasing number

What it is:

This analytical procedure was developed by Edward Altman by combining various ratios to produce Z-scores. Z-
scores below the threshold value of 2.6 indicate that the overall financial condition of the company and continued
existence is questionable. Z-scores below 1.8 indicate that there is a strong potential for the business to be
bankrupt within the next two years. A score between 1.8 and 2.6 is inconclusive. Remarkably, Altman's procedure
has a proven 95% accuracy within the first year and 83% accuracy within two years. For any business, a Z-score
above 3.0 is desirable as it indicates a healthy business.

When to apply it:

Use this procedure to assess your business's financial risk. Rather than looking at this procedure as a predictor of
business failure, view it more as a procedure that raises red flags to help identity which individual ratios warrant a
closer look. Once identified, take immediate action to mitigate the potential business failure looming on the horizon.

Recommendations:

We recommend that you ...


                                                    Altman Z Score
                               5


                               4


                               3
                       Score


                               2


                               1


                               0
                                   1998      1999          2000         2001          2002


Jazzit CaseWare Made Easy
SCORE DEMO
Jazzit Score
Year end: August 31, 2002


Ratio Components
                                                        2002               2001               2000                 1999               1998

Assets
    Current - trade receivable (TR)              $             3,244   $          7,118   $          7,230   $            1,589   $          2,694
    Current -other quick (QA)                                 35,758             52,414             43,051               38,142             92,949
    Current -inventory (IN)                                   80,797             47,613             44,776               43,162             35,261
    Current -other (CA)                                        5,508              6,807              4,664                8,280              8,621
    Capital - amortized cost (FD)                         358,110            353,402            346,209              333,573            304,751
    Capital - non amortized cost (FN)                     510,271            510,271            510,271              510,271            510,271
    Capital - accumulated amortization (FA)               (163,995)         (144,886)          (123,481)            (100,605)           (75,102)
    Intangible assets (IA)                                -                  -                  -                    -                  -
    Other asset (OA)                                          59,021             66,019             76,977               70,214             66,153

                           Total Assets          $        888,714      $     898,758      $     909,697      $       904,626      $     945,598

Liabilities
    Current - trade payable (TP)                 $            37,576   $         36,460   $         35,300   $           38,266   $         44,794
    Current - other (CL)                                      20,434         335,594            172,347              412,865                51,776
    Long term (LL)                                        294,619                20,272         242,715                  36,853         468,145

                       Total Liabilities                  352,629            392,326            450,362              487,984            564,715

Equity
    Equity - share capital (EQ)                                  40                 40                 40                   40                 40
    Equity - retained earnings (RE)                       566,046            506,392            497,294              465,302            396,094
    Equity - dividend (DI)                                 (30,000)          -                  (38,000)             (48,700)           (15,251)

                           Total Equity                   536,086            506,432            459,334              416,642            380,883

         Total Liabilities and Equity            $        888,715      $     898,758      $     909,696      $       904,626      $     945,598

* Indicates adjustments have been applied in current or prior periods.


                                                                                                     Prepared by    Reviewed by             SCORE
                                                                                                                                            Pg 1 of 9
SCORE DEMO
Jazzit Score
Year end: August 31, 2002


Ratio Components
                                             2002               2001               2000                 1999               1998

Revenue
   Revenue - trade sales (SA)            $     851,844      $     875,105      $     906,686      $       943,325      $   1,035,218
   Revenue - other sales (SO)                         31                508                593                  799                959
   Revenue - other (RO)                        -                  -                  -                         2,439              5,348

                       Total Revenue           851,875            875,613            907,279              946,563          1,041,525

Expenses - Cost of Sales
   Amortization (CD)                           -                  -                  -                    -                  -
   Change in inventory (CN)                    -                  -                  -                    -                  -
   Interest (CI)                               -                  -                  -                    -                  -
   Purchase (PU)                               -                  -                  -                    -                  -
   Repairs and maintenance (CR)                -                  -                  -                    -                  -
   Other costs of sales (CS)                   314,440            348,209            340,568              350,049            395,774

                   Total Cost of Sales         314,440            348,209            340,568              350,049            395,774

Expenses - Other
   Amortization (OD)                               19,109             21,404             22,877               25,503             23,309
   Non-cash (ON)                               -                  -                  -                    -                  -
   Income tax expense (IT)                         14,516             12,453             16,397               20,885             35,769
   Interest (OI)                                   23,032             31,138             33,090               35,029             41,025
   Repairs and maintenance (OR)                    19,633              5,855             20,109               29,688              7,051
   Other expenses (OE)                         401,490            409,456            393,547              400,950            388,587

                      Total Expenses           477,780            480,306            486,020              512,055            495,741

     Operating Income (Loss) (NI)        $         59,655   $         47,098   $         80,691   $           84,459   $     150,010


                                                                                          Prepared by    Reviewed by             SCORE
                                                                                                                                 Pg 2 of 9
SCORE DEMO
Jazzit Score
Year end: August 31, 2002


Balance Sheet ('000)              Industry: Full service restaurant - 7221 Benchmark: Blank
                                               Current Year                     Previous Year
Description                                                     Benchmark                       Comments
                                                 Actual                            Actual

 Total assets                                           888.7        -                 898.8


   Total current assets                                 125.3        -                 114.0


     Accounts receivable and notes                        3.2        -                   7.1


     Closing inventory                                   80.8        -                  47.6


     Other current assets                                41.3        -                  59.2


   Net capital assets                                   704.4        -                 718.8


   Other assets and adjustments                          59.0        -                  66.0


 Total liabilities                                      352.6       -                  392.3


   Total current liabilities                             58.0       -                  372.1


     Current bank loans                             -               -                  324.0


     Other current liabilities                           58.0       -                   48.1


   Long-term liabilities                                294.6       -                   20.3


 Total equity                                           536.1       -                  506.4


                                                                                        Prepared by   Reviewed by   SCORE
                                                                                                                    Pg 3 of 9
SCORE DEMO
Jazzit Score
Year end: August 31, 2002


Expenses as a Percentage of Total Revenue                 Industry: Full service restaurant - 7221    Benchmark: Blank
Expenditure                                        Current Year Actual                 Benchmark     Variance             Previous Year Actual               Comments

 Cost of goods sold (direct)              314,440     /     851,875    =      36.9        -             36.9     348,209      /   875,613    =      39.8

   Wages and benefits                        -        /     851,875    =     -            -            -            -         /   875,613    =     -

   Purchase, materials & sub-contracts    314,440     /     851,875    =      36.9        -             36.9     348,209      /   875,613    =      39.8

   Opening inventory                         -        /     851,875    =     -            -            -            -         /   875,613    =     -

   Closing inventory                         -        /     851,875    =     -            -            -            -         /   875,613    =     -

 Operating expenses (indirect)            463,263     /     851,875    =      54.4        -             54.4     467,852      /   875,613    =      53.4

   Labour and commissions                 271,950     /     851,875    =      31.9        -             31.9     262,116      /   875,613    =      29.9

   Amortization and depletion             19,109      /     851,875    =         2.2      -                2.2   21,404       /   875,613    =         2.4

   Repairs and maintenance                19,633      /     851,875    =         2.3      -                2.3    5,855       /   875,613    =         0.7

   Utilities and telephone/telecom        26,432      /     851,875    =         3.1      -                3.1   26,593       /   875,613    =         3.0

   Rent                                    1,123      /     851,875    =         0.1      -                0.1    313         /   875,613    =     -

   Interest and bank charges              23,032      /     851,875    =         2.7      -                2.7   31,138       /   875,613    =         3.6

   Professional and business fees         29,791      /     851,875    =         3.5      -                3.5   29,548       /   875,613    =         3.4

   Advertising and promotion              15,192      /     851,875    =         1.8      -                1.8   17,832       /   875,613    =         2.0

   Delivery, shipping and warehouse exp      -        /     851,875    =     -            -            -            -         /   875,613    =     -

   Insurance                               9,064      /     851,875    =         1.1      -                1.1    9,270       /   875,613    =         1.1

   Other expenses                         47,937      /     851,875    =         5.6      -                5.6   63,783       /   875,613    =         7.3

 Total expenses                           777,703     /     851,875    =      91.3        -             91.3     816,061      /   875,613    =      93.2

 Net profit / loss                        74,172      /     851,875    =         8.7      -                8.7   59,552       /   875,613    =         6.8


                                                                                                                                  Prepared by    Reviewed by       SCORE
                                                                                                                                                                   Pg 4 of 9
SCORE DEMO
Jazzit Score
Year end: August 31, 2002


5 Year Expenses as a Percentage of Total Revenue

                                    2002       2001         2000       1999        1998
Expenditure                        Actual      Actual      Actual      Actual      Actual        Comments

Cost of goods
                                        36.9        39.8        37.5        37.1        38.2
sold (direct)


   Wages and benefits               -           -           -           -           -


   Purchases, materials and
                                        36.9        39.8        37.5        37.1        38.2
   sub-contracts


   Opening inventory                -           -           -           -           -


   Closing inventory                -           -           -           -           -


Operating expenses
                                        54.4        53.4        51.8        52.0        44.4
(indirect)


   Labour and commissions               31.9        29.9        29.8        28.8        24.4


   Amortization and depletion            2.2         2.4         2.5         2.7         2.2


   Repairs and
                                         2.3         0.7         2.2         3.1         0.7
   maintenance


   Utilities and telephone/tele-
                                         3.1         3.0         2.6         2.4         2.2
   communications


   Rent                                  0.1    -                0.1    -                0.1


   Interest and bank charges             2.7         3.6         3.6         3.7         4.0


   Professional and business
                                         3.5         3.4         3.6         3.6         3.3
   fees


   Advertising and promotion             1.8         2.0         1.2         1.5         0.9


   Delivery, shipping and
                                    -           -           -           -           -
   warehouse expenses


   Insurance                             1.1         1.1         0.9         0.9         0.8


   Other expenses                        5.7         7.3         5.3         5.3         5.8


Total expenses                          91.3        93.2        89.3        89.1        82.6


Net profit / loss                        8.7         6.8        10.7        10.9        17.4


                                                                                        Prepared by   Reviewed by   SCORE
                                                                                                                    Pg 5 of 9
SCORE DEMO
Jazzit Score
Year end: August 31, 2002


Variance From Expected Expenses
                                                                           Current Year Expected                     $
Expenditure                                 Current Year Actual                                                                  Comments
                                                                  Total Revenue x Benchmark = Expected Expense   Variance

 Cost of goods sold (direct)                         314,440         851,875     x     -    =         -            314,440

   Wages and benefits                                 -              851,875     x     -    =         -             -

   Purchases, materials and sub-contracts            314,440         851,875     x     -    =         -            314,440

   Opening inventory                                  -              851,875     x     -    =         -             -

   Closing inventory                                  -              851,875     x     -    =         -             -

 Operating expenses (indirect)                       463,263         851,875     x     -    =         -            463,263

   Labour and commissions                            271,950         851,875     x     -    =         -            271,950

   Amortization and depletion                         19,109         851,875     x     -    =         -             19,109

   Repairs and maintenance                            19,633         851,875     x     -    =         -             19,633

   Utilities and telephone / telecom                  26,432         851,875     x     -    =         -             26,432

   Rent                                                   1,123      851,875     x     -    =         -                 1,123

   Interest and bank charges                          23,032         851,875     x     -    =         -             23,032

   Professional and business fees                     29,791         851,875     x     -    =         -             29,791

   Advertising and promotion                          15,192         851,875     x     -    =         -             15,192

   Delivery, shipping and warehouse exp               -              851,875     x     -    =         -             -

   Insurance                                              9,064      851,875     x     -    =         -                 9,064

   Other expenses                                     47,937         851,875     x     -    =         -             47,937

 Total expenses                                      777,703         851,875     x     -    =         -            777,703

 Net profit / loss*                                   74,172         851,875     x     -    =         -             74,172


                                                                                                                         Prepared by   Reviewed by   SCORE
                                                                                                                                                     Pg 6 of 9
SCORE DEMO
Jazzit Score
Year end: August 31, 2002


Key Financial Ratios                            Industry: Full service restaurant - 7221   Benchmark: Blank
Description                                       Current Year Actual             Benchmark        Previous Year Actual            Comments
                                                125,307       =            2.2        -          113,952      =             0.3
   Current ratio (times)
                                                 58,010                                          372,054
                                                39,002        =            0.7        -           59,532      =             0.2
   Quick ratio (times)
                                                58,010                                           372,054
                                               5,801,000      =           10.8                  37,205,400    =            73.5
   Current debt to equity (%)                                                         -
                                                536,086                                          506,432
                                                352,629       =            0.7        -          392,326      =             0.8
   Debt to equity ratio (times)
                                                536,086                                          506,432
                                                97,203        =            4.2        -           90,689      =             2.9
   Interest coverage ratio (times)
                                                23,032                                            31,138
                                                352,629       =            0.4        -          392,326      =             0.4
   Debt ratio (times)
                                                888,714                                          898,758

   Cash flow from operations                     78,764       =            0.2        -           68,502      =             0.2
   to total debt (times)                        352,629                                          392,326

                                               70,438,600     =          131.4                  71,878,700    =           141.9
   Net fixed assets to equity (%)                                                     -
                                                536,086                                          506,432
                                                 3,244        =            1.4                    7,118       =             3.0
   Collection period for accounts receivable                                          -
                                                 2,334                                            2,399
                                                 59,655       =            7.0        -           47,098      =             5.4
   Return on sales (%)
                                                851,875                                          875,613
                                                 59,655       =           11.4        -           47,098      =             9.8
   Net profit to equity (%)
                                                521,259                                          482,883
                                                537,404       =           63.1        -          526,896      =            60.2
   Gross profit margin (%)
                                                851,844                                          875,105
                                                 82,687       =            9.3        -           78,236      =             8.7
   Return on total assets (%)
                                                893,736                                          904,228
                                                851,875       =            1.6                   875,613      =             1.7
   Revenue to equity ratio                                                            -
                                                536,086                                          506,432
                                                851,875       =           10.5                   875,613      =            18.4
   Revenue to closing inventory ratio                                                 -
                                                 80,797                                           47,613
                                                314,440       =           74.5        -          348,209      =            48.4
   Inventory turnover (days)
                                                 64,205                                           46,195


                                                                                                                     Prepared by   Reviewed by   SCORE
                                                                                                                                                 Pg 7 of 9
SCORE DEMO
Jazzit Score
Year end: August 31, 2002


Key Financial ratios                 Industry: Full service restaurant - 7221     Benchmark: Blank
Description                           Current Year Actual             Benchmark          Previous Year Actual            Comments
                                    314,440      =             4.7                     348,209       =           (1.3)
   Working Capital Turnover Ratio                                         -
                                     67,297                                            (258,102)

   Altman Z score                                              4.8        -                                      2.0


                                                                                                           Prepared by   Reviewed by   SCORE
                                                                                                                                       Pg 8 of 9
SCORE DEMO
Jazzit Score
Year end: August 31, 2002


5 Year Key Financial Ratios

                                   2002     2001       2000       1999       1998
Description                       Actual    Actual     Actual     Actual     Actual        Comments

Current ratio (times)                2.16     0.31       0.48       0.20          1.44


Quick ratio (times)                  0.67     0.16       0.24       0.09          0.99


Current debt to equity(%)           10.82    73.47      45.21     108.28      25.35


Debt to equity ratio (times)         0.66     0.77       0.98       1.17          1.48


Interest coverage ratio (times)      4.22     2.91       3.93       4.01          5.53


Debt ratio (times)                   0.40     0.44       0.50       0.54          0.60


Cash flow from operations to
                                     0.22     0.17       0.23       0.23          0.31
total debt (times)


Net fixed assets to equity(%)      131.39   141.93     159.58     178.39     194.26

Collection period for accounts
                                     1.39     2.97       2.91       0.61          0.94
receivable

Return on sales (%)                  7.00     5.38       8.89       8.95      14.48


Net profit to equity (%)            11.44     9.75      18.42      21.18      -


Gross profit margin (%)             63.09    60.21      62.44      62.89      61.77


Return on total assets (%)           9.25     8.65      12.54      12.92      -


Revenue to equity ratio              1.59     1.73       1.98       2.27          2.73

Revenue to closing inventory
                                    10.54    18.39      20.26      21.93      29.54
ratio

Inventory turnover (days)           74.53    48.42      47.12      40.89     N/A

Working Capital Turnover
                                     4.67     (1.35)     (3.16)     (0.97)        9.21
Ratio

Altman Z score                       4.79     1.99       2.90       0.83          3.93


                                                                                  Prepared by   Reviewed by   SCORE
                                                                                                              Pg 9 of 9

More Related Content

What's hot

OC Roadshow Hosted by Bank of America Merrill Lynch – Philadelphia
OC Roadshow Hosted by Bank of America Merrill Lynch – PhiladelphiaOC Roadshow Hosted by Bank of America Merrill Lynch – Philadelphia
OC Roadshow Hosted by Bank of America Merrill Lynch – PhiladelphiaCorning_Owens
 
Corporate Report (2)
Corporate Report (2)Corporate Report (2)
Corporate Report (2)SarahAlian
 
Ratio analysis project on ONGC of year 2010-11 & 2011-12
Ratio analysis project on ONGC of  year 2010-11 & 2011-12Ratio analysis project on ONGC of  year 2010-11 & 2011-12
Ratio analysis project on ONGC of year 2010-11 & 2011-12Arjun Negi
 
Solvency And Asset Recommendations 2011
Solvency And Asset Recommendations 2011Solvency And Asset Recommendations 2011
Solvency And Asset Recommendations 2011mrittmayer
 
Shareholder meeting april2017_vf
Shareholder meeting april2017_vfShareholder meeting april2017_vf
Shareholder meeting april2017_vftribuneIR
 
financial management project- ratio analysis
financial management project- ratio analysisfinancial management project- ratio analysis
financial management project- ratio analysisyogita varma
 
Corporate reporitng requirements
Corporate reporitng requirementsCorporate reporitng requirements
Corporate reporitng requirementsgayatri malik
 
Equity Valuation Report on eBay Inc
Equity Valuation Report on eBay IncEquity Valuation Report on eBay Inc
Equity Valuation Report on eBay IncCarlos Pang
 

What's hot (18)

OC Roadshow Hosted by Bank of America Merrill Lynch – Philadelphia
OC Roadshow Hosted by Bank of America Merrill Lynch – PhiladelphiaOC Roadshow Hosted by Bank of America Merrill Lynch – Philadelphia
OC Roadshow Hosted by Bank of America Merrill Lynch – Philadelphia
 
Q2 2017 Financial Highlights
Q2 2017 Financial HighlightsQ2 2017 Financial Highlights
Q2 2017 Financial Highlights
 
Corporate Report (2)
Corporate Report (2)Corporate Report (2)
Corporate Report (2)
 
Ratio analysis project on ONGC of year 2010-11 & 2011-12
Ratio analysis project on ONGC of  year 2010-11 & 2011-12Ratio analysis project on ONGC of  year 2010-11 & 2011-12
Ratio analysis project on ONGC of year 2010-11 & 2011-12
 
Chapter 3,
Chapter 3,Chapter 3,
Chapter 3,
 
Chapter05
Chapter05Chapter05
Chapter05
 
FINANCIAL STATEMENT ANALYSIS
FINANCIAL STATEMENT ANALYSISFINANCIAL STATEMENT ANALYSIS
FINANCIAL STATEMENT ANALYSIS
 
Aimia Q4 2015 Financial Highlights Presentation
Aimia Q4 2015 Financial Highlights PresentationAimia Q4 2015 Financial Highlights Presentation
Aimia Q4 2015 Financial Highlights Presentation
 
Solvency And Asset Recommendations 2011
Solvency And Asset Recommendations 2011Solvency And Asset Recommendations 2011
Solvency And Asset Recommendations 2011
 
Shareholder meeting april2017_vf
Shareholder meeting april2017_vfShareholder meeting april2017_vf
Shareholder meeting april2017_vf
 
Ch 01
Ch 01Ch 01
Ch 01
 
Pooja 1
Pooja 1 Pooja 1
Pooja 1
 
financial management project- ratio analysis
financial management project- ratio analysisfinancial management project- ratio analysis
financial management project- ratio analysis
 
Ratio analysis
Ratio analysisRatio analysis
Ratio analysis
 
Corporate reporitng requirements
Corporate reporitng requirementsCorporate reporitng requirements
Corporate reporitng requirements
 
The Principal Financial Group 101
The Principal Financial Group 101The Principal Financial Group 101
The Principal Financial Group 101
 
Equity Valuation Report on eBay Inc
Equity Valuation Report on eBay IncEquity Valuation Report on eBay Inc
Equity Valuation Report on eBay Inc
 
Dynamic materialsjun13pres
Dynamic materialsjun13presDynamic materialsjun13pres
Dynamic materialsjun13pres
 

Similar to Jazzit score sample_32_page_report

Financial statement analysis notes
Financial statement analysis notes Financial statement analysis notes
Financial statement analysis notes Vardha Mago
 
Accounting for manager 2
Accounting for manager 2Accounting for manager 2
Accounting for manager 2Neha Sharma
 
Financial Performance of Aurabindo.pdf
Financial Performance of Aurabindo.pdfFinancial Performance of Aurabindo.pdf
Financial Performance of Aurabindo.pdfpraveenkumarkota1502
 
What's the Impact of Ratios in Financial Analysis?
What's the Impact of Ratios in Financial Analysis?What's the Impact of Ratios in Financial Analysis?
What's the Impact of Ratios in Financial Analysis?Flevy.com Best Practices
 
Ratio analysis.pptx
Ratio analysis.pptxRatio analysis.pptx
Ratio analysis.pptxRiaMennita
 
Ratio analysis
Ratio analysisRatio analysis
Ratio analysisAhmad Awan
 
Ratios and Formulas in Customer Financial AnalysisFinancial stat.docx
Ratios and Formulas in Customer Financial AnalysisFinancial stat.docxRatios and Formulas in Customer Financial AnalysisFinancial stat.docx
Ratios and Formulas in Customer Financial AnalysisFinancial stat.docxcatheryncouper
 
Management Accounting and Ratio Analysis- Fin I.pptx
Management Accounting and Ratio Analysis- Fin I.pptxManagement Accounting and Ratio Analysis- Fin I.pptx
Management Accounting and Ratio Analysis- Fin I.pptxMangeshBhople
 
FINANCIAL-STATEMENT-FINAL (1).pptx
FINANCIAL-STATEMENT-FINAL (1).pptxFINANCIAL-STATEMENT-FINAL (1).pptx
FINANCIAL-STATEMENT-FINAL (1).pptxlhaniemadro
 
No More Smoke and Mirrors: Knowing and Demonstrating Business Numbers
No More Smoke and Mirrors: Knowing and Demonstrating Business NumbersNo More Smoke and Mirrors: Knowing and Demonstrating Business Numbers
No More Smoke and Mirrors: Knowing and Demonstrating Business NumbersTheIdeaVillage
 
Ratio AnalysisFinancial ratios can be used to examine various as.docx
Ratio AnalysisFinancial ratios can be used to examine various as.docxRatio AnalysisFinancial ratios can be used to examine various as.docx
Ratio AnalysisFinancial ratios can be used to examine various as.docxcatheryncouper
 

Similar to Jazzit score sample_32_page_report (20)

Financial statement analysis notes
Financial statement analysis notes Financial statement analysis notes
Financial statement analysis notes
 
Accounting for manager 2
Accounting for manager 2Accounting for manager 2
Accounting for manager 2
 
Sg03
Sg03Sg03
Sg03
 
Financial Performance of Aurabindo.pdf
Financial Performance of Aurabindo.pdfFinancial Performance of Aurabindo.pdf
Financial Performance of Aurabindo.pdf
 
What's the Impact of Ratios in Financial Analysis?
What's the Impact of Ratios in Financial Analysis?What's the Impact of Ratios in Financial Analysis?
What's the Impact of Ratios in Financial Analysis?
 
Ratio analysis.pptx
Ratio analysis.pptxRatio analysis.pptx
Ratio analysis.pptx
 
Ratio analysis project
Ratio analysis project Ratio analysis project
Ratio analysis project
 
Research project final
Research project finalResearch project final
Research project final
 
Ratio analysis
Ratio analysisRatio analysis
Ratio analysis
 
Finmgt assignment.
Finmgt assignment.Finmgt assignment.
Finmgt assignment.
 
Ratios and Formulas in Customer Financial AnalysisFinancial stat.docx
Ratios and Formulas in Customer Financial AnalysisFinancial stat.docxRatios and Formulas in Customer Financial AnalysisFinancial stat.docx
Ratios and Formulas in Customer Financial AnalysisFinancial stat.docx
 
JIGAR PPT.pptx
JIGAR PPT.pptxJIGAR PPT.pptx
JIGAR PPT.pptx
 
Management Accounting and Ratio Analysis- Fin I.pptx
Management Accounting and Ratio Analysis- Fin I.pptxManagement Accounting and Ratio Analysis- Fin I.pptx
Management Accounting and Ratio Analysis- Fin I.pptx
 
FINANCIAL-STATEMENT-FINAL (1).pptx
FINANCIAL-STATEMENT-FINAL (1).pptxFINANCIAL-STATEMENT-FINAL (1).pptx
FINANCIAL-STATEMENT-FINAL (1).pptx
 
No More Smoke and Mirrors: Knowing and Demonstrating Business Numbers
No More Smoke and Mirrors: Knowing and Demonstrating Business NumbersNo More Smoke and Mirrors: Knowing and Demonstrating Business Numbers
No More Smoke and Mirrors: Knowing and Demonstrating Business Numbers
 
Ratio AnalysisFinancial ratios can be used to examine various as.docx
Ratio AnalysisFinancial ratios can be used to examine various as.docxRatio AnalysisFinancial ratios can be used to examine various as.docx
Ratio AnalysisFinancial ratios can be used to examine various as.docx
 
Project wipro
Project wiproProject wipro
Project wipro
 
Wip
WipWip
Wip
 
Ratio analysis1
Ratio analysis1Ratio analysis1
Ratio analysis1
 
Ratios
RatiosRatios
Ratios
 

More from Stephen King

Artificial Intelligence in Marketing (...and intro to DBMMS.io v3.0)
Artificial Intelligence in Marketing (...and intro to DBMMS.io v3.0)Artificial Intelligence in Marketing (...and intro to DBMMS.io v3.0)
Artificial Intelligence in Marketing (...and intro to DBMMS.io v3.0)Stephen King
 
So you wanna be an entrepreneur (Alberta perspective)
So you wanna be an entrepreneur (Alberta perspective)So you wanna be an entrepreneur (Alberta perspective)
So you wanna be an entrepreneur (Alberta perspective)Stephen King
 
Commercialization Challenges of Mobile Software Development in an Exponential...
Commercialization Challenges of Mobile Software Development in an Exponential...Commercialization Challenges of Mobile Software Development in an Exponential...
Commercialization Challenges of Mobile Software Development in an Exponential...Stephen King
 
Eleven Essentials for Young Entrepreneurs
Eleven Essentials for Young EntrepreneursEleven Essentials for Young Entrepreneurs
Eleven Essentials for Young EntrepreneursStephen King
 
"Market Before Your Product Goes To Market" AccelerateAB Marketing Panel
"Market Before Your Product Goes To Market" AccelerateAB Marketing Panel "Market Before Your Product Goes To Market" AccelerateAB Marketing Panel
"Market Before Your Product Goes To Market" AccelerateAB Marketing Panel Stephen King
 
Eleven Essentials To Fiscal Excellence for Entrepreneurs
Eleven Essentials To Fiscal Excellence for EntrepreneursEleven Essentials To Fiscal Excellence for Entrepreneurs
Eleven Essentials To Fiscal Excellence for EntrepreneursStephen King
 
Eleven Essentials for Salespeople
Eleven Essentials for SalespeopleEleven Essentials for Salespeople
Eleven Essentials for SalespeopleStephen King
 
Eleven Essentials for Communicators
Eleven Essentials for CommunicatorsEleven Essentials for Communicators
Eleven Essentials for CommunicatorsStephen King
 
Stephdokin Digital Brand Services (Audit, Dashboard, Marketing)
Stephdokin Digital Brand Services (Audit, Dashboard, Marketing)Stephdokin Digital Brand Services (Audit, Dashboard, Marketing)
Stephdokin Digital Brand Services (Audit, Dashboard, Marketing)Stephen King
 
Total Customer Experience Management Overview #TCE #CEM -- The Why, What and...
Total Customer Experience Management Overview #TCE #CEM  -- The Why, What and...Total Customer Experience Management Overview #TCE #CEM  -- The Why, What and...
Total Customer Experience Management Overview #TCE #CEM -- The Why, What and...Stephen King
 
Eleven Essentials For Entrepreneurs
Eleven Essentials For EntrepreneursEleven Essentials For Entrepreneurs
Eleven Essentials For EntrepreneursStephen King
 
Global wireless network operator and mobile satisfaction / customer loyalty s...
Global wireless network operator and mobile satisfaction / customer loyalty s...Global wireless network operator and mobile satisfaction / customer loyalty s...
Global wireless network operator and mobile satisfaction / customer loyalty s...Stephen King
 
Make Money with Big Data (TCELab)
Make Money with Big Data (TCELab)Make Money with Big Data (TCELab)
Make Money with Big Data (TCELab)Stephen King
 
Mob4Hire What is mobile app and website usability?
Mob4Hire What is mobile app and website usability?Mob4Hire What is mobile app and website usability?
Mob4Hire What is mobile app and website usability?Stephen King
 
Mob4Hire Mobile App Usability (MobExperience) Overview
Mob4Hire Mobile App Usability (MobExperience) OverviewMob4Hire Mobile App Usability (MobExperience) Overview
Mob4Hire Mobile App Usability (MobExperience) OverviewStephen King
 
Mob4Hire releases Mobile Apps report from "Global Wireless Satisfaction Surve...
Mob4Hire releases Mobile Apps report from "Global Wireless Satisfaction Surve...Mob4Hire releases Mobile Apps report from "Global Wireless Satisfaction Surve...
Mob4Hire releases Mobile Apps report from "Global Wireless Satisfaction Surve...Stephen King
 
Commercialization Challenges Of Mobile Software Development In A Fragmented M...
Commercialization Challenges Of Mobile Software Development In A Fragmented M...Commercialization Challenges Of Mobile Software Development In A Fragmented M...
Commercialization Challenges Of Mobile Software Development In A Fragmented M...Stephen King
 

More from Stephen King (17)

Artificial Intelligence in Marketing (...and intro to DBMMS.io v3.0)
Artificial Intelligence in Marketing (...and intro to DBMMS.io v3.0)Artificial Intelligence in Marketing (...and intro to DBMMS.io v3.0)
Artificial Intelligence in Marketing (...and intro to DBMMS.io v3.0)
 
So you wanna be an entrepreneur (Alberta perspective)
So you wanna be an entrepreneur (Alberta perspective)So you wanna be an entrepreneur (Alberta perspective)
So you wanna be an entrepreneur (Alberta perspective)
 
Commercialization Challenges of Mobile Software Development in an Exponential...
Commercialization Challenges of Mobile Software Development in an Exponential...Commercialization Challenges of Mobile Software Development in an Exponential...
Commercialization Challenges of Mobile Software Development in an Exponential...
 
Eleven Essentials for Young Entrepreneurs
Eleven Essentials for Young EntrepreneursEleven Essentials for Young Entrepreneurs
Eleven Essentials for Young Entrepreneurs
 
"Market Before Your Product Goes To Market" AccelerateAB Marketing Panel
"Market Before Your Product Goes To Market" AccelerateAB Marketing Panel "Market Before Your Product Goes To Market" AccelerateAB Marketing Panel
"Market Before Your Product Goes To Market" AccelerateAB Marketing Panel
 
Eleven Essentials To Fiscal Excellence for Entrepreneurs
Eleven Essentials To Fiscal Excellence for EntrepreneursEleven Essentials To Fiscal Excellence for Entrepreneurs
Eleven Essentials To Fiscal Excellence for Entrepreneurs
 
Eleven Essentials for Salespeople
Eleven Essentials for SalespeopleEleven Essentials for Salespeople
Eleven Essentials for Salespeople
 
Eleven Essentials for Communicators
Eleven Essentials for CommunicatorsEleven Essentials for Communicators
Eleven Essentials for Communicators
 
Stephdokin Digital Brand Services (Audit, Dashboard, Marketing)
Stephdokin Digital Brand Services (Audit, Dashboard, Marketing)Stephdokin Digital Brand Services (Audit, Dashboard, Marketing)
Stephdokin Digital Brand Services (Audit, Dashboard, Marketing)
 
Total Customer Experience Management Overview #TCE #CEM -- The Why, What and...
Total Customer Experience Management Overview #TCE #CEM  -- The Why, What and...Total Customer Experience Management Overview #TCE #CEM  -- The Why, What and...
Total Customer Experience Management Overview #TCE #CEM -- The Why, What and...
 
Eleven Essentials For Entrepreneurs
Eleven Essentials For EntrepreneursEleven Essentials For Entrepreneurs
Eleven Essentials For Entrepreneurs
 
Global wireless network operator and mobile satisfaction / customer loyalty s...
Global wireless network operator and mobile satisfaction / customer loyalty s...Global wireless network operator and mobile satisfaction / customer loyalty s...
Global wireless network operator and mobile satisfaction / customer loyalty s...
 
Make Money with Big Data (TCELab)
Make Money with Big Data (TCELab)Make Money with Big Data (TCELab)
Make Money with Big Data (TCELab)
 
Mob4Hire What is mobile app and website usability?
Mob4Hire What is mobile app and website usability?Mob4Hire What is mobile app and website usability?
Mob4Hire What is mobile app and website usability?
 
Mob4Hire Mobile App Usability (MobExperience) Overview
Mob4Hire Mobile App Usability (MobExperience) OverviewMob4Hire Mobile App Usability (MobExperience) Overview
Mob4Hire Mobile App Usability (MobExperience) Overview
 
Mob4Hire releases Mobile Apps report from "Global Wireless Satisfaction Surve...
Mob4Hire releases Mobile Apps report from "Global Wireless Satisfaction Surve...Mob4Hire releases Mobile Apps report from "Global Wireless Satisfaction Surve...
Mob4Hire releases Mobile Apps report from "Global Wireless Satisfaction Surve...
 
Commercialization Challenges Of Mobile Software Development In A Fragmented M...
Commercialization Challenges Of Mobile Software Development In A Fragmented M...Commercialization Challenges Of Mobile Software Development In A Fragmented M...
Commercialization Challenges Of Mobile Software Development In A Fragmented M...
 

Recently uploaded

Booking open Available Pune Call Girls Wadgaon Sheri 6297143586 Call Hot Ind...
Booking open Available Pune Call Girls Wadgaon Sheri  6297143586 Call Hot Ind...Booking open Available Pune Call Girls Wadgaon Sheri  6297143586 Call Hot Ind...
Booking open Available Pune Call Girls Wadgaon Sheri 6297143586 Call Hot Ind...Call Girls in Nagpur High Profile
 
TEST BANK For Corporate Finance, 13th Edition By Stephen Ross, Randolph Weste...
TEST BANK For Corporate Finance, 13th Edition By Stephen Ross, Randolph Weste...TEST BANK For Corporate Finance, 13th Edition By Stephen Ross, Randolph Weste...
TEST BANK For Corporate Finance, 13th Edition By Stephen Ross, Randolph Weste...ssifa0344
 
Vip Call US 📞 7738631006 ✅Call Girls In Sakinaka ( Mumbai )
Vip Call US 📞 7738631006 ✅Call Girls In Sakinaka ( Mumbai )Vip Call US 📞 7738631006 ✅Call Girls In Sakinaka ( Mumbai )
Vip Call US 📞 7738631006 ✅Call Girls In Sakinaka ( Mumbai )Pooja Nehwal
 
Gurley shaw Theory of Monetary Economics.
Gurley shaw Theory of Monetary Economics.Gurley shaw Theory of Monetary Economics.
Gurley shaw Theory of Monetary Economics.Vinodha Devi
 
Call Girls Koregaon Park Call Me 7737669865 Budget Friendly No Advance Booking
Call Girls Koregaon Park Call Me 7737669865 Budget Friendly No Advance BookingCall Girls Koregaon Park Call Me 7737669865 Budget Friendly No Advance Booking
Call Girls Koregaon Park Call Me 7737669865 Budget Friendly No Advance Bookingroncy bisnoi
 
00_Main ppt_MeetupDORA&CyberSecurity.pptx
00_Main ppt_MeetupDORA&CyberSecurity.pptx00_Main ppt_MeetupDORA&CyberSecurity.pptx
00_Main ppt_MeetupDORA&CyberSecurity.pptxFinTech Belgium
 
03_Emmanuel Ndiaye_Degroof Petercam.pptx
03_Emmanuel Ndiaye_Degroof Petercam.pptx03_Emmanuel Ndiaye_Degroof Petercam.pptx
03_Emmanuel Ndiaye_Degroof Petercam.pptxFinTech Belgium
 
The Economic History of the U.S. Lecture 20.pdf
The Economic History of the U.S. Lecture 20.pdfThe Economic History of the U.S. Lecture 20.pdf
The Economic History of the U.S. Lecture 20.pdfGale Pooley
 
The Economic History of the U.S. Lecture 19.pdf
The Economic History of the U.S. Lecture 19.pdfThe Economic History of the U.S. Lecture 19.pdf
The Economic History of the U.S. Lecture 19.pdfGale Pooley
 
The Economic History of the U.S. Lecture 17.pdf
The Economic History of the U.S. Lecture 17.pdfThe Economic History of the U.S. Lecture 17.pdf
The Economic History of the U.S. Lecture 17.pdfGale Pooley
 
The Economic History of the U.S. Lecture 26.pdf
The Economic History of the U.S. Lecture 26.pdfThe Economic History of the U.S. Lecture 26.pdf
The Economic History of the U.S. Lecture 26.pdfGale Pooley
 
Dharavi Russian callg Girls, { 09892124323 } || Call Girl In Mumbai ...
Dharavi Russian callg Girls, { 09892124323 } || Call Girl In Mumbai ...Dharavi Russian callg Girls, { 09892124323 } || Call Girl In Mumbai ...
Dharavi Russian callg Girls, { 09892124323 } || Call Girl In Mumbai ...Pooja Nehwal
 
The Economic History of the U.S. Lecture 25.pdf
The Economic History of the U.S. Lecture 25.pdfThe Economic History of the U.S. Lecture 25.pdf
The Economic History of the U.S. Lecture 25.pdfGale Pooley
 
20240429 Calibre April 2024 Investor Presentation.pdf
20240429 Calibre April 2024 Investor Presentation.pdf20240429 Calibre April 2024 Investor Presentation.pdf
20240429 Calibre April 2024 Investor Presentation.pdfAdnet Communications
 
(DIYA) Bhumkar Chowk Call Girls Just Call 7001035870 [ Cash on Delivery ] Pun...
(DIYA) Bhumkar Chowk Call Girls Just Call 7001035870 [ Cash on Delivery ] Pun...(DIYA) Bhumkar Chowk Call Girls Just Call 7001035870 [ Cash on Delivery ] Pun...
(DIYA) Bhumkar Chowk Call Girls Just Call 7001035870 [ Cash on Delivery ] Pun...ranjana rawat
 
Pooja 9892124323 : Call Girl in Juhu Escorts Service Free Home Delivery
Pooja 9892124323 : Call Girl in Juhu Escorts Service Free Home DeliveryPooja 9892124323 : Call Girl in Juhu Escorts Service Free Home Delivery
Pooja 9892124323 : Call Girl in Juhu Escorts Service Free Home DeliveryPooja Nehwal
 
The Economic History of the U.S. Lecture 22.pdf
The Economic History of the U.S. Lecture 22.pdfThe Economic History of the U.S. Lecture 22.pdf
The Economic History of the U.S. Lecture 22.pdfGale Pooley
 
The Economic History of the U.S. Lecture 30.pdf
The Economic History of the U.S. Lecture 30.pdfThe Economic History of the U.S. Lecture 30.pdf
The Economic History of the U.S. Lecture 30.pdfGale Pooley
 

Recently uploaded (20)

Booking open Available Pune Call Girls Wadgaon Sheri 6297143586 Call Hot Ind...
Booking open Available Pune Call Girls Wadgaon Sheri  6297143586 Call Hot Ind...Booking open Available Pune Call Girls Wadgaon Sheri  6297143586 Call Hot Ind...
Booking open Available Pune Call Girls Wadgaon Sheri 6297143586 Call Hot Ind...
 
TEST BANK For Corporate Finance, 13th Edition By Stephen Ross, Randolph Weste...
TEST BANK For Corporate Finance, 13th Edition By Stephen Ross, Randolph Weste...TEST BANK For Corporate Finance, 13th Edition By Stephen Ross, Randolph Weste...
TEST BANK For Corporate Finance, 13th Edition By Stephen Ross, Randolph Weste...
 
Vip Call US 📞 7738631006 ✅Call Girls In Sakinaka ( Mumbai )
Vip Call US 📞 7738631006 ✅Call Girls In Sakinaka ( Mumbai )Vip Call US 📞 7738631006 ✅Call Girls In Sakinaka ( Mumbai )
Vip Call US 📞 7738631006 ✅Call Girls In Sakinaka ( Mumbai )
 
Gurley shaw Theory of Monetary Economics.
Gurley shaw Theory of Monetary Economics.Gurley shaw Theory of Monetary Economics.
Gurley shaw Theory of Monetary Economics.
 
Call Girls Koregaon Park Call Me 7737669865 Budget Friendly No Advance Booking
Call Girls Koregaon Park Call Me 7737669865 Budget Friendly No Advance BookingCall Girls Koregaon Park Call Me 7737669865 Budget Friendly No Advance Booking
Call Girls Koregaon Park Call Me 7737669865 Budget Friendly No Advance Booking
 
00_Main ppt_MeetupDORA&CyberSecurity.pptx
00_Main ppt_MeetupDORA&CyberSecurity.pptx00_Main ppt_MeetupDORA&CyberSecurity.pptx
00_Main ppt_MeetupDORA&CyberSecurity.pptx
 
(Vedika) Low Rate Call Girls in Pune Call Now 8250077686 Pune Escorts 24x7
(Vedika) Low Rate Call Girls in Pune Call Now 8250077686 Pune Escorts 24x7(Vedika) Low Rate Call Girls in Pune Call Now 8250077686 Pune Escorts 24x7
(Vedika) Low Rate Call Girls in Pune Call Now 8250077686 Pune Escorts 24x7
 
03_Emmanuel Ndiaye_Degroof Petercam.pptx
03_Emmanuel Ndiaye_Degroof Petercam.pptx03_Emmanuel Ndiaye_Degroof Petercam.pptx
03_Emmanuel Ndiaye_Degroof Petercam.pptx
 
The Economic History of the U.S. Lecture 20.pdf
The Economic History of the U.S. Lecture 20.pdfThe Economic History of the U.S. Lecture 20.pdf
The Economic History of the U.S. Lecture 20.pdf
 
The Economic History of the U.S. Lecture 19.pdf
The Economic History of the U.S. Lecture 19.pdfThe Economic History of the U.S. Lecture 19.pdf
The Economic History of the U.S. Lecture 19.pdf
 
The Economic History of the U.S. Lecture 17.pdf
The Economic History of the U.S. Lecture 17.pdfThe Economic History of the U.S. Lecture 17.pdf
The Economic History of the U.S. Lecture 17.pdf
 
The Economic History of the U.S. Lecture 26.pdf
The Economic History of the U.S. Lecture 26.pdfThe Economic History of the U.S. Lecture 26.pdf
The Economic History of the U.S. Lecture 26.pdf
 
Dharavi Russian callg Girls, { 09892124323 } || Call Girl In Mumbai ...
Dharavi Russian callg Girls, { 09892124323 } || Call Girl In Mumbai ...Dharavi Russian callg Girls, { 09892124323 } || Call Girl In Mumbai ...
Dharavi Russian callg Girls, { 09892124323 } || Call Girl In Mumbai ...
 
The Economic History of the U.S. Lecture 25.pdf
The Economic History of the U.S. Lecture 25.pdfThe Economic History of the U.S. Lecture 25.pdf
The Economic History of the U.S. Lecture 25.pdf
 
(INDIRA) Call Girl Mumbai Call Now 8250077686 Mumbai Escorts 24x7
(INDIRA) Call Girl Mumbai Call Now 8250077686 Mumbai Escorts 24x7(INDIRA) Call Girl Mumbai Call Now 8250077686 Mumbai Escorts 24x7
(INDIRA) Call Girl Mumbai Call Now 8250077686 Mumbai Escorts 24x7
 
20240429 Calibre April 2024 Investor Presentation.pdf
20240429 Calibre April 2024 Investor Presentation.pdf20240429 Calibre April 2024 Investor Presentation.pdf
20240429 Calibre April 2024 Investor Presentation.pdf
 
(DIYA) Bhumkar Chowk Call Girls Just Call 7001035870 [ Cash on Delivery ] Pun...
(DIYA) Bhumkar Chowk Call Girls Just Call 7001035870 [ Cash on Delivery ] Pun...(DIYA) Bhumkar Chowk Call Girls Just Call 7001035870 [ Cash on Delivery ] Pun...
(DIYA) Bhumkar Chowk Call Girls Just Call 7001035870 [ Cash on Delivery ] Pun...
 
Pooja 9892124323 : Call Girl in Juhu Escorts Service Free Home Delivery
Pooja 9892124323 : Call Girl in Juhu Escorts Service Free Home DeliveryPooja 9892124323 : Call Girl in Juhu Escorts Service Free Home Delivery
Pooja 9892124323 : Call Girl in Juhu Escorts Service Free Home Delivery
 
The Economic History of the U.S. Lecture 22.pdf
The Economic History of the U.S. Lecture 22.pdfThe Economic History of the U.S. Lecture 22.pdf
The Economic History of the U.S. Lecture 22.pdf
 
The Economic History of the U.S. Lecture 30.pdf
The Economic History of the U.S. Lecture 30.pdfThe Economic History of the U.S. Lecture 30.pdf
The Economic History of the U.S. Lecture 30.pdf
 

Jazzit score sample_32_page_report

  • 1. www.jazzit.pro December 21, 2011 SCORE DEMO 2nd Floor, 223 - 14th Street NW Calgary Alberta T2N 1Z6 Attention: Mr. Giorgio Fontaine, President Dear Mr. Fontaine: We are pleased to provide you with our in-depth analytical Strategic Client Operations Results Evaluator (SCORE) report of your operations for the year ended August 31, 2002. The SCORE report has been prepared based on financial information, assumptions and estimates provided by management, and from external data sources where available. While every attempt has been made to ensure the completeness and accuracy of the SCORE report, please be advised that all of the information contained herein is obtained from sources believed to be accurate as the data and methodologies will allow. However, because of the possibilities of human and mechanical errors beyond our firm's control, readers are advised that the information is provided without warranty of any kind and are advised to proceed with caution. PURPOSE The purpose of this SCORE report is to provide you, our valued client, with answers concerning the health of your business. We accomplish this task by completing an in-depth look at your business using financial analytical tools. This report will highlight areas of strengths and weaknesses in your business, while keeping in mind that the ultimate goal is for you to turn those weaknesses into strengths. The SCORE report will also provide answers to important questions including; What areas in the business need focus and improvement? Is the business able to meet short-term obligations when they come due? Are there historical trends that you are not aware of? Does the business have the ability to expand its operations through additional borrowing? If the need for additional financing is required, do the current financial statements look favourable to the lender? How does the business's performance stack up against similar competitors in the industry? INTRODUCTION Financial statements contain a wealth of information which can be used to assess past performance, current financial condition, future potential, and the risk associated with that potential. Ratio analysis is a valuable tool for understanding financial statements and the interpretation of ratios is fundamental to determining the causes of business problems or successes. Ratio analysis consists of determining certain relationships among financial items and comparing the results with those of prior years, other companies, and industry averages. It also assesses a business against industry standards or benchmarks. Ratio analysis also provides a benchmark to measure future performance and target future goals. Ratios are most effective when they are used to highlight trends and should be compared with each other over several years. The absolute number is not as important as the direction of the trend. In summary, ratio analysis can provide useful insight into investment return, financial structure and management performance. Suite 229, 2116 - 27 Avenue NE, Calgary, Alberta T2E 7A6 Ph: 403.670.7385 Fax: 403.670.7590
  • 2. There are different types of financial ratios for different purposes which generally fall into four categories: Liquidity ratios: Liquidity is a measure of a business's ability to pay its current obligations as they become due. They are commonly used by bankers and suppliers to measure the creditworthiness of a business. These would include bank overdrafts, trade accounts payable and income taxes. Liquidity is of critical importance because of the severe consequences that may occur if the bills are not paid on time. Consequences can include creditors refusing to provide further goods or services; creditors can sue for payment and may go as far as to force the business into receivership or bankruptcy. Coverage ratios: Most businesses have short-term and long-term debt obligations, therefore coverage ratios measure the extent of debt used to finance operations by showing the relative use of borrowed funds as compared to resources invested by shareholder's. One area of concern is long-term debt obligations which require payment of fixed interest charges. Too much long-term debt can severely restrict management and increase risk to creditors because of the fixed interest charges that must be paid from earnings. Once a business exceeds a certain threshold, financing will no longer be available at conventional rates which will force them to seek out long-term financing at significantly higher interest rates. Profitability ratios: Profitability ratios are primarily "return on" ratios which measure "profit" against other significant financial statement items, such as shareholder's equity, sales and total assets. In other words, profitability ratios relate profit to management's performance by assessing how well management has employed assets to generate a profit on sales, and thereby create a return on shareholder's equity. Ratios such as return on sales help determine if a business is maximizing the bottom line. It is most common to analyze these ratios in light of the performance of competitors. Activity ratios: Often referred to as management performance ratios, they evaluate how effectively management uses assets to generate income. The ratios can also inform you of cash flow, inventory efficiency, and how quickly products or services sell. For example, a business can tell how well its collections policies are working by analyzing the company's receivables turnover ratio or average collections period. REPORT FORMAT The report is separated into two distinct segments as follows: Segment 1 Segment 1 focuses on what are identified and considered as "key ratios" by financial executives, commercial banks, corporate controllers, and creditors. The report defines each ratio, and determines your present year value and comparable industry benchmark if available. It also indicates when to apply each ratio, and gives you our recommendations if warranted. Segment 2 Segment 2 contains various schedules containing comprehensive data including: Ratio components the individual ratio components of your financial statements with up to a five year comparison. Balance sheet a key of balance sheet accounts are listed with comparable benchmarks. Expenses as a % of total revenue a schedule that compares income statement items with benchmarks. There is also a schedule showing up to five years for trends analysis. Jazzit CaseWare Made Easy
  • 3. Variance from expected expenses a schedule that effectively illustrates what deviations from the benchmarks can mean in dollar amounts to a business. The schedule shows extracted benchmarks and a completed reverse calculation using your total revenues to extrapolate what the expected expenses should be. Key ratios a schedule that shows ratios and benchmarks where available. There is also a schedule showing up to five years for trends analysis. All benchmark information contained within the following schedules are either from benchmarks supplied by our firm or from data supplied by Industry Canada, where available. Industry Canada has compiled the benchmark data from tax returns submitted to Canada Revenue Agency (CRA) from the reporting division that is responsible for revenue filings between $30 thousand and $5 million inclusive. We trust you will find SCORE valuable in assisting you in understanding your business more fully. Should you have further questions or require further clarification, please do not hesitate to contact us by email at or call . Yours truly, Partner name Firm name Jazzit CaseWare Made Easy
  • 4. Current Ratio (times) Type of ratio: Liquidity Ratio definition: [ Current Assets / Current Liabilities ] Ratio status: Your current ratio is 2.2 times, whereas the prior year was 0.3 times. Desired trend: An increasing number What it is: The current ratio is one of the standard measurements of any business's financial health. The current ratio helps you determine if you have enough working capital to meet your short term financial obligations. Although high liquidity may indicate a good ability to meet short-term obligations, it is not always desirable. Liquid assets may generate returns in the form of interest on short-term securities. However, these returns are generally lower than what can be obtained from investing the funds in the normal operations of the firm. The general benchmark for the current ratio of a healthy business is 1.5 to 2 times, meaning it has about twice as many current assets as current liabilities. This should be compared to other companies in the same industry. A current ratio under 1.5 times may indicate an inability to pay current financial obligations with a measure of safety. A number above 2.0 times may indicate that current assets are excessive and capital is under employed, which could indicate problems such as too much inventory. There are some businesses, especially cash businesses (no receivables), that can operate comfortably with a lower ratio. The importance of this ratio is that a declining current ratio over several years indicates that a business could be draining its working capital to pay for capital (long term) assets. Unless there was excess working capital to begin with, the company may find itself backed into a corner with a tight working capital position. When to apply it: The current ratio should be part of your business's basic financial planning strategy. It's important to keep a close eye on this figure as it is an early indicator if things start to get out of line. Early warning signs mean the ability to take early action on your part to prevent your business from ending up in a much more difficult situation later. Recommendations: We recommend that you .... Current Ratio 2.0 1.5 Times 1.0 0.5 0.0 1998 1999 2000 2001 2002 Jazzit CaseWare Made Easy
  • 5. Quick Ratio (times) Type of ratio: Liquidity Ratio definition: [ Quick Assets / Quick Liabilities ] Ratio status: Your quick ratio is 0.7 times whereas prior year was 0.2 times. Desired trend: An increasing number What it is: Like the current ratio, the quick ratio (also sometimes called the acid test ratio) measures a business's liquidity. It provides a test of the ability to meet the immediate demands of creditors by excluding prepaids and inventory which is more difficult to turn into cash on a short notice than marketable securities and accounts receivable. It calculates a business's liquid assets in relation to its liabilities. The higher the ratio is, the higher your business's ability to meet its obligations. Such information is of particular significance to bankers and short-term creditors who look at the quick ratio to determine the business's ability to repay loans and weather financial crisis. Loans are often tied to a minimum quick ratio. A general benchmark is 1.0 times which indicates a good liquid position unless the majority of your "quick assets" are in accounts receivable and the pattern of accounts receivable collection lags behind the schedule for paying current liabilities. A consistently high ratio may indicate an unnecessary accumulation of funds that are not required for ongoing operations and therefore, are unproductive. You can also use the quick ratio to evaluate the financial health of potential customers since it also indicates whether a business can pay off its debts quickly. When to apply it: This is an important planning tool especially for businesses that can tie up a lot of assets in inventory. By tracking it monthly, you can keep an eye out for negative trends that could hamper your business's ability to meet its obligations. Recommendations: We recommend that you ... Quick Ratio 1.0 0.8 0.6 Times 0.4 0.2 0.0 1998 1999 2000 2001 2002 Jazzit CaseWare Made Easy
  • 6. Current Debt to Equity (percent) Type of ratio: Liquidity Ratio definition: [ ( (Current Liabilities)*100 ) / Owners' Equity ] Ratio status: Your current debt to equity is 10.8% whereas prior year was 73.5%. Desired trend: A decreasing number What it is: This liquidity ratio indicates the relative proportion of debt to shareholder's equity used to finance a company's assets. This ratio provides guidance on the company's capital structure and its relative ability to meet short-term debt obligations. When to apply it: Apply this ratio to determine the company’s relative ability to meet current debt obligations. Recommendations: We recommend that you ... Current Debt to Equity 100 80 Percentage 60 40 20 0 1998 1999 2000 2001 2002 Jazzit CaseWare Made Easy
  • 7. Debt to Equity Ratio (times) Type of ratio: Coverage Ratio definition: [ Total Liabilities / Owners' Equity ] Ratio status: Your debt to equity ratio is 0.7 times whereas prior year was 0.8 times. Desired trend: A decreasing number What it is: This ratio indicates how much the business relies on borrowed funds to finance its operations. The higher the ratio, the greater is the dependence on borrowed funds. A high debt to equity ratio could indicate that the company may be over-leveraged and should look at ways of reducing its debt. Generally, the higher the ratio, the greater the financial risk for creditors. Too much debt results in increased interest charges which reduces the earnings available for dividends. In times of recession, large interest charges or increasing interest rates could cause a financial crisis. A low ratio, which is generally regarded as an indication of financial strength and stability, may indicate that an entity is not realizing its profit potential. Conversely, a highly leveraged business may be maximizing profits but could also be courting financial disaster in an economic downturn. An increasing ratio indicates that a business is funding its growth primarily through debt. If this trend continues on a long-term basis, indicating weakness in the business, lenders will refuse to provide further credit. As a general rule, lenders could become concerned with a debt to equity ratio in excess of 3.0 times or even 2.0 times. Clearly, this ratio is important to lenders. Generally the higher this ratio, the more risky a creditor will perceive its exposure thereby making it correspondingly harder to obtain credit. When to apply it: Equity and debt are two key figures on a financial statement. Lenders or investors often use the relationship of these two figures to evaluate risk. The ratio of your business's equity to its long-term debt provides a window into how strong its finances are, so if you're considering obtaining credit for future expansion or operations, use this ratio to check the health and probability of securing that anticipated loan. Recommendations: We recommend that you ... Debt to Equity Ratio 1.5 1.0 Times 0.5 0.0 1998 1999 2000 2001 2002 Jazzit CaseWare Made Easy
  • 8. Interest Coverage Ratio (times) Type of ratio: Coverage Ratio definition: [ (Net Income + Interest + Income Tax) / Interest ] Ratio status: Your interest coverage ratio is 4.2 times whereas prior year was 2.9 times. Desired trend: An increasing number What it is: This ratio measures the ability to pay interest charges on debt and to protect creditors from interest payment default. The interest coverage ratio compares your net operating profit, before interest expense, to the interest expense for the year. Simply put, the interest coverage ratio assesses financial strength and stability and is of particular importance to businesses that are highly leveraged. When interest rates are rising, the interest coverage ratio is very important as it provides a measure of a business's ability to meet its interest commitments from earnings. A steady or rising trend is favourable whereas a weakening or declining trend is usually a danger signal. Acceptable interest coverage varies from industry to industry. This ratio must be least 1.0 times for the firm to be able to pay interest from operating profits, however, as there are other obligations that the firm must pay, in practice, the ratio should generally be higher than this. When to apply it: Use this ratio to evaluate if your business is carrying too much debt or paying too much in interest charges. Compare this ratio to benchmarks in your industry to see how you rank. Also, if you're considering borrowing funds for future expansion or operations, use this ratio to determine how much debt the business can potentially service. Recommendations: We recommend that you ... Interest Coverage Ratio 5 4 Times 3 2 1 0 1998 1999 2000 2001 2002 Jazzit CaseWare Made Easy
  • 9. Debt Ratio (times) Type of ratio: Coverage Ratio definition: [ Total Liabilities / Total Assets ] Ratio status: Your debt ratio is 0.4 times whereas prior year was 0.4 times. Desired trend: A decreasing number What it is: This ratio indicates what portion of the total invested capital is being financed by long-term debt. This ratio varies widely from industry to industry and there is no benchmark for determining what is an acceptable debt component in the total invested capital structure. A firm with high debt ratio faces high interest charges on its income. During bad economic times, the firm may have difficulty in generating cash flow to cover these charges. The higher the ratio, the higher is the firm's exposure to risk. Therefore, too high a ratio is not desirable. On the other hand, it does make sense to have some debt especially if the rate of return is higher than the cost of borrowing. This ratio is of interest to investors, creditors and banks. When to apply it: You will want to be vigilant as to how much you have leveraged your business. There may come a time in the near future where you require further financing to expand your business. If your debt ratio is too high, getting further financing will be difficult because of the increased risk to the lender. With any borrowing, one of your basic considerations is the return must be higher than the cost of borrowing. Recommendations: We recommend that you ... Debt Ratio 0.6 0.5 0.4 Times 0.3 0.2 0.1 0.0 1998 1999 2000 2001 2002 Jazzit CaseWare Made Easy
  • 10. Cash Flow From Operations to Total Debt (times) Type of ratio: Coverage Ratio definition: [ (Net Income + Amortization + Non Cash Items) / Total Debt ] Ratio status: Your cash flow from operations to total debt is 0.2 times whereas prior year was 0.2 times. Desired trend: An increasing number What it is: This ratio measures a business's ability to repay borrowing and to leverage itself. The statement of income may include many non-cash deductions such as amortization, and therefore it does not necessarily reflect a clear picture of the business's cash flow. The cash flow is considered by many as a superior indicator of earning power which shows the business's ability to repay debts and finance expansion. Cash flow is considered a particularly useful measure for comparing entities in the same industry; it can reveal an entity's ability to repay debts even though there may be little or no net earning after amortization and write-offs. This ratio is of significant interest to many user groups including investors and creditors. When to apply it: If you are thinking about additional financing and want to know if you have the cash flow to service and repay the debt, this ratio will certainly assist you in making that determination. Recommendations: We recommend that you ... Cash Flow From Operations to Total Debt 0.30 0.25 0.20 Times 0.15 0.10 0.05 0.00 1998 1999 2000 2001 2002 Jazzit CaseWare Made Easy
  • 11. Net Fixed Assets to Equity (percent) Type of ratio: Coverage Ratio definition: [ ( (Net Fixed Assets)*100 ) / Owners' Equity ] Ratio status: Your net fixed assets to equity is 131.4% whereas prior year was 141.9%. Desired trend: A decreasing number What it is: This percentage provides guidance regarding the company's relative ability to cover long-term assets with the business's equity. When to apply it: Employ this ratio to measure the relative extent to which the company has utilized debt to finance, typically non- liquid fixed assets. A percentage greater than 100% indicates at least some of these assets are financed by debt. Recommendations: We recommend that you ... Net Fixed Assets to Equity 200 150 Percentage 100 50 0 1998 1999 2000 2001 2002 Jazzit CaseWare Made Easy
  • 12. Collection Period for Accounts Receivable (days) Type of ratio: Coverage Ratio definition: [ Accounts Receivable / Average Daily Revenue ] Ratio status: Your collection period for accounts receivable is 1.4 days whereas prior year was 3.0 days. Desired trend: A decreasing number What it is: This ratio calculates the average number of days required to collect receivables from the date of the transaction. A lower figure indicates the company has an effective collection policy. When to apply it: This measurement is particularly useful when a company carries a material accounts receivable balance in the normal course of its operations. Use this relative measure to ensure that collection periods are within the company’s policies and to detect a possible build-up of uncollectible receivables. Recommendations: We recommend that you ... Collection Period for Accounts Receivable 3.0 2.5 2.0 Days 1.5 1.0 0.5 0.0 1998 1999 2000 2001 2002 Jazzit CaseWare Made Easy
  • 13. Return on Sales (percent) Type of ratio: Profitability Ratio definition: [ Net Income / Total Sales ] Ratio status: Your return on sales is 7.0% whereas prior year was 5.4%. Desired trend: An increasing number What it is: Return on sales is also referred to as "net profit margin". This measurement is often referred to as the bottom line, taking into account all expenses including interest. It also reflects management's ability to effectively control the level of costs in relation to revenues generated from the business. The ratio is expressed as a percentage; for example 10% of sales is being generated as net earnings and is one of the most popular means of evaluating the profitability of a business because the data is readily available and easy to compute. This ratio varies widely from industry to industry. The average for companies is 5.5% but the figures vary from 0.75% for supermarkets to 40% for some software companies. This ratio is of interest to investors and creditors. When to apply it: One of the vital parts of a healthy business is to make sure your net profit margins are in line with industry norms. Looking at trends such as prior year's margins, the budgeted or anticipated margin is also important. An increasing net profit margin is a positive indicator. If the current profit margin is below a desirable level, management must seek ways of increasing revenues, decreasing cost of goods sold, decreasing operating expenses, or a combination of these items. A plan of action should only be taken once a detailed analysis of sales, cost of goods sold, and operating and administrative expenses has been completed. Recommendations: We recommend that you ... Return on Sales 15 10 Percentage 5 0 1998 1999 2000 2001 2002 Jazzit CaseWare Made Easy
  • 14. Net Profit to Equity (percent) Type of ratio: Profitability Ratio definition: [ Net Income / Average Owners' Equity ] Ratio status: Your net profit to equity is 11.4% whereas prior year was 9.8%. Desired trend: An increasing number What it is: This ratio measures the adequacy of the return on capital invested by shareholder's and represents their measure of profitability and indirectly the business's performance in using assets to generate earnings. For example, net income after taxes of 15% is being generated on common shareholder's equity. When using this ratio, it is important to be aware that there is no general rule of thumb as it varies from industry to industry. This ratio is being calculated based on an average balance. When to apply it: You want to be sure that you are getting a fair return for your capital invested and the associated risks taken in the business. If you are getting a return of 4% on your equity and the financial institutions are paying 6% on term deposits where no risk is involved, it definitely is time to step back and re-evaluate the core business. Recommendations: We recommend that you ... Net Profit to Equity 20 15 Percentage 10 5 0 1998 1999 2000 2001 2002 Jazzit CaseWare Made Easy
  • 15. Gross Profit Margin (percent) Type of ratio: Profitability Ratio definition: [ Gross Profit / Net Sales ] Ratio status: Your gross profit margin is 63.1% whereas prior year was 60.2%. Desired trend: An increasing number What it is: The gross profit margin indicates the efficiency of management in using its materials and labour in the production process. It shows the percentage of net sales remaining after subtracting cost of goods sold. A high gross profit margin indicates that a business can make a reasonable profit on its sales, as long as it keeps overhead costs in control. This ratio varies from industry to industry depending on factors such as competition, capital investment, and level of expenses other than cost of sales. Unless a business has an adequate gross profit, it cannot be profitable or finance essential expenditures such as research and development, or advertising. A ratio less than one means you are selling your product for less than it costs to produce. If this ratio remains less than one, you will not achieve profitability regardless of your volume or the efficiency of the rest of your business. When to apply it: This figure answers the question, "Am I pricing the goods or services properly?" A low margin - especially in relation to industry norms - could indicate you are under-pricing. If sales are slow and profits weak, it could indicate overpricing due to a high margin. This is most useful when viewed in relation to the business's past performance and the industry average. Recommendations: We recommend that you ... Gross Profit Margin 60 50 Percentage 40 30 20 10 0 1998 1999 2000 2001 2002 Jazzit CaseWare Made Easy
  • 16. Return on Total Assets (percent) Type of ratio: Profitability Ratio definition: [ ( Total Revenue - (Total Cost of Sales + Total Expenses - Interest Expenses) ) / Average Total Assets ] Ratio status: The return on total assets is 9.3% whereas prior year was 8.7%. Desired trend: An increasing number What it is: This number tells you how effective your business has been at employing its assets to work. This ratio relates the operating performance to the investments that the business has made, without regard to how the acquisition of those investments was financed. This ratio is useful when compared with the interest rate paid on the company's debt. For example, if the return on total assets ratio is 15 percent and the interest rate paid on its debt was 10 percent, the business's profit is 5 percentage points more than it paid in interest. The return is of particular interest to lenders and creditors in assessing financial leverage. The return varies from industry to industry. This ratio is being calculated based on an average balance. When to apply it: Return on total assets is an indicator of how profitable a company is. Use this ratio annually to compare your business's performance to your industry's norms. If your return on assets is lower than a competitor, it may be an indication that they have found a more efficient means to operate through financing, technology, quality control, or inventory management. Recommendations: We recommend that you ... Return on Total Assets 12 10 Percentage 8 6 4 2 0 1998 1999 2000 2001 2002 Jazzit CaseWare Made Easy
  • 17. Revenue to Equity Ratio Type of ratio: Profitability Ratio definition: [ Total Revenue / Owners' Equity ] Ratio status: Your revenue to equity ratio is 1.6 times whereas prior year was 1.7 times. Desired trend: An increasing number What it is: This ratio measures the profitability of a business and indicates the level of revenue being supported by each $1 of equity. The higher the percentage, the relatively better the profitability is. When to apply it: Use of this ratio can help to determine if the business has sufficient equity to support the current sales and projected growth in sales. It can also indicate when a business has accumulated too much equity (retained earnings) and may consider either a stock repurchase or dividend payout. Recommendations: We recommend that you ... Revenue to Equity Ratio 2.5 2.0 Times 1.5 1.0 0.5 0.0 1998 1999 2000 2001 2002 Jazzit CaseWare Made Easy
  • 18. Revenue to Closing Inventory Ratio (times) Type of ratio: Activity Ratio definition: [ Total Revenue / Closing Inventory ] Ratio status: Your revenue to closing inventory ratio is 10.5 times whereas prior year was 18.4 times. Desired trend: An increasing number What it is: This ratio, indicates how efficiently the company converts inventory into revenue over a period. When to apply it: Use this ratio to determine if the inventory on hand is sufficient to support the current sales level. If this ratio increases over time it may indicate that inventory is becoming obsolete. Recommendations: We recommend that you ... Revenue to Closing Inventory Ratio 30 25 20 Times 15 10 5 0 1998 1999 2000 2001 2002 Jazzit CaseWare Made Easy
  • 19. Inventory Turnover (days) Type of ratio: Activity Ratio definition: [ Cost of Sales / (Average Inventory/365 Days) ] Ratio status: Your inventory turnover is 74.5 days whereas prior year was 48.4 days. Desired trend: A decreasing number What it is: This ratio measures how efficiently a business turns over inventory during the course of the year. The ratio is often expressed in days by dividing the inventory turnover ratio into 365 days. For example, inventory turnover is 5 times during the year, which means it takes an average of 73 days to sell and replace the business's inventory. Inventory turnover ratio varies significantly from industry to industry. A high turnover ratio in comparison to the average for the industry usually means good inventory management. A high turnover ratio may result from a dramatic improvement in the economy or improved merchandising, but it could also mean lost sales because of inadequate inventory on hand. Alternatively, a low turnover ratio in comparison to the average for the industry usually means poor inventory management, possibly signalling a weakening economy, obsolete or damaged inventory, unsalable goods, overstock or overvalued inventory. In addition, if a large amount of capital is tied up in inventory, it may be more efficiently used elsewhere, such as reducing short term borrowing to reduce interest carrying costs. When to apply it: If your business has significant assets tied up in inventory, tracking your turnover is critical to successful financial planning. If a trend indicates a continual increasing ratio, this is a red flag for management to give more attention to inventory control, which may indicate current marketing efforts are inadequate and possibly market share is being lost, and a change is necessary. Recommendations: We recommend that you ... Inventory Turnover 60 Days 40 20 0 1999 2000 2001 2002 Jazzit CaseWare Made Easy
  • 20. Working Capital Turnover Ratio Type of ratio: Activity Ratio definition: [ Cost of Sales / Net Working Capital ] Ratio status: Your working capital turnover ratio is 4.7 times, whereas the prior year was (1.3) times. Desired trend: An increasing number What it is: The working capital turnover ratio measures the efficiency with which the working capital is being used by a firm. A high ratio indicates efficient utilization of working capital and a low ratio indicates otherwise. A very high working capital turnover ratio may also mean lack of sufficient working capital which is not a good situation. When to apply it: Use this ratio to analyze how effectively a company is using its working capital to generate sales. Recommendations: We recommend that you .... Working Capital Turnover Ratio 8 6 4 Times 2 0 -2 1998 1999 2000 2001 2002 Jazzit CaseWare Made Easy
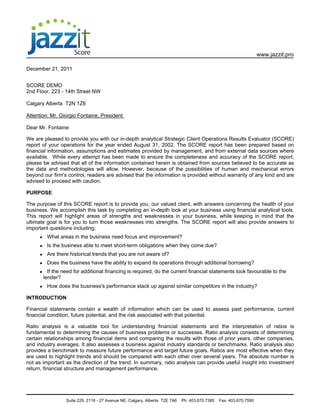
  • 21. Actual Compared to Expected Expenses Based on Total Revenue (dollars) What it is: This is a measurement of key expenses including cost of goods sold, occupancy (includes amortization, repairs and maintenance, utilities, and rent), financial (includes interest and professional fees), general (includes advertising, delivery, and insurance), and wages (includes wages, salaries and benefits) in comparison to benchmark or expected expenses based on this year's actual total revenue. Total revenue includes revenue from the sale of goods and services, interest, dividends, commissions, rent and other sources of revenue. It excludes capital gains or losses, extraordinary gains or losses, and equity in net income of related parties. When to apply it: To see if your expenses are in the "ball park" in relation to comparable industry benchmarks, the graph below illustrates a comparison of expected expenses to your actual expenses. Large variations will indicate that further investigation is warranted. Recommendations: We recommend that you ... Actual Compared to Expected Expenses Based on Current Year Total Revenue Actual Expected 300,000 200,000 $ 100,000 0 COGS Wages Occupancy Financial General Other Jazzit CaseWare Made Easy
  • 22. Current Year Expenses (percent) What it is: This is a summary of key expense areas in the income statement for the current year. The operating expense ratios measure the efficiency of management in controlling operating expenses. They are expressed as a percentage by dividing expenses, including cost of goods sold, occupancy (includes amortization, repairs and maintenance, utilities, and rent), financial (includes interest and professional fees), general (includes advertising, delivery, and insurance), wages (includes wages, salaries and benefits) and other indirect expenses by total revenue. Total revenue includes revenue from the sale of goods and services, interest, dividends, commissions, rent and other sources of revenue. It excludes capital gains or losses, extraordinary gains or losses, and equity in net income of related parties. When to apply it: It is of importance that you keep an eye on the expense ratios to make sure they are in line with your budgets and expectations. An excellent example is in the area of "cost of sales". Businesses generally want to see this ratio decreasing which means their direct costs to produce sales are costing less, thereby resulting in increased profitability. Recommendations: We recommend that you ... Current Year Expenses (including COGS) 8.7% Net profit 5.6% Other indirect expenses 2.8% General 6.2% Financial COGS 36.9% 7.8% Occupancy 31.9% Wages Jazzit CaseWare Made Easy
  • 23. Altman Z Score Type of ratio: Other Ratio definition: [ ( (Working Capital/Total Assets) x 6.56 ) + ( (Retained Earnings/Total Assets) x 3.26 ) + ( (Earnings Before Interest & Taxes/Total Assets) x 6.72 ) + ( (Total Equity/Total Liabilities) x 1.05 ) ] Ratio status: Your Altman Z score is 4.8 whereas prior year was 2.0. Desired trend: An increasing number What it is: This analytical procedure was developed by Edward Altman by combining various ratios to produce Z-scores. Z- scores below the threshold value of 2.6 indicate that the overall financial condition of the company and continued existence is questionable. Z-scores below 1.8 indicate that there is a strong potential for the business to be bankrupt within the next two years. A score between 1.8 and 2.6 is inconclusive. Remarkably, Altman's procedure has a proven 95% accuracy within the first year and 83% accuracy within two years. For any business, a Z-score above 3.0 is desirable as it indicates a healthy business. When to apply it: Use this procedure to assess your business's financial risk. Rather than looking at this procedure as a predictor of business failure, view it more as a procedure that raises red flags to help identity which individual ratios warrant a closer look. Once identified, take immediate action to mitigate the potential business failure looming on the horizon. Recommendations: We recommend that you ... Altman Z Score 5 4 3 Score 2 1 0 1998 1999 2000 2001 2002 Jazzit CaseWare Made Easy
  • 24. SCORE DEMO Jazzit Score Year end: August 31, 2002 Ratio Components 2002 2001 2000 1999 1998 Assets Current - trade receivable (TR) $ 3,244 $ 7,118 $ 7,230 $ 1,589 $ 2,694 Current -other quick (QA) 35,758 52,414 43,051 38,142 92,949 Current -inventory (IN) 80,797 47,613 44,776 43,162 35,261 Current -other (CA) 5,508 6,807 4,664 8,280 8,621 Capital - amortized cost (FD) 358,110 353,402 346,209 333,573 304,751 Capital - non amortized cost (FN) 510,271 510,271 510,271 510,271 510,271 Capital - accumulated amortization (FA) (163,995) (144,886) (123,481) (100,605) (75,102) Intangible assets (IA) - - - - - Other asset (OA) 59,021 66,019 76,977 70,214 66,153 Total Assets $ 888,714 $ 898,758 $ 909,697 $ 904,626 $ 945,598 Liabilities Current - trade payable (TP) $ 37,576 $ 36,460 $ 35,300 $ 38,266 $ 44,794 Current - other (CL) 20,434 335,594 172,347 412,865 51,776 Long term (LL) 294,619 20,272 242,715 36,853 468,145 Total Liabilities 352,629 392,326 450,362 487,984 564,715 Equity Equity - share capital (EQ) 40 40 40 40 40 Equity - retained earnings (RE) 566,046 506,392 497,294 465,302 396,094 Equity - dividend (DI) (30,000) - (38,000) (48,700) (15,251) Total Equity 536,086 506,432 459,334 416,642 380,883 Total Liabilities and Equity $ 888,715 $ 898,758 $ 909,696 $ 904,626 $ 945,598 * Indicates adjustments have been applied in current or prior periods. Prepared by Reviewed by SCORE Pg 1 of 9
  • 25. SCORE DEMO Jazzit Score Year end: August 31, 2002 Ratio Components 2002 2001 2000 1999 1998 Revenue Revenue - trade sales (SA) $ 851,844 $ 875,105 $ 906,686 $ 943,325 $ 1,035,218 Revenue - other sales (SO) 31 508 593 799 959 Revenue - other (RO) - - - 2,439 5,348 Total Revenue 851,875 875,613 907,279 946,563 1,041,525 Expenses - Cost of Sales Amortization (CD) - - - - - Change in inventory (CN) - - - - - Interest (CI) - - - - - Purchase (PU) - - - - - Repairs and maintenance (CR) - - - - - Other costs of sales (CS) 314,440 348,209 340,568 350,049 395,774 Total Cost of Sales 314,440 348,209 340,568 350,049 395,774 Expenses - Other Amortization (OD) 19,109 21,404 22,877 25,503 23,309 Non-cash (ON) - - - - - Income tax expense (IT) 14,516 12,453 16,397 20,885 35,769 Interest (OI) 23,032 31,138 33,090 35,029 41,025 Repairs and maintenance (OR) 19,633 5,855 20,109 29,688 7,051 Other expenses (OE) 401,490 409,456 393,547 400,950 388,587 Total Expenses 477,780 480,306 486,020 512,055 495,741 Operating Income (Loss) (NI) $ 59,655 $ 47,098 $ 80,691 $ 84,459 $ 150,010 Prepared by Reviewed by SCORE Pg 2 of 9
  • 26. SCORE DEMO Jazzit Score Year end: August 31, 2002 Balance Sheet ('000) Industry: Full service restaurant - 7221 Benchmark: Blank Current Year Previous Year Description Benchmark Comments Actual Actual Total assets 888.7 - 898.8 Total current assets 125.3 - 114.0 Accounts receivable and notes 3.2 - 7.1 Closing inventory 80.8 - 47.6 Other current assets 41.3 - 59.2 Net capital assets 704.4 - 718.8 Other assets and adjustments 59.0 - 66.0 Total liabilities 352.6 - 392.3 Total current liabilities 58.0 - 372.1 Current bank loans - - 324.0 Other current liabilities 58.0 - 48.1 Long-term liabilities 294.6 - 20.3 Total equity 536.1 - 506.4 Prepared by Reviewed by SCORE Pg 3 of 9
  • 27. SCORE DEMO Jazzit Score Year end: August 31, 2002 Expenses as a Percentage of Total Revenue Industry: Full service restaurant - 7221 Benchmark: Blank Expenditure Current Year Actual Benchmark Variance Previous Year Actual Comments Cost of goods sold (direct) 314,440 / 851,875 = 36.9 - 36.9 348,209 / 875,613 = 39.8 Wages and benefits - / 851,875 = - - - - / 875,613 = - Purchase, materials & sub-contracts 314,440 / 851,875 = 36.9 - 36.9 348,209 / 875,613 = 39.8 Opening inventory - / 851,875 = - - - - / 875,613 = - Closing inventory - / 851,875 = - - - - / 875,613 = - Operating expenses (indirect) 463,263 / 851,875 = 54.4 - 54.4 467,852 / 875,613 = 53.4 Labour and commissions 271,950 / 851,875 = 31.9 - 31.9 262,116 / 875,613 = 29.9 Amortization and depletion 19,109 / 851,875 = 2.2 - 2.2 21,404 / 875,613 = 2.4 Repairs and maintenance 19,633 / 851,875 = 2.3 - 2.3 5,855 / 875,613 = 0.7 Utilities and telephone/telecom 26,432 / 851,875 = 3.1 - 3.1 26,593 / 875,613 = 3.0 Rent 1,123 / 851,875 = 0.1 - 0.1 313 / 875,613 = - Interest and bank charges 23,032 / 851,875 = 2.7 - 2.7 31,138 / 875,613 = 3.6 Professional and business fees 29,791 / 851,875 = 3.5 - 3.5 29,548 / 875,613 = 3.4 Advertising and promotion 15,192 / 851,875 = 1.8 - 1.8 17,832 / 875,613 = 2.0 Delivery, shipping and warehouse exp - / 851,875 = - - - - / 875,613 = - Insurance 9,064 / 851,875 = 1.1 - 1.1 9,270 / 875,613 = 1.1 Other expenses 47,937 / 851,875 = 5.6 - 5.6 63,783 / 875,613 = 7.3 Total expenses 777,703 / 851,875 = 91.3 - 91.3 816,061 / 875,613 = 93.2 Net profit / loss 74,172 / 851,875 = 8.7 - 8.7 59,552 / 875,613 = 6.8 Prepared by Reviewed by SCORE Pg 4 of 9
  • 28. SCORE DEMO Jazzit Score Year end: August 31, 2002 5 Year Expenses as a Percentage of Total Revenue 2002 2001 2000 1999 1998 Expenditure Actual Actual Actual Actual Actual Comments Cost of goods 36.9 39.8 37.5 37.1 38.2 sold (direct) Wages and benefits - - - - - Purchases, materials and 36.9 39.8 37.5 37.1 38.2 sub-contracts Opening inventory - - - - - Closing inventory - - - - - Operating expenses 54.4 53.4 51.8 52.0 44.4 (indirect) Labour and commissions 31.9 29.9 29.8 28.8 24.4 Amortization and depletion 2.2 2.4 2.5 2.7 2.2 Repairs and 2.3 0.7 2.2 3.1 0.7 maintenance Utilities and telephone/tele- 3.1 3.0 2.6 2.4 2.2 communications Rent 0.1 - 0.1 - 0.1 Interest and bank charges 2.7 3.6 3.6 3.7 4.0 Professional and business 3.5 3.4 3.6 3.6 3.3 fees Advertising and promotion 1.8 2.0 1.2 1.5 0.9 Delivery, shipping and - - - - - warehouse expenses Insurance 1.1 1.1 0.9 0.9 0.8 Other expenses 5.7 7.3 5.3 5.3 5.8 Total expenses 91.3 93.2 89.3 89.1 82.6 Net profit / loss 8.7 6.8 10.7 10.9 17.4 Prepared by Reviewed by SCORE Pg 5 of 9
  • 29. SCORE DEMO Jazzit Score Year end: August 31, 2002 Variance From Expected Expenses Current Year Expected $ Expenditure Current Year Actual Comments Total Revenue x Benchmark = Expected Expense Variance Cost of goods sold (direct) 314,440 851,875 x - = - 314,440 Wages and benefits - 851,875 x - = - - Purchases, materials and sub-contracts 314,440 851,875 x - = - 314,440 Opening inventory - 851,875 x - = - - Closing inventory - 851,875 x - = - - Operating expenses (indirect) 463,263 851,875 x - = - 463,263 Labour and commissions 271,950 851,875 x - = - 271,950 Amortization and depletion 19,109 851,875 x - = - 19,109 Repairs and maintenance 19,633 851,875 x - = - 19,633 Utilities and telephone / telecom 26,432 851,875 x - = - 26,432 Rent 1,123 851,875 x - = - 1,123 Interest and bank charges 23,032 851,875 x - = - 23,032 Professional and business fees 29,791 851,875 x - = - 29,791 Advertising and promotion 15,192 851,875 x - = - 15,192 Delivery, shipping and warehouse exp - 851,875 x - = - - Insurance 9,064 851,875 x - = - 9,064 Other expenses 47,937 851,875 x - = - 47,937 Total expenses 777,703 851,875 x - = - 777,703 Net profit / loss* 74,172 851,875 x - = - 74,172 Prepared by Reviewed by SCORE Pg 6 of 9
  • 30. SCORE DEMO Jazzit Score Year end: August 31, 2002 Key Financial Ratios Industry: Full service restaurant - 7221 Benchmark: Blank Description Current Year Actual Benchmark Previous Year Actual Comments 125,307 = 2.2 - 113,952 = 0.3 Current ratio (times) 58,010 372,054 39,002 = 0.7 - 59,532 = 0.2 Quick ratio (times) 58,010 372,054 5,801,000 = 10.8 37,205,400 = 73.5 Current debt to equity (%) - 536,086 506,432 352,629 = 0.7 - 392,326 = 0.8 Debt to equity ratio (times) 536,086 506,432 97,203 = 4.2 - 90,689 = 2.9 Interest coverage ratio (times) 23,032 31,138 352,629 = 0.4 - 392,326 = 0.4 Debt ratio (times) 888,714 898,758 Cash flow from operations 78,764 = 0.2 - 68,502 = 0.2 to total debt (times) 352,629 392,326 70,438,600 = 131.4 71,878,700 = 141.9 Net fixed assets to equity (%) - 536,086 506,432 3,244 = 1.4 7,118 = 3.0 Collection period for accounts receivable - 2,334 2,399 59,655 = 7.0 - 47,098 = 5.4 Return on sales (%) 851,875 875,613 59,655 = 11.4 - 47,098 = 9.8 Net profit to equity (%) 521,259 482,883 537,404 = 63.1 - 526,896 = 60.2 Gross profit margin (%) 851,844 875,105 82,687 = 9.3 - 78,236 = 8.7 Return on total assets (%) 893,736 904,228 851,875 = 1.6 875,613 = 1.7 Revenue to equity ratio - 536,086 506,432 851,875 = 10.5 875,613 = 18.4 Revenue to closing inventory ratio - 80,797 47,613 314,440 = 74.5 - 348,209 = 48.4 Inventory turnover (days) 64,205 46,195 Prepared by Reviewed by SCORE Pg 7 of 9
  • 31. SCORE DEMO Jazzit Score Year end: August 31, 2002 Key Financial ratios Industry: Full service restaurant - 7221 Benchmark: Blank Description Current Year Actual Benchmark Previous Year Actual Comments 314,440 = 4.7 348,209 = (1.3) Working Capital Turnover Ratio - 67,297 (258,102) Altman Z score 4.8 - 2.0 Prepared by Reviewed by SCORE Pg 8 of 9
  • 32. SCORE DEMO Jazzit Score Year end: August 31, 2002 5 Year Key Financial Ratios 2002 2001 2000 1999 1998 Description Actual Actual Actual Actual Actual Comments Current ratio (times) 2.16 0.31 0.48 0.20 1.44 Quick ratio (times) 0.67 0.16 0.24 0.09 0.99 Current debt to equity(%) 10.82 73.47 45.21 108.28 25.35 Debt to equity ratio (times) 0.66 0.77 0.98 1.17 1.48 Interest coverage ratio (times) 4.22 2.91 3.93 4.01 5.53 Debt ratio (times) 0.40 0.44 0.50 0.54 0.60 Cash flow from operations to 0.22 0.17 0.23 0.23 0.31 total debt (times) Net fixed assets to equity(%) 131.39 141.93 159.58 178.39 194.26 Collection period for accounts 1.39 2.97 2.91 0.61 0.94 receivable Return on sales (%) 7.00 5.38 8.89 8.95 14.48 Net profit to equity (%) 11.44 9.75 18.42 21.18 - Gross profit margin (%) 63.09 60.21 62.44 62.89 61.77 Return on total assets (%) 9.25 8.65 12.54 12.92 - Revenue to equity ratio 1.59 1.73 1.98 2.27 2.73 Revenue to closing inventory 10.54 18.39 20.26 21.93 29.54 ratio Inventory turnover (days) 74.53 48.42 47.12 40.89 N/A Working Capital Turnover 4.67 (1.35) (3.16) (0.97) 9.21 Ratio Altman Z score 4.79 1.99 2.90 0.83 3.93 Prepared by Reviewed by SCORE Pg 9 of 9