Recommended

Recommended
More Related Content
Similar to Electrical Imaging Potential for Crop Phenotyping
Similar to Electrical Imaging Potential for Crop Phenotyping (20)
More from SSSB
Recently uploaded
Recently uploaded (20)
Electrical Imaging Potential for Crop Phenotyping
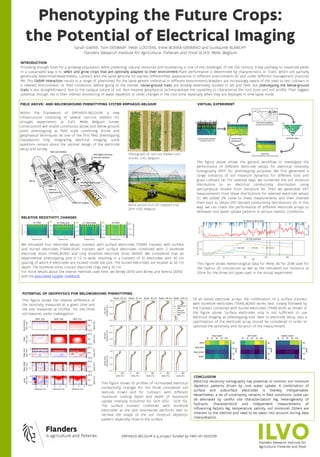
- 1. Phenotyping the Future Crops: the Potential of Electrical Imaging Sarah GARRE, Tom DESWAEF, Peter LOOTENS, Irene BORRA-SERRANO and Guillaume BLANCHY Flanders Research Institute for Agriculture, Fisheries and Food (ILVO), Melle, Belgium INTRODUCTION Providing enough food for a growing population while preserving natural resources and biodiversity is one of the challenges of the 21st century. A key pathway to maximize yields in a sustainable way is to select and grow crops that are optimally adapted to their environment.Plant performance is determined by characteristics or ‘traits’ which are partially genetically determined.Nevertheless, cultivars with the same genome (G) express differentPete appearances in different environments (E) and under different management practices (M). This GxExM interaction results in a range of ‘phenomes’ for the same genetic individual in different environments.Breeders are increasingly aware of the need to test cultivars in a relevant environment, i.e. field conditions, before going to the market. Above-ground traits are already extensively studied in lab and field, but phenotyping the below-ground traits is less straightforward, due to the opaque nature of soil. Non-invasive geophysical techniqueshave the capability to characterize the root zone and soil profile. Their biggest potential, though, lies in their indirect monitoring of water depletion or other changes in the root zone, especially when they are deployed in time-lapse mode. Within the framework of EMPHASIS-BELGIUM, a new infrastructure consisting of several rain-out shelters for drought experiments at ILVO, Melle, Belgium (under construction) will enable continuous above and below ground plant phenotyping at field scale combining drone and geophysical techniques. As one of the first field phenotyping installations fully integrating electrical imaging, some questions remain about the optimal design of the electrode setup and survey. Photograph of rain-out shelters and drones, ILVO, Belgium. Aerial picture EUCLEG soybean trial 2019, ILVO, Belgium The figure above shows the general workflow to investigate the performance of different electrode setups for electrical resistivity tomography (ERT) for phenotyping purposes. We first generated a range scenarios of soil moisture dynamics for different soils and grass cultivars (a). For selected days, we converted the soil moisture distribution to an electrical conductivity distribution using petrophysical models from literature (b). Then we generated ERT measurements from these distributions for selected electrode setups (c). We added 2% noise to these measurements and then inverted them back to obtain ERT-derived conductivity distributions (d). In this way, we can check the performance of different electrode arrays to delineate root water uptake patterns in various realistic conditions. FIELD ABOVE- AND BELOWGROUND PHENOTYPING SYSTEM EMPHASIS-BELGIUM VIRTUAL EXPERIMENT This figure shows meteorological data for Melle, BE for 2018 used for the Hydrus 2D simulations as wel as the simulated soil moisture at 20cm for the three soil types used in the virtual experiment. RELATIVE RESISTIVITY CHANGES We simulated four electrode setups: transect with surface electrodes (TRAN), transect with surface and buried electrodes (TRAN_BUR), transect with surface electrodes combined with 2 borehole electrode sticks (TRAN_BORE) and only borehole electrode sticks (BORE). We considered that an experimental phenotyping plot is 1.5 m wide, resulting in a transect of 10 electrodes with 30 cm spacing of which 6 electrodes are located inside the plot. The buried electrodes are located at 50 cm depth. The borehole sticks contain electrode rings every 20 cm. For more details about the inverse methods used here, see Binley (2015) and Binley and Kemna (2005) and the associated Jupyter notebook. POTENTIAL OF GEOPHYSICS FOR BELOWGROUND PHENOTYPING This figure shows the relative difference of the resistivity measured at a given time and the one measured at DOY152 for the three soil textures under investigation. This figure shows 1D profiles of normalized electrical conductivity changes for the three considered soil textures (rows) and for ‘cultivars’ with different maximum rooting depth and depth of maximum uptake intensity (columns) for DOY 2012 - DOY 152. The surface transect combined with borehole electrodes at the plot boundaries performs best to retrieve the shape of the soil moisture depletion pattern, especially close to the surface. Of all tested electrode arrays, the combination of a surface transect with borehole electrodes (TRAN_BORE) works best, closely followed by the transect combined with buried electrodes (TRAN_BUR) as shown in the figure above. Surface electrodes only is not sufficient to use electrical imaging as phenotyping tool. Next to electrode setup, also a optimization of the electrode array should be considered in order to optimize the sensitivity and duration of the measurement. CONCLUSION Electrical resistivity tomography has potential to monitor soil moisture depletion patterns driven by root water uptake. A combination of surface and subsurface electrodes is thereby indispensable. Nevertheless, a lot of uncertainty remains in field conditions. Some can be alleviated by careful site characterization (eg. heterogeneity of hydraulic characteristics) and independent measurements of influencing factors (eg. temperature, salinity, soil moisture). Others are inherent to the method and need to be taken into account during data interpretation. EMPHASIS-BELGIUM is a project funded by FWO-IRI I002121N