Presentations with Gantt Charts
•
2 likes•1,018 views

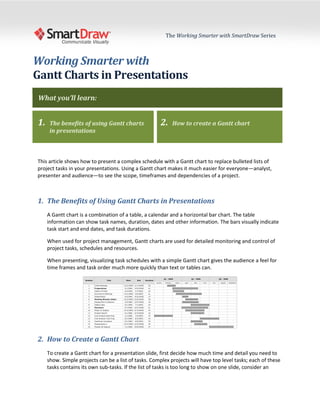
This article shows how to present a complex schedule with a Gantt chart to replace bulleted lists of project tasks in your presentations. Using a Gantt chart makes it much easier for everyone—analyst, presenter and audience—to see the scope, timeframes and dependencies of a project.

Recommended
More Related Content
More from SmartDraw Software
More from SmartDraw Software (16)
Recently uploaded
Recently uploaded (20)
Presentations with Gantt Charts
- 1. The Working Smarter with SmartDraw Series Working Smarter with Gantt Charts in Presentations What you’ll learn: 1. The benefits of using Gantt charts 2. How to create a Gantt chart in presentations This article shows how to present a complex schedule with a Gantt chart to replace bulleted lists of project tasks in your presentations. Using a Gantt chart makes it much easier for everyone—analyst, presenter and audience—to see the scope, timeframes and dependencies of a project. 1. The Benefits of Using Gantt Charts in Presentations A Gantt chart is a combination of a table, a calendar and a horizontal bar chart. The table information can show task names, duration, dates and other information. The bars visually indicate task start and end dates, and task durations. When used for project management, Gantt charts are used for detailed monitoring and control of project tasks, schedules and resources. When presenting, visualizing task schedules with a simple Gantt chart gives the audience a feel for time frames and task order much more quickly than text or tables can. 2. How to Create a Gantt Chart To create a Gantt chart for a presentation slide, first decide how much time and detail you need to show. Simple projects can be a list of tasks. Complex projects will have top level tasks; each of these tasks contains its own sub-tasks. If the list of tasks is too long to show on one slide, consider an
- 2. overview slide illustrating the top-level tasks. If you want to show the detailed sub-tasks, tackle each top-level task on its own slide. List your tasks and sub-tasks, generally listing the earliest starting top-level tasks first. Show the task number, task name, start date, end date and duration. When you have a top-level task with sub-tasks, indent the sub-tasks. To the right, lay out your calendar at the scale necessary to show your task durations. Finally, add a bar for each task showing the duration from the start date to the end date. For top- level tasks, the duration starts with the earliest sub-task start date and ends with the latest sub-task end date. SmartDraw is a trademark of SmartDraw.com • 9909 Mira Mesa Blvd., San Diego, CA 92131, USA • www.smartdraw.com Phone: (858) 225-3300 • Toll Free (800) 768-3729 • Fax: (858) 225-3390 • E-mail: sales@smartdraw.com • ©2008 SmartDraw.com all rights reserved. 2
- 3. This looks good, but we can make it even better with some colors and styles. First, let’s color each top-level task with different colors. This will help us distinguish one from the other. Also, if different teams or individuals will work on each task, you can use color coding to identify these resources. Finally, let’s add a few more effects to make a clear, impactful slide of the project. To watch a video on how to make a Gantt chart with SmartDraw click here. This document is part of the Working Smarter Series—a collection of publications describing proven tactics for improving business operations, provided free by SmartDraw.com. To download a free trial of SmartDraw, visit www.smartdraw.com SmartDraw is a trademark of SmartDraw.com • 9909 Mira Mesa Blvd., San Diego, CA 92131, USA • www.smartdraw.com Phone: (858) 225-3300 • Toll Free (800) 768-3729 • Fax: (858) 225-3390 • E-mail: sales@smartdraw.com • ©2008 SmartDraw.com all rights reserved. 3