SlideShare a Scribd company logo
1 of 30
Download to read offline
THEIMPACTOFDUTCHIMPORTSONNATURELOSSWORLDWIDE
THEIMPACTOF
DUTCHIMPORTS
ONNATURELOSS
WORLDWIDE
OURLANDFOOTPRINTFORSOY,PALMOIL,MAIZE,
COCONUT,COCOA,COFFEE,BEEF&LEATHERANDTIMBER
© Edward Parker / WWF
THEIMPACTOFDUTCHIMPORTSONNATURELOSSWORLDWIDE THEIMPACTOFDUTCHIMPORTSONNATURELOSSWORLDWIDE
2 3
INTRODUCTION..........................................................5
KEYFINDINGSFORTHENETHERLANDS...............................6
RECOMMENDATIONS.................................................. 12
COMMODITYSPECIFICFINDINGS.................................... 16
SOY............................................................... 16
PALMOIL......................................................... 22
MAIZE........................................................... 28
COCOA............................................................ 32
COFFEE........................................................... 38
COCONUT......................................................... 42
BEEFANDLEATHER............................................. 46
TIMBER.......................................................... 50
OVERVIEWOFMETHODOLOGY...................................... 54
REFERENCES.......................................................... 56
CONTENTS
This report summarises findings of original research undertaken by Alauda Consulting Ltd and WWF Netherlands
Authors: Steve Jennings (Alauda Consulting), Seline Meijer and Corné van Dooren (WWF Netherlands)
The following provided invaluable feedback into one or more versions of this report: Aditya Benyamin (WWF
Indonesia), David Boyd (WWF Netherlands), Sarah Doornbos (WWF Netherlands), Roberty Pamphyl Essama
(WWF Cameroon), Cécile Lachaux (WWF France), Steve Mualim (WWF Indonesia), Sandra Mulder (WWF
Netherlands), Natasja Oerlemans (WWF Netherlands), Nicolas Poolen (WWF Netherlands), Angga Prathama
Putra (WWF Indonesia), Anneke Rooth (WWF Netherlands), Joko Sarjito (WWF Indonesia), Anke Schulmeister-
Oldenhove (WWF-EU), Daniel Silva (WWF Brazil), Guillaume Tessier (WWF Brazil), and Jean-François
Timmers (WWF Brazil).
Design: WWF Netherlands
Publication date: September 2022
THEIMPACTOFDUTCHIMPORTSONNATURELOSSWORLDWIDE THEIMPACTOFDUTCHIMPORTSONNATURELOSSWORLDWIDE 5
© Shutterstock / Rich Carey / WWF-Sweden
INTRODUCTION
We are in an era of unprecedented global environmental
change, driven almost entirely by human activities.
The climate crisis, disruption of biogeochemical cycles,
conversion of natural ecosystems, overfishing and
pollution are driven by overconsumption, unsustainable
extraction rates, and by the methods we use to produce
the goods we consume.
	 One of the major drivers of the biodiversity and climate
emergencies is the conversion of natural ecosystems.
Eighty per cent of global deforestation results from
agriculture which produces the commodities we
consumers take for granted and increasingly demand.
Furthermore, the conversion of natural ecosystems
often results in local and indigenous peoples losing
their customary land, and along with it, part of their
traditional livelihoods and cultural reference.
	 The European Commission is developing legislation
making it mandatory for companies to conduct due
diligence on deforestation and degradation associated
withthecommoditiestheyplaceontheEuropeanmarket.
As it stands now, this regulation will have a profound
effect on companies operating in the Netherlands –
obliging them to be truly vigilant and transparent
about the environmental harms embedded within their
global supply chains. It is crucial that the EU legislation
is strong and effective, covering the conversion of all
natural ecosystems and all relevant commodities and
their products. A robust legal framework is an important
starting point to motivate businesses to reconsider their
impact on deforestation and conversion, yet they should
notstopatmeetingthebareminimumlegalrequirements
of this regulation and use this opportunity to eliminate
deforestation and conversion and human rights abuses
from their supply chain and that of their suppliers.
	 The purpose of this report is to highlight the critical
role that the Netherlands plays in importing and
trading agricultural and forest commodities that are
associated with deforestation and conversion. The
report assesses the quantity and provenance of the
Netherlands’ import and use of eight deforestation
and conversion risk commodities: soy, palm oil, maize,
coconut, cocoa, coffee, beef & leather, and timber. It
estimates the area of land required to supply these
imports, the risk of deforestation and conversion, and
social issues associated with that land footprint, and
the resulting greenhouse gas emissions. It provides
recommendations for governments, businesses, the
financial sector and citizens.
EIGHTYPERCENTOF
GLOBALDEFORESTATION
RESULTSFROM
AGRICULTUREWHICH
PRODUCESTHE
COMMODITIESWE
CONSUMERSTAKE
FORGRANTEDAND
INCREASINGLYDEMAND
THEIMPACTOFDUTCHIMPORTSONNATURELOSSWORLDWIDE THEIMPACTOFDUTCHIMPORTSONNATURELOSSWORLDWIDE
6
Landfootprintandgreenhousegasemissions
The land required to supply the Netherlands’ imports of just
eight commodities (soy, palm oil, maize, coconut, cocoa,
coffee, beef & leather, and timber) is an estimated 17.3
million hectares a year. This is equivalent to more than
four times the Netherlands’ land area.
The largest contributions to the Netherlands’ external land
footprint are imports of timber (5.1 million hectares each
year), beef & leather (3.9 million hectares), soy (2.7 million
hectares) and cocoa (2.5 million hectares). The greenhouse
gas emissions associated with the conversion of natural
ecosystems for the six commodities for which emissions
could be estimated (soy, palm oil, maize, cocoa, coconut
and coffee) amounted to an average of 43.6 million tonnes
of CO2-equivalent each year between 2017 and 2021. This is
KEYFINDINGSFORTHENETHERLANDS
equivalent to 24% of the Netherlands’ domestic greenhouse
gas emissions in 2019. Three commodities, soy (50%),
cocoa (26%) and maize (16%) are together responsible for
over 90% of these greenhouse gas emissions.
EMISSIONS FROM LAND USE CHANGE
ASSOCIATED WITH IMPORTS OF JUST
SIX COMMODITIES ARE EQUIVALENT
TO ALMOST ONE QUARTER OF
THE NETHERLANDS’ DOMESTIC
GREENHOUSE GAS EMISSIONS
© Peter Caton / WWF-UK
7
0
1,000,000
2,000,000
3,000,000
4,000,000
5,000,000
6,000,000
7,000,000
8,000,000
9,000,000
10,000,000
11,000,000
12,000,000
13,000,000
14,000,000
15,000,000
16,000,000
17,000,000
GreenhousegasemissionsfromlandusechangeassociatedwiththeNetherlandsimports,bycommodity
Averageannuallandfootprint(%thesize
oftheNetherlands),bycommodity
TonnesCO2
eq
SOY
PALMOIL
MAIZE
COCOA
COCONUT
COFFEE
13,000,000
14,000,000
15,000,000
16,000,000
17,000,000
428.770
tonnesCO2
eq
197.927
tonnesCO2
eq
11.349.657
tonnesCO2
eq
6.911.675
tonnesCO2
eq
2.852.858
tonnesCO2
eq
21.903.777
tonnesCO2
eq
ANAREAFOURTIMESTHESIZEOF
THENETHERLANDSISREQUIRED
EACHYEARTOSUPPLYTHE
NETHERLANDS’IMPORTSOFJUST
EIGHTCOMMODITIES
65%	 SOY
19%	 PALMOIL
37%	 MAIZE
60%	 COCOA
12%	 COCONUT
5%	 COFFEE
122%	 TIMBER
95%	 BEEF&LEATHER
415%	 TOTAL
0
0
20
20
40
40
60
60
80
80
100
100
120
120
806.346ha
1.532.095ha
502.494ha
2.499.164ha
202.523ha
5.074.608ha
3.926.662ha
2.713.503ha
THEIMPACTOFDUTCHIMPORTSONNATURELOSSWORLDWIDE THEIMPACTOFDUTCHIMPORTSONNATURELOSSWORLDWIDE
Highriskfootprint
Forty-three percent of the imported land footprint – 7.5
million hectares – is from countries that have a high or
very high risk of deforestation, poor rule of law and a
poor record of labour rights. A high proportion of the
land footprints of imported palm oil (86%), cocoa (80%),
coffee (69%) soy (48%) and timber (30%) is produced by
countries assessed to have a high or very high risk. Large
areas of land in high risk countries are also required to
supply the Netherlands with commodities such as maize
and coconuts, which have received less attention for their
environmental impacts.
Tradingdeforestation
The Netherlands is a significant global actor in the trade of
many of these commodities. For example, it imports 23%
of the cocoa produced globally. The Netherlands exports a
high proportion of these imported commodities to other
countries, often after additional processing (for example of
cocoa into chocolate). For example, 85% of soy imports are
exported to other countries, and over half of all imported
palm oil, cocoa, coffee, coconut, timber and beef and leather
are exported. Exports of products from the Netherlands
require an estimated 57% of the total land footprint (9.9
million hectares) emphasising the Netherlands’ critical
role in international trade, and the country’s global
responsibility for ensuring that commodities are free from
deforestation and conversion and social harm.
THE NETHERLANDS EXPORTS
REQUIRE 57% OF THE IMPORTED
LAND FOOTPRINT TO PRODUCE,
EMPHASISING THE COUNTRY’S
GLOBAL RESPONSIBILITY FOR
ENSURING THAT COMMODITIES ARE
FREE FROM DEFORESTATION AND
CONVERSION AND SOCIAL HARM
ENVIRONMENTALDEFENDERS
The production of agricultural and forest
commodities can sometimes be associated
with social impacts beyond the issues of
rule of law and workers’ rights that are
assessed in this analysis. Amongst the
most extreme of these is the killing of
environmental defenders.
In 2020, at least 227 environmental defenders
who were taking peaceful action against
environmental destruction were murdered
globally1
. At least a third of these were indigenous
people. Logging and agribusiness were amongst
the leading motives for these murders and for
other human rights abuses perpetrated against
environmental defenders. The Netherlands
imports significant quantities of commodities
associated with deforestation and conversion
from many of the countries in which the highest
number of environmental defenders were killed:
coffee and palm oil from Colombia (65 killings),
coconuts from the Philippines (29), soy, maize,
coffee, and beef and leather from Brazil (20),
and palm oil and coffee from Honduras (17).
9
© Andre Dib / WWF Brazil
©
Tessel
in
't
Veld
/
WWF-Netherlands
Txai Suruí is an environmental defender
protecting the Amazon
THEIMPACTOFDUTCHIMPORTSONNATURELOSSWORLDWIDE
10 11
RISKSCORE
>11VeryHighRisk
9-10HighRisk
7-8MediumRisk
5-6Medium-lowRisk
4LowRisk
GLOBALSNAPSHOT
BEEFAND
LEATHER
SOY PALMOIL MAIZE COCOA COFFEE COCONUT TIMBER
GUATEMALA
RISKSCORE:10
HONDURAS
RISKSCORE:10
PERU
RISKSCORE:12
ECUADOR
RISKSCORE:10
ARGENTINA
RISKSCORE:10
CÔTED’IVOIRE
RISKSCORE:9
NIGERIA
RISKSCORE:12
BRAZIL
RISKSCORE:11
CAMEROON
RISKSCORE:11
COLOMBIA
RISKSCORE:11
RUSSIA
RISKSCORE:9
CHINA
RISKSCORE:9
INDONESIA
RISKSCORE:12
MALAYSIA
RISKSCORE:11
VIETNAM
RISKSCORE:9
PAPUANEW
GUINEA
RISKSCORE:9
SRILANKA
RISKSCORE:9
160.617ha 1.144.307ha
40.137ha
47.563ha
24.325ha
143.688ha
365.290ha
72.231ha
109.335ha
57.469ha
1.123.351ha
425.567ha
358.709ha
23.865ha
7.018ha 22.217ha
4.757ha
59.000ha
10.359ha
2.220ha
596ha
43.319ha
21.945ha
371.908ha
1.846.518ha
489.838ha
1.395.198ha
3.633ha
164.998ha
THEIMPACTOFDUTCHIMPORTSONNATURELOSSWORLDWIDE THEIMPACTOFDUTCHIMPORTSONNATURELOSSWORLDWIDE
12
RECOMMENDATIONS
The Netherlands is signatory to several international
instruments and commitments to prevent deforestation.
Under the Aichi biodiversity targets it has agreed to ensure
that the ‘rate of loss of all natural habitats, including
forests, is at least halved and where feasible brought
close to zero, and degradation and fragmentation is
significantly reduced’2
. The Glasgow Leaders’ Declaration
on Forests and Land Use commits to ‘conserve forests
and other terrestrial ecosystems’3
. It is difficult to see
how the EU’s environmental aspirations - such as ‘to have
a neutral or positive environmental impact’4
- could be
achieved if deforestation and conversion of all ecosystems
are not eliminated from the Netherlands’ supply chains.
Despite the commitments, global deforestation and
biodiversity loss continues at an alarming rate and failure
to fully account for the Netherlands’ deforestation footprint
and associated risks overseas threatens the country’s
environmental credibility and the long-term sustainability
of commodity supply.
Wecallon…
THEGOVERNMENT
→ Support a strong EU regulation on deforestation-free
products as an outcome of the ongoing political process by:
● Demanding that the scope of the EuropeanCommission
proposal is extended beyond deforestation and forest
degradation to also include the conversion of natural
ecosystems such as grasslands, savannahs and
wetlands and that all deforestation and conversion
risk commodities, their products and by-products are
included within the scope of the regulation. The scope
should also include a definition that meaningfully
protects forests from degradation.
● Providing a stringent due diligence system with full
traceability of all commodities and products to the site
of production, to ensure effective transparency of the
supply chains, respect of protected areas, protection
of traditional communities´ land rights and inclusion as
well as active participation of all relevant stakeholders,
including smallholder producers.
● Ensuring effective and timely monitoring and
implementation of the new legislation through providing
sufficient resources to the Dutch authorities involved
in the enforcement of the new law, including through
carrying out a sufficient number of checks and applying
dissuasive penalties and sanctions when the law is broken.
→ Pushing for strong action targets, in partnership with
key producer and consumer countries to protect species
and habitats as part of the Post-2020 Global Biodiversity
Framework under the Convention on Biological Diversity.
→ Taking responsibility as a major trading nation to
eliminate deforestation, conversion of natural ecosystems
and human rights abuses from commodity production
and promote fair and transparent supply chains through
bilateral and multilateral initiatives.
COMPANIES
→ Set robust policies, time-bound commitments and
implement transparent monitoring, verification and public
reporting to eliminate deforestation and conversion and
human rights abuses from all supply chains by 2025 at the
latest, with a cut-off-date for deforestation and conversion
of 2020. This includes materials that are imported to the
Netherlands and then traded (after further processing or
otherwise) with other countries. Policies, commitments and
processes should be fully aligned with the Accountability
Framework and WWF DCF Principles and Asks.
→ Increase transparency of supply chains and require
traceability for all commodity volumes sourced from direct
and indirect suppliers – ensuring that traceability cascades
upstream to the origin through supplier requirements and
engagement.
© Maarten Zeehandelaar / Shutterstock
THEIMPACTOFDUTCHIMPORTSONNATURELOSSWORLDWIDE THEIMPACTOFDUTCHIMPORTSONNATURELOSSWORLDWIDE
→ Advocate for further action among peers and wider
stakeholders (e.g. government and civil society) for
policies to achieve deforestation/conversion-free supply
chains (e.g. supporting calls for robust environmental and
social standards in trade agreements, national and EU
legislation).
→ Collaborate with relevant stakeholders – including
smallholder producers – in production landscapes and
biomes to overcome systemic drivers of deforestation,
conversion, and human rights abuses and to achieve
long-term protection, restoration, and inclusive local
development outcomes across these landscapes.
FINANCIALINSTITUTIONS
→ Set clear and immediate policies with defined goals and
pre-screening and monitoring systems in line with proposed
due diligence commitments for the finance sector in the
deforestation law and which align with WWF guidance
on deforestation for financial institutions. These policies
should ensure that no lending or investments are associated
with illegal environmental or social practices, or with any
deforestation or conversion of natural ecosystems, nor
any further destruction of nature. Policies and systems for
green- or sustainability-labelled financial products should
be aligned with the EU taxonomy for sustainable activities
to ensure consistency and transparency.
→ Assess and disclose current risk exposure through an
assessment of investees and clients’ operations. Engage early
with identified clients and investees to align their activities
withdeforestationandconversionfreepolicy.Reportpublicly
on risks, opportunities, dependencies and impacts and on
the progress in addressing these; and request clients to do
so. The Taskforce for Nature-related Financial Disclosures
(TNFD) will provide a framework for this reporting that
can ensure consistency across the industry.
→ Invest at scale in opportunities linked to nature positive
activities through instruments such as green bonds or
sustainability focused funds and enable the transition to
15
sustainable commodity production (e.g. finance sustainable
agriculture practices, nature-based solutions, and support
projects to improve sustainability in at risk landscapes).
CITIZENS
→ Adopt a "planet-based diet" to reduce the demand
for agricultural expansion which drives deforestation
and conversion:
● Eat more plant-based and less animal-based foods.
●Buyfreshandlocalproductsaboveultra-processedfoods.
● Choose products from a more sustainable method
of agriculture, with a preference for organic products.
● Bring more variation and balance to your plate,
everything in moderation.
→ Pressure your national minister and Members of
European Parliament to support strengthening of the
draft EU deforestation due diligence regulation and other
regulations and agreements to halt the destruction of
nature and safeguard human rights.
→ Demand greater transparency and action from your
supermarket and favourite brands to ensure that the
products you enjoy are not associated with deforestation,
conversion, or human rights abuses.
© Laurens Verhoeven / Shutterstock
SOY
Global soy production has increased eightfold since the
1960s. This growth in production has been dominated
by three countries: Argentina, Brazil and the USA, which
together account for more than 80% of global production.
	 Most soy is processed into meal and oil, with direct
human consumption minimal outside East Asia. Soy
meal is high protein and is widely used as livestock feed,
especially for poultry and pigs but also in aquaculture
and in intensive beef and dairy production systems.
TheNetherlands’imports,consumption6
,exports
From 2017 to 2021, the Netherlands imported on average
8.1 million tonnes of soy per year, as soybeans, meal and
oil and embedded within meat (especially poultry and pigs)
and livestock products (e.g., milk and eggs). Eighty-eight
to 90% of the combined volumes of soybeans, meal and
oil imported by the Netherlands is used to feed livestock7
.
An estimated 85% of the imported soy was re-exported,
typically after processing imported beans into soy meal, but
also through significant exports of biodiesel and poultry.
	 The land required to produce this imported quantity
of soy was on average 2.7 million hectares each year, an
area nearly two-thirds the size of the Netherlands. This
land footprint falls predominantly in Brazil (42%), the
USA (28%) and Argentina (6%) and is increasing. Forty-
eight percent of the land footprint comes from high and
very high-risk countries, especially Brazil and Argentina. It
should be noted that the expansion of soy production from
the Great Plains in the USA is one of the main drivers of
ecosystem conversion there, alongside maize and wheat.
	 The greenhouse gas (GHG) emissions from land-use
change resulting from the Netherlands’ soy imports are
an estimated 21.9 million tonnes CO2-equivalent per
year between 2017 and 2021 – equivalent to 12% of the
Netherlands domestic emissions from all sources in 2019.
This is by far the largest carbon footprint of any of the
commodities analysed here.
16 17
AVERAGEANNUALVOLUMEOFIMPORTS %
PROVENANCE
VOLUME
(TONNES)
RISKSCORE
>11VeryHighRisk
9-10HighRisk
7-8MediumRisk
5-6Medium-lowrisk
4LowRisk
OTHERS
UKRAINE
ARGENTINA
CANADA
USA
URUGUAY
9%
2%
250000
0
750000
1000000
1250000
1500000
1750000
2000000
2500000
500000
6%
3%
31% 2%
USA
746.542ha
UKRAINE
75.363ha
AN ESTIMATED 88% OF THE
NETHERLANDS’ USE OF SOY IS USED
TO FEED LIVESTOCK5
BRAZIL
47%
2.482.192
3.776.129
282.329 465.502
187.897 165.175
745.805
©
Ana
Paula
Rabelo
/
WWF-UK
URUGUAY
72.534ha
ARGENTINA
160.617ha
CANADA
99.325ha
OTHERS
414.817ha
BRAZIL
1.144.307ha
THEIMPACTOFDUTCHIMPORTSONNATURELOSSWORLDWIDE THEIMPACTOFDUTCHIMPORTSONNATURELOSSWORLDWIDE
18 19
Impactsandrisks
Soybeans and derived products are estimated to be
responsible for almost one third of the deforestation
embodied in crop and livestock products imported
into the EU8
. The expansion of soy production is also
associated with widespread conversion of grassland and
savannah ecosystems, including the threatened Cerrado
in Brazil, the great plains in the USA, and the Gran Chaco
and Pampas in Argentina9
. Soy can also act as an indirect
driver of deforestation and conversion, displacing cattle
ranching towards the forest frontier and driving up the
price of converted land.
	 The most prominent soy certification schemes are the
Roundtable on Responsible Soy (RTRS), ProTerra and the
International Sustainability and Carbon Certification (ISCC)
which together certify less than 3% of global soy production.
Although it can lead to positive environmental and social
outcomes at farm level, certification does not prevent new
deforestation and conversion in high-risk landscapes, and it
isnotenoughtomaketheglobalsoymarketconversion-free.
Keysourcinglandscape:
theBrazilianCerrado
The Cerrado is a complex ecosystem of savannahs,
grasslands and forests in Brazil. Its high biodiversity and
endemism give it global importance: it contains about 5%
of the world’s biodiversity and roughly a third of all species
found there are endemic, including the giant armadillo
(Priodontes maximus), the northern tiger cat (Leopardus
tigrinus), and the maned wolf (Chrysocyon brachyurus).
	 TheCerradoranksamongstthemostthreatenedbiomes
in South America10
, and more than half of the Cerrado’s
original area has already been cleared of its native
vegetation. Most of the conversion has occurred since the
1970s, driven principally by soy and cattle production. For
example, a large expansion of soy plantations took place
in Mato Grosso, with a ~60% increase in cropland area
between 2006 and 201711
, and the biome now produces
over half of Brazil’s entire soy crop12
.
AN AREA NEARLY TWO THIRDS
THE SIZE OF THE NETHERLANDS
IS REQUIRED TO SUPPLY DUTCH
IMPORTS OF SOY
THENETHERLANDSIMPORTSOFSOYBY
PRODUCTTYPE(AVERAGE,2017-21) 3%
BIODIESEL	
1%
PORK	
1%
DAIRY
10%
POULTRY,
POULTRYMEAT
ANDEGGS
52%
SOYBEANS
2%
OTHER
(CATTLEMEAT,SOY
SEED,ETC)
28%
SOYMEAL
2%
SOYOIL
© Jaime Rojo / WWF-US
THEIMPACTOFDUTCHIMPORTSONNATURELOSSWORLDWIDE
THEIMPACTOFDUTCHIMPORTSONNATURELOSSWORLDWIDE THEIMPACTOFDUTCHIMPORTSONNATURELOSSWORLDWIDE
20 21
CompaniestradingsoyfromtheCerrado
totheNetherlands
Just eight companies were responsible for at least 82%
of all the Netherlands’ imports from the Cerrado. They
include subsidiaries of some of the largest global grain
and oilseed traders, such as Cargill, Bunge, and Louis
Dreyfus, as well as large Brazilian producers and traders
(e.g., Amaggi). Just half of these imports (52%) were
covered by corporate zero deforestation commitments.
Despite this, imports of all the major traders were
associated with conversion of the Cerrado. Of equal
concern is that one third of the imported deforestation
and conversion (34%) was from soy that is ostensibly
covered by corporate zero deforestation pledges.
TheNetherland’simportsfromtheCerrado
1.75 million tonnes of soy were exported directly13
from
the Cerrado to the Netherlands in 2018, accounting
for 45% of the Netherlands’ direct soy imports from
Brazil14
. These imports are highly concentrated, with
85% coming from just two states, Mato Grosso and
Goias. Both states are also centres of deforestation and
conversion, together accounting for 23% of the area of
habitat loss attributed to soy in Brazil.
	 The Netherland’s direct imports of soy from the Cerrado
were associated with an estimated 41,000 hectares of
conversion in total between 2009-18, with resulting
cumulative greenhouse gas emissions estimated at 5.95
million tonnes CO2-equivalent.
AMAG GI
INTERGRAIN SA
UNKNOWN
AGROGRAIN LTD SUCURSAL URUGUAY
CARGILL AGRICOLA SA
BUNGE INTERNATIONAL COMMERCE CUCURSAL URUGUAY
LOUIS DREY FUS
CP GLOBAL TRADING LLP
CEFE TRA BV
KMP KOSTER MARINE PROTEINS
GAVILON
KOSTER MARINE PROTEINS GMBH
COFCO BRAZIL OVERSEAS LTD
AGROGRAIN LTD
MPH MARINE PROTEIN HOLDINGS GMBH E CO KG
KOSTER MARINE PROTEINS
GLENCORE AGRICULTURE
KOSTER MARINE PROTEIN HOLDINGS CMBHE CO KG
CJ EUROPE GMBH
KVSTER MARINE PROTEINS GMBH
150 200 250 300 350
100
50
DEFORESTATION (HECTARES)
COVERED BY A ZERO DEFORESTATION COMMITMENT NOT COVERED BY ZERO DEFORESTION COMMITMENT
THEIMPACTOFDUTCHIMPORTSONNATURELOSSWORLDWIDE
© Martin Harvey / WWF
22 23
PALMOIL
Palm oil is the most productive oil crop per hectare and
is extremely versatile: palm oil, palm kernel oil and their
derivatives are estimated to be present in more than 50%
of packaged supermarket products, whilst palm kernel
meal is mainly used as livestock feed.
	 Global palm oil production has increased from 15.2
million tonnes in 1995 to an estimated 62.9 million
tonnes in 2017. Large-scale palm oil plantations produce
approximately 60% of the world’s production with
much of the rest grown by an estimated three million
smallholders. Palm oil is predominantly produced by
Indonesia (60% of global production) and Malaysia
(24%). There has also been a marked increase in palm
oil production in other parts of the world in recent years,
largely in South and Central America, Thailand and
western Africa.
TheNetherlands’imports,consumption,exports
On average 5.59 million tonnes of palm oil was imported
into the Netherlands every year between 2017 and 2021,
as palm oil, palm kernel oil, palm kernel meal and
embedded within imported foods such as margarine
and bakery products. Imports increased by around half
a million tonnes during the period. Forty-one per cent
of imports were consumed within the Netherlands, the
remainder was exported.
	 The land required to supply the Netherlands’ palm oil
importsbetween2017and2021wasonaverage0.81million
hectares per year, almost equivalent to the combined land
area of North Brabant and Friesland. Indonesia (42%)
and Malaysia (21%) dominate the Netherland’s palm oil
footprint,butthereisanoticeablesupplyfromtheAmericas
– Colombia (6%), Honduras (6%) and Guatemala (4%)
in particular. All of these countries are high or very-high
risk locations due to high rates of tree cover loss, a high
proportion of natural forest loss, and poor rule of law and
record of workers’ rights violations. As a result, at least 86%
of the palm oil imported by the Netherlands was from high
or very-high risk countries.
	 The estimated GHG emissions from land use change of
palm oil imported to the Netherlands were 2.85 million
tonnes CO2-equivalent per year – equal to around 2% of
the Netherlands domestic GHG emissions.
AVERAGEANNUALVOLUMEOFIMPORTS %
PROVENANCE
VOLUME
(TONNES)
RISKSCORE
>11VeryHighRisk
9-10HighRisk
7-8MediumRisk
5-6Medium-lowrisk
4LowRisk
INDONESIA
MALAYSIA
HONDURAS
GUATEMALA
OTHER
PAPUA
NEW
GUINEA
COLOMBIA
9%
45%
21%
6%
4%
12% 6%
INDONESIA
365.290ha
PAPUA
NEW
GUINEA
72.231ha
250000
0
750000
1000000
1250000
1500000
1750000
2000000
2500000
500000
689.705
226.172 333.231
310.304
1.174.478
2.357.917
497.692
©
Suwit
Ngaokaew
/
Shutterstock
OTHERS
113.112ha
MALAYSIA
143.688ha
HONDURAS
40.137ha
GUATEMALA
24.325ha
COLOMBIA
47.563ha
THEIMPACTOFDUTCHIMPORTSONNATURELOSSWORLDWIDE THEIMPACTOFDUTCHIMPORTSONNATURELOSSWORLDWIDE
24 25
Impactsandrisks
The expansion of palm oil cultivation has long been
linked with deforestation. A study concluded that 45%
of oil palm plantations studied in southeast Asia were in
areas that had been forest in 198915
. A significant part of
this deforestation is embedded in global trade.
	 The economic and social impacts of palm oil are
complex and contradictory. Oil palm cultivation
has improved the incomes for many rural people,
including smallholder farmers. It has also supported
the development of rural economies and the growth of
national economies of producer countries. However, oil
palm production has often been associated with land use
rights issues (particularly in Indonesia, but also in other
producer countries), forced and child labour (especially
Indonesia and Malaysia), and issues relating to the
terms and conditions of labour (such as wages, health
and safety and gender discrimination)16
.
	 The main certification scheme for oil palm is the
Roundtable on Sustainable Palm Oil (RSPO). RSPO
certified palm oil now accounts for 19% of global
production. Less than 6% of the combined palm oil, palm
kernel oil, palm kernel meal, refined and embedded palm
oil that is imported into the Netherlands is claimed to be
RSPOcertified17
.However,severalcritiqueshavereduced
confidence that RSPO certificates guarantee palm oil is
produced without deforestation and exploitation. This
has prompted a drive to develop a more robust standard.
A major drawback in the RSPO system is the lack of
controls on the uncertified portion of mass balance
certified palm oil18
. This is likely to be the major source
of deforestation-associated palm oil in many European
markets, where certification levels are high, but are in
large part mass balance.
	 Indonesia and Malaysia have both developed national
palmoilcertificationsystems.Itisimportanttonotethatthe
controls on deforestation within these national standards
are generally regarded as less stringent than those in the
most rigorous voluntary, international schemes.
Keysourcinglandscape:
RiauProvince,Indonesia
Indonesia produces approximately 60% of the world’s
palm oil. One fifth of that comes from Riau Province on the
island of Sumatra19
. The natural ecosystems of the island
of Sumatra, and Riau province within it, are amongst the
most biodiverse places on earth. For example, the Tesso
Nilo forest in Riau has possibly the highest diversity of
vascular plants of any tropical forest in the world20
. Twenty
per cent of the 2475 plant and animal species recorded
in Sumatra are endangered21
. Some of the more iconic
species include Sumatran tiger, Sunda pangolin, sun bear,
Sumatran rhinos, and Asian elephant.
	 The rate of increase in Riau’s oil palm area and palm
oil production has been astonishing: in 2008 there were
1.38 million hectares of oil palm, producing 4.8 million
tonnes of crude palm oil. By 2020 this had increased to
2.74 million hectares (a quarter of the province’s land
area) and 9.5 million tonnes22
.
	
AT LEAST 86% OF THE PALM OIL
IMPORTED BY THE NETHERLANDS
WAS FROM COUNTRIES WITH A
HIGH RISK OF DEFORESTATION AND
HUMAN RIGHTS ISSUES
4%
PALMKERNEL
OIL
24%
PALMKERNEL
MEAL
45%
PALMOIL
2%
COSMETICANDPERSONAL
HYGIENEPRODUCTS
1%
FOODPRODUCTS(E.G.MARGARINE,
BAKERY,CHOCOLATE)
23%
BIODIESEL
THENETHERLANDSIMPORTSOFPALMOILBY
PRODUCTTYPE(AVERAGE,2017-21)
© Harm Vriend / WWF
THEIMPACTOFDUTCHIMPORTSONNATURELOSSWORLDWIDE
THEIMPACTOFDUTCHIMPORTSONNATURELOSSWORLDWIDE THEIMPACTOFDUTCHIMPORTSONNATURELOSSWORLDWIDE
IMPORTEDDEFORESTATION
26 27
	 The growth of the palm oil sector has made a
significant contribution to Riau’s gross regional
domestic product, created jobs, and provides many
smallholders with an income above the minimum
wage23
. However, poverty and unemployment rates have
changed little, and the incidence of public health hazards
such as fires (sometimes lit deliberately to clear land
for new plantations) and the associated air pollution
have increased24
. The expansion of oil palm plantations
onto land that had customary or indigenous rights has
generated conflict25
.
	 Riaulostmorethan1.7millionhectaresofforestbetween
2011 and 2020, more than one-fifth of its forest cover in
201026
. Of particular concern in Riau is the conversion
and degradation of peat swamp forest. Since 1990, 70% of
Riau'speatswampforestshavebeenclearedandmostofthe
remaining forests are degraded27
. Oxidation of the organic
matter in drained peat swamps results in extreme carbon
dioxide emissions, and drained peat is highly flammable:
once alight, peat fires can burn for months or even years.
	 A large proportion of the oil palm estates in Riau have
been developed without the correct permits and are in
effect illegal28
: including up to 2 million hectares of the
province’s palm oil area29
. The Indonesian government
has made significant efforts to verify the legality of
oil palm plantations, through the introduction and
subsequent revision of the Indonesian Sustainable
Palm Oil (ISPO) standard. While ISPO certification
can provide an indication of whether legality has been
met, it does not give any indication of whether this was
given to a management unit that had been or is currently
deforesting or that has adopted a zero-deforestation
commitment in its supply chain.
TheNetherland’simportsfromRiau
The only direct publicly available data tracing palm oil
from Riau to the Netherlands is for 201530
. However,
given the rapid expansion of oil palm cultivation in Riau,
as well as the turnover in companies’ supply bases, this is
considered too dated to be used for analysis.
	
	 In the absence of up-to-date data tracing oil palm
from Riau to the Netherlands, the supply bases of five
companies with significant operations in the Netherlands
were examined to assess their links to palm oil from
Riau31
. Of these companies, only two, Olenex and Bunge
Loders Croklaan (BLC), provide lists of mills that supply
their facilities in the Netherlands. Cargill (who have
major facilities in the Netherlands), and AAK (who
own a palm oil refinery in Rotterdam) only supply lists
of their global palm oil supply base. In the absence of
greater transparency, it is therefore assumed that oil
palm products originating in Riau could be part of their
imports to the Netherlands. A fifth company, Viterra B.V.,
is headquartered in the Netherlands. They do not provide
any public information on their palm oil supply base,
but source large quantities of palm kernel meal (763,852
tonnes in 201932
) which they trade as animal feed.
	 All of the companies assessed have strong links to
palm oil from Riau. The Universal Mill List (a database
that attempts to list all known palm oil mills with their
geographic coordinates and ownership) lists a total of
217 mills in Riau33
. All companies source from some of
Riau’s mills, and in the case of Cargill and AAK, from
most of them.
	 The Roundtable on Sustainable Palm Oil (RSPO) is a
voluntary standards system that is by far the most widely
used in the palm oil sector. None of the companies have
more than 20% of their Riau supply base certified.
	 The low levels of certification coupled with the sheer
complexity and lack of transparency of palm oil supply
chains makes it almost inevitable that some material
from environmentally and socially undesirable sources
will enter supply chains. For example, only Bunge Loders
Croklaan does not have at least one of the six mills that
have been found to receive illegal fresh fruit bunches from
within Tesso Nilo National Park within their supply base
(see Table, below). Given that only a fraction of the fresh
fruit bunch supply from within the National Park has
been traced to mills, this almost certainly underestimates
the supply chain linkages between Tesso Nilo and the
Netherlands. Tesso Nilo National Park was established
in Riau in 2004 and at the time included some of the
largest contiguous areas of lowland rainforest remaining
in Sumatra. An estimated 75% of the area of the national
park is now occupied by oil palm plantations34
, and at
least 50 mills operate in the area35
.
© Aaron Gekoski / WWF-US
RIAULOSTMORETHAN
1.7MILLIONHECTARESOF
FORESTBETWEEN2011
AND2020,MORETHAN
ONE-FIFTHOFITSFOREST
COVERIN2010
THEIMPACTOFDUTCHIMPORTSONNATURELOSSWORLDWIDE
MAIZE
Maize is the third largest plant-based human food source
(after wheat and rice), is a major animal feed and biofuel
feedstock, and is widely processed for edible oil, refined
sugars and for numerous chemical purposes. Within the
EU, the predominant use of maize is animal feed, with
over 57 million tonnes used as feed, which is 70% of all
maize used within the bloc37
. Rotterdam hosts Europe’s
largest bioethanol refinery, owned by Alco Energy, and
which is dedicated to producing bioethanol from maize.
	 The United States and China are the predominant
producers of maize, accounting for 33% and 23% of
global production respectively.
TheNetherlands’imports,consumption,exports
TheNetherlandsimportedanaverageof10.1milliontonnes
of maize each year between 2017-21, as maize, as products
derived from maize (e.g., vegetable oil, high fructose
corn syrup) or products in which maize is embedded
in production (e.g., ethyl alcohol). The country’s own
production averaged 0.13 million tonnes per year over the
same period – equivalent to 1.3% of imports. An average
of 3.7 million tonnes were exported each year (36% of the
combined domestic production plus imports). The overall
trend is a decline in imports and consumption and a rise
in exports.
	 The land required to supply the Netherlands’ maize
imports was on average 1.53 million hectares each year,
equivalent to over one third of the Netherlands’ total land
area. The Netherlands’ imports are predominantly from
two geographies: Europe and the Americas. One third
of the land area required to supply the Netherlands with
its demand for imports was in the Ukraine (33%), with a
further 11% in France and 9% in the United States. The only
major supplier to the Netherlands that ranks as very high
risk is Brazil (7% of total land area).
	 The estimated GHG emissions from land use change
for those imports was 6.9 million tonnes CO2-equivalent
per year, equal to approximately 4% of the Netherlands’
domestic emission in 2019.
28 29
AVERAGEANNUALVOLUMEOFIMPORTS
50000
0
150000
200000
250000
300000
350000
400000
450000
100000
%
PROVENANCE
VOLUME
(TONNES)
RISKSCORE
>11VeryHighRisk
9-10HighRisk
7-8MediumRisk
5-6Medium-lowrisk
4LowRisk
UKRAINE
33%
3.326.126
OTHER
20%
2.038.534
POLAND
5%
547.835
ROMANIA
5%
530.314
FRANCE
15%
1.502.356
BRAZIL
6%
601.551
USA
16%
1.588.223
©
Hryshchyshen
Serhii
/
Shutterstock
ROMANIA
96.098ha
FRANCE
170.784ha
USA
144.905ha
BRAZIL
109.335ha
POLAND
86.627ha
UKRAINE
512.729ha
OTHERS
411.617ha
THEIMPACTOFDUTCHIMPORTSONNATURELOSSWORLDWIDE THEIMPACTOFDUTCHIMPORTSONNATURELOSSWORLDWIDE
THEIMPACTOFDUTCHIMPORTSONNATURELOSSWORLDWIDE THEIMPACTOFDUTCHIMPORTSONNATURELOSSWORLDWIDE 31
Impactsandrisks
Maize has drawn less scrutiny for its environmental and
social impacts than many other crops. However, it is
one of the main drivers of the conversion of the Great
Plains ecosystem in the United States: approximately
70% of the conversion of grasslands between 2018-2019
was for three crops: maize (25%), soy (22%), and wheat
(21%)38
. In Brazil, maize is often cropped alternately with
soy, meaning that it has a significant role in conversion
of natural ecosystems and the resulting GHG emissions
from land use change in that country.
	 There is no sector-specific certification system for maize
thatoperatesatasignificantscale,norsignificantoverarching
efforts to reduce the deforestation and conversion impacts of
thecrop(althoughsomeof maize’sproducts,suchasethanol
MAIZEISAMAJORDRIVEROFECOSYSTEM
CONVERSIONANDTHERESULTINGGREENHOUSE
GASEMISSIONSINBRAZILANDTHEUSA
used in biofuels, are covered by The EU Renewable Energy
Directive (EU RED) and certification schemes designed
to verify compliance with EU RED, such as the ISCC
certification system).
THE LAND REQUIRED TO SUPPLY
THE NETHERLANDS’ IMPORTS OF
MAIZE IS OVER 1.5 MILLION
HECTARES EACH YEAR AN AREA
EQUIVALENT TO ONE THIRD OF THE
NETHERLANDS’ LAND AREA”
© Maksim Safaniuk / Shutterstock
56%
MAIZE
THENETHERLANDSIMPORTSOFMAIZEBY
PRODUCTTYPE(AVERAGE,2017-21)
7%
PROCESSED
MAIZE
11%
MAIZEOIL
1%
MAIZE
STARCH
3%
MAIZE
SUGARS
21%
ETHYL
ALCOHOL
COCOA
The majority of cocoa is produced by smallholders, with
more than 90% of global cocoa production originating
from farms covering only 2-5 hectares. Côte d’Ivoire
and Ghana are the major global exporters, whilst the
Netherlands is the world’s largest importer of cocoa
beans and the world’s second largest cocoa processor39
(behind Côte d’Ivoire).
	 The principal end use of cocoa beans is chocolate and
chocolate products which are manufactured from the
intermediate products of cocoa beans: cocoa paste (also
known as cocoa liquor), cocoa butter and cocoa powder,
with cocoa butter also used in cosmetic products:
TheNetherlands’imports,consumption,exports
On average between 2017 and 2021, the Netherlands
imported 1.29 million tonnes of cocoa each year, in the
form of cocoa beans, primary processed products of cocoa
(cocoa butter, paste and powder) or as ingredients in
imported food (especially chocolate). This is equivalent
to 23% of global production. An estimated 1.05 million
tonnes were exported each year, meaning that 81% of
importswereexportedand19%ofimportswereconsumed
within the Netherlands. Seventy per cent of the cocoa
imported to the Netherlands is in the form of cocoa beans,
whereas the Netherlands adds significant value to these
imports by processing and exporting cocoa paste, butter,
powder and chocolate.
	 The land required to produce the Netherlands’ cocoa
importswasonaverage2.5millionhectaresperyear,anarea
60% the size of the Netherlands. The Netherlands’ sourcing
is heavily focused on West Africa: 45% of the Netherlands’
land footprint was in Côte d’Ivoire, followed by Nigeria
(17%), Cameroon (14%) and Ghana (13%). Except for Ghana
(medium risk), the other major sourcing countries rate as
high- or very-high risk on account of very high deforestation
rates,poorrecordsonworkers’rightsandlowlevelsofruleof
law. Consequently, at least 80% of the Netherlands’ imports
come from high- or very-high risk countries.
	 The estimated GHG emissions attributed to the
Netherlands’ cocoa land footprint between 2017 and
2021 were 11.3 million tonnes CO2-equivalent per year
– equivalent to over 6% of the Netherlands’ domestic
emissions in 2019.
32 33
AVERAGEANNUALVOLUMEOFIMPORTS %
PROVENANCE
VOLUME
(TONNES)
RISKSCORE
>11VeryHighRisk
9-10HighRisk
7-8MediumRisk
5-6Medium-lowrisk
4LowRisk
ECUADOR
57.469ha
NIGERIA
425.567ha
50000
0
150000
200000
250000
300000
350000
400000
450000
100000
ECUADOR
3%
32.526
GHANA
15%
191.825
SIERRA
LEONE
2%
20.754
NIGERIA
10%
132.617
CÔTE
D’IVOIRE
47%
609.263
OTHERS
10%
134.516
©
Nutt
/
Shutterstock
OTHERS
183.624ha
CAMEROON
358.709ha
CÔTED’IVOIRE
1.123.351ha
GHANA
318.612ha
CAMEROON
13%
167.881
THEIMPACTOFDUTCHIMPORTSONNATURELOSSWORLDWIDE
© WWF / Jaap van der Waarde
Impactsandrisks
Despitethepotentialforcocoatobegrowninagroforestry
systems, cocoa production is driving deforestation in
major producing countries. Global forest loss driven by
cocoa expansion is estimated to be around 2-3 million
hectares from 1998-2008, accounting for roughly 1%
of all forest loss during this period40
. Deforestation
in the sector is in part driven by low investment in
smallholder farmers (financially, and in terms of skills
and management training), and in part because aging
trees have lower yields, which means that farmers tend
to expand production by cutting down trees for new
cocoa fields.
	 Cocoa cultivation provides a livelihood for millions
of smallholders in countries such as Côte d’Ivoire,
Indonesia, Ghana, Cameroon and Nigeria. However,
cocoa farmers are often living in poverty and receive
a small percentage of overall cocoa price – between 3
and 5% of the value of a chocolate bar. Child and forced
labour are endemic in the sector, particularly in some
West African countries. It is estimated that a total of 1.56
million children – the majority of who are exposed to
hazardous working conditions41
– worked illegally in the
cocoa sector in Ghana and Côte d’Ivoire during the 2018-
19 season42
. The incidence of child labour is increasing.
	 There are numerous certification schemes aimed at
mandating minimum sustainability standards for cocoa
producers. These include voluntary standards schemes
such as Rainforest Alliance, Fairtrade and organic.
34 35
The global area of cocoa certified by one of more of the
voluntary standards schemes reaches 25% of the global
cocoa area43
. The above schemes provide varying levels of
protection against deforestation. By contrast, Fairtrade
is the only certification scheme that has a minimum
price for cocoa as well as a fixed premium of US $400 per
tonne of cocoa. This helps provide farmers with greater
financial security during periods of price volatility and
decline on the world market for cocoa. In addition, many
of the major manufacturers and traders run their own
proprietary sustainability schemes.
	 The World Cocoa Foundation44
is a grouping of
cocoa industry actors that was established to improve
environmental and social sustainability within the
sector. It created the Cocoa and Forests Initiative (CFI) in
2017, with the aim of ending deforestation and restoring
forests in Côte d’Ivoire and Ghana. The group includes
the governments of those two countries, along with 35
leading cocoa and chocolate companies45
.
	 The Dutch cocoa sector increased its use of sustainable
cocoa from 21% to 30% between 2014 and 201646
. The
Dutch Initiative on Sustainable Cocoa – a collaboration
of business and civil society – aims to end deforestation
associated with Dutch cocoa sourcing by 202547
.
	 The above suggests increasing efforts by cocoa traders
and chocolate companies, but these have so far failed
to drive meaningful change in the industry, as cocoa
production continues to be linked to deforestation, child
and forced labour, and farmer poverty.
70%
COCOABEANS	
THENETHERLANDSIMPORTSOFCOCOABYPRODUCTTYPE(2017-21)
7%
COCOABUTTER	
11%
COCOAPASTE
5%
COCOAPOWDER
6%
CHOCOLATEANDPRODUCTS
CONTAININGCHOCOLATE
1%
OTHER
Keysourcingcountry:
Cameroon
Cameroon is the fourth largest cocoa producer in West
Africa and fifth globally. The area of cocoa harvested in
Cameroonhasalmostdoubledsincetheearly1960s,from
around 380,000 hectares in the early 1960s to nearly
700,000 in 2020, with production of cocoa increasing
nearly four-fold over the same period. The country has
ambitions to more than double cocoa production in the
next decade48
.
	 Smallholders account for 89% of production, but many
receive an income from cocoa that is less than the national
minimum wage49
. Although the government of Cameroon
has made advances in eliminating the worst forms of child
labour, it is still prevalent within the cocoa sector50
.
	
THEIMPACTOFDUTCHIMPORTSONNATURELOSSWORLDWIDE
THEIMPACTOFDUTCHIMPORTSONNATURELOSSWORLDWIDE THEIMPACTOFDUTCHIMPORTSONNATURELOSSWORLDWIDE
TheNetherland’simportsfromCameroon
The EU is by far the biggest consumer of cocoa,
responsible for 60% of global imports, with the
Netherlands alone importing 23% of the world’s cocoa
production. Amongst these imports are an average of
168,000 tonnes per year from Cameroon, equivalent to
more than half of Cameroon’s national production53
. The
Netherlands therefore has a disproportionate influence
on, and responsibility for, the environmental and social
issues associated with cocoa production in the country.
Some of the largest cocoa traders globally, including
ADM Cocoa, Cargill and Olam have cocoa operations in
the Netherlands, along with Dutch companies that are
part of the Swiss headquartered ECOM group, including
Dutch Cocoa, Daarnhouwer and Theobroma54
. Cargill
and Olam are globally the second and third largest
traders and grinders of cocoa beans55
.
	 The forest zones of the Centre and South West Regions
are the main cocoa producing areas, with some production
also occurring in the mangrove and savannah ecosystems.
Cocoa is one of the major drivers of deforestation and
biodiversity loss in Cameroon, which is one of the most
biodiverse countries in Africa. The country includes
part of the critical cross-border Tri-National Dja-
Odzala-Minkébé (TRIDOM) forest, which it shares with
the Republic of Congo and Gabon, and which covers
178,000 square kilometres. The area provides a habitat
for elephants, chimpanzees and western lowland gorillas
but is threatened by illegal logging, large-scale mining,
poaching, and forest conversion for commodity crops51
.
	 A roadmap towards deforestation-free cocoa was
signed by the Government of Cameroon, international
development partners, businesses and civil society in
January 2021. Although too early to tell whether it will be
effective, the agreement aims to decouple cocoa production
from deforestation by driving more sustainable production
and forest protection while ensuring social inclusion52
.
	 The cocoa sector has little supply chain transparency,
with pledges to improve transparency as yet largely
unfulfilled56
. Imports of cocoa from Cameroon to the
Netherlands are no different, and so it is not possible to
directly match imports as a whole or those of individual
companies to specific incidents of deforestation. Given
the disproportionate role that the Netherlands plays in
exporting Cameroon’s cocoa, and the absence of supply
chain transparency, it appears likely that some of the
Netherlands’ imports are associated with deforestation,
child labour, and other environmental and social harms.
THEIMPACTOFDUTCHIMPORTSONNATURELOSSWORLDWIDE
36 37
ATLEAST80%OFTHE
NETHERLANDSIMPORTS
OFCOCOACOMEFROM
COUNTRIESWITHAHIGH
ORVERY-HIGHRISKOF
DEFORESTATIONAND
HUMANRIGHTSISSUES
© Christiaan van der Hoeven / WWF-Netherlands
COFFEE
Brazil and Vietnam are the world’s largest coffee
producers,witha32%and16%shareofglobalproduction
respectively, whilst the United States, Germany, Italy,
Japan, and Spain rank as the main importing countries58
.
	 The primary end use for coffee beans is for the coffee
beverage, though there is a small but growing use of
coffee extract in food products and coffee bean extract
for food supplements. Green coffee beans purchased for
coffee production are first tasted for quality before they
are roasted to either a light, medium, or dark roast level.
The roasted coffee beans are either sold as whole beans
to consumers of ground to varying levels of coarseness.
TheNetherlands’imports,consumption,exports
On average between 2017 and 2021, the Netherlands
imported0.29milliontonnesofcoffee,intheformofcoffee
beans, roasted and/or decaffeinated coffee, or extracts and
food preparations with coffee as a major ingredient. This
is equivalent to 2.9% of global production. An estimated
0.15 million tonnes were exported each year, meaning
that an estimated 47% of imports were consumed.
	 Most of the coffee imported into the Netherlands is
in the form of coffee beans or roasted coffee. The largest
exports are of roasted coffee: the Netherlands is the third
largest exporter of roasted coffee in the world, principally
supplying European countries. Unlike most of the other
commodities assessed in this report, a large volume of
coffee imports arrives in the Netherlands via third-party
countries:40%viaBelgiumandafurther23%viaGermany.
	 The land required to produce the Netherlands’ coffee
imports was on average 203,000 hectares per year –
equivalent to about 2% of the world’s land footprint for
coffee and almost the same area as the Dutch province
of Limburg.
	 Apart from Vietnam (20% of the import land footprint),
the Netherlands’ sourcing is heavily focused on South and
Central America: Brazil (35%), Honduras (9%), Colombia
(7%) and Guatemala (2%). All of these countries rank as
high- or very high risk as a result of rapid deforestation,
poorlabourrightsandlowruleoflawscores.Consequently,
at least 69% of the Netherlands’ imports come from high-
or very-high risk countries (the remainder is the portion
that has not been assigned a provenance).
38 39
AVERAGEANNUALVOLUMEOFIMPORTS
10000
0
30000
40000
50000
60000
70000
80000
90000
20000
%
PROVENANCE
VOLUME
(TONNES)
RISKSCORE
>11VeryHighRisk
9-10HighRisk
7-8MediumRisk
5-6Medium-lowrisk
4LowRisk
PERU
4.757ha
BRAZIL
35%
102.399
COLOMBIA
7%
21.587
PERU
1%
4.003
GUATEMALA
2%
4.999
HONDURAS
9%
26.594
VIETNAM
20%
58.247
OTHER
25%
73.038
©
PixieMe
/
Shutterstock
OTHERS
63.721ha
COLOMBIA
22.217ha
HONDURAS
23.865ha
GUATEMALA
7.018ha BRAZIL
59.000ha
VIETNAM
21.945ha
THEIMPACTOFDUTCHIMPORTSONNATURELOSSWORLDWIDE THEIMPACTOFDUTCHIMPORTSONNATURELOSSWORLDWIDE
	 The estimated GHG emissions attributed to the
Netherlands’ coffee land footprint between 2017 and 2021
were around 0.198 million tonnes CO2-equivalent per year.
Impactsandrisks
Coffee is traditionally grown under shade trees, which
provides a multitude of ecosystem services, including pest
control, carbon sequestration, watershed protection, and
a habitat for wildlife. However, in the 1970s, a movement
began in Central America towards open-sun coffee
production systems to increase yields. Accompanying this
move away from shade management was an uptake in the
use of agrochemical inputs to combat pests and diseases.
Recent analysis of land use data indicates that many
countries where coffee production is rapidly expanding
(e.g. Vietnam, Indonesia, Ethiopia, and Peru) create new
land for coffee through deforestation, using lightly shaded
or full-sun production systems59
.
	 There are significant economic and social issues
surrounding coffee production. World coffee prices have
fallen by two-thirds since the early 1980s, and the earnings
of coffee farmers have halved during that time, and it is
becoming questionable whether coffee is still a profitable
crop. Most of the value produced by coffee goes to major
retailers and brands rather than the farmers, who receive
only 7–10% of the retail price of coffee60
.
	 Given the pressure to cut economic costs, there are
increasing reports of exploitation in coffee production. This
includes accounts of debt bondage, child labour, exposure
to deadly pesticides, a lack of protective equipment,
especially in Brazil61
. In 2016, two of the largest coffee
companies, Nestlé and the Dutch company JDE Peet’s,
admitted that the coffee they sourced from Brazil may
come from plantations where forced labour is practiced62
.
While the two companies claim not to purchase directly
from plantations with a history of labour violations, they
do purchase from exporters and middlemen who might be
sourcing the beans from these plantations.
	 Climate change poses a substantial risk to coffee
production. Changes in temperature and rainfall will both
increase pressure from pests and diseases and decrease
the area suitable for coffee cultivation, particularly in the
largest coffee producing countries, Brazil and Vietnam63
.
	 Certification of coffee is well-established and growing,
providing assurance against some forms of deforestation,
with variations between schemes. The most common
standards are the 4C code, Fairtrade, Rainforest Alliance,
and organic which together covered an estimated 22%
of the global coffee area in 2017. Private corporations,
including Nespresso and Starbucks, also have their own
standards and global initiatives.
IMPORTEDDEFORESTATION
40 41
© WWF-Indonesia / Natalie J. Tangkepayung
THENETHERLANDS IMPORTSOFCOFFEEBY
PRODUCTTYPE(AVERAGE,2015-19)
29%
ROASTED
COFFEE
3%
OTHER
63%
UNROASTED
COFFEE
THEIMPACTSOFCLIMATE
CHANGEANDTHELOW
PRICESPAIDTOFARMERS
FORCOFFEE,ARELIKELY
TOMAKECOFFEEGROWING
UNPROFITABLEFORMANY
SMALLHOLDERS
5%
UNROASTED
DECAFFINATED
COFFEE
1%
ROASTED
DECAFFINATED
COFFEE
COCONUT
Coconut is used for a large variety of end products: fresh
coconut and coconut water are major uses in producer
countries, with desiccated coconut and coconut milk
the other uses for human consumption; coconut oil and
its derivatives are predominantly used in personal care
products; and coir (the fibres from the coconut husk) is
used to make carpets, twine and matting.
	 Indonesia(28%),thePhilippines(24%)andIndia(23%)
share three quarters of global production, with China
(29% of global trade), Thailand (16%) and Malaysia (13%)
the largest importers. Within the EU, the Netherlands is
the predominant importer, importing almost twice the
quantity of the next largest importer, Germany64
.
TheNetherlands’imports,consumption,exports
On average between 2017 and 2021, the Netherlands
imported 2.1 million tonnes of coconut equivalent,
predominantly in the form of crude coconut oil. This
is approximately 3.5% of global coconut production.
An estimated 1.3 million tonnes were exported each
year, meaning that an estimated 37% of imports were
consumed within the Netherlands. Most of the coconut
imported into the Netherlands is in the form of crude
coconut oil, which is refined and used in the food and
cosmetics sectors. By contrast, exports are dominated
by refined coconut oil (which is largely used in food,
cosmetics, personal hygiene products).
	 The land required to produce the Netherlands’
coconut imports was on average 0.5 million hectares
per year – equivalent to about 4.3% of the world’s land
footprint for coconut and an area the size of the Dutch
province of Gelderland. The Netherlands’ sourcing is
overwhelmingly from the Philippines (87% of the land
area), Indonesia (9%) and Côte d’Ivoire (2%). The
Philippines is ranked as medium risk country: rates of
tree cover loss and natural forest loss are relatively low,
although it ranks poorly on rule of law and labour rights.
The other main sourcing countries rate as high or very-
high risk. As a consequence, 11% of the Netherland’s
coconut sourcing is from high or very-high risk countries.
	 The estimated GHG emissions attributed to the
Netherlands’ cocoa land footprint between 2017 and 2021
were around 0.43 million tonnes CO2-equivalent per year.
42 43
AVERAGEANNUALVOLUMEOFIMPORTS
25000
0
75000
100000
125000
150000
200000
225000
250000
50000
%
PROVENANCE
AVERAGEANNUALVOLUMEOFIMPORTS
VOLUME
(TONNES)
RISKSCORE
>11VeryHighRisk
9-10HighRisk
7-8MediumRisk
5-6Medium-lowrisk
4LowRisk
CÔTE
D'IVOIRE
1%
27.497
SRI
LANKA
1%
11.214
MALAYSIA
0%
4.490
PHILIPPINES
82%
1.748.815
INDONESIA
13%
281.416
OTHERS
3%
55.960
©
ChenPG
/
AdobeStock
OTHERS
7.920ha
PHILIPPINES
438.079ha
INDONESIA
43.319ha
SRILANKA
2.220ha
MALAYSIA
596ha
CÔTED’IVOIRE
10.359ha
THEIMPACTOFDUTCHIMPORTSONNATURELOSSWORLDWIDE THEIMPACTOFDUTCHIMPORTSONNATURELOSSWORLDWIDE
Impactsandrisks
A recent paper suggests that coconut oil has the largest
impact on biodiversity of any vegetable oil65
. The analysis
has been criticised, as the methodology is biased towards
small island nations that have high levels of endemic and
threatened species, but which produce little coconut oil for
the international market66
, but the central point – that the
expansion of coconut production is not without ecological
consequence – remains valid.
	 Incomes from coconut farming are very low. For
example, the majority of the 3.5 million coconut farmers
IMPORTEDDEFORESTATION
44 45
THENETHERLANDS
IMPORTS
OFCOCONUTBY
PRODUCTTYPE
(AVERAGE,2017-21)
87%
CRUDECOCONUTOIL
ATLEAST11%OFTHE
NETHERLANDSIMPORTS
OFCOCONUTCOMEFROM
COUNTRIESWITHAHIGH
ORVERY-HIGHRISKOF
DEFORESTATIONAND
HUMANRIGHTSISSUES
© xuanhuongho / AdobeStock
in the Philippines live below the poverty line, earning less
than $1 per day67
. Low incomes also encourage the use of
unpaid or child labour and coconut production is listed
on the US Department of Labour’s list of goods produced
by child labour or forced labour in the Philippines68
.
	 There is so far very limited certification of coconuts,
meaning that the overwhelming majority of the
Netherlands’importsarenotcoveredbyanyindependently
verified assurance of being deforestation free.
THELANDAREAREQUIREDTOSUPPLYTHE
NETHERLANDSIMPORTSOFCOCONUTEACH
YEARISEQUIVALENTTOANAREATHESIZEOF
THEDUTCHPROVINCEOFGELDERLAND
2%
OTHER(EGEDIBLE
COCONUTS,COIR)
3%
REFINED
COCONUTOIL
1%
COSMETICAND
PERSONALHYGIENE
PRODUCTS
7%
DESSICATED
COCONUT
The world’s land footprint for beef & leather (i.e. the
grazing area dedicated for cattle globally, excluding
dairy cattle) encompasses an estimated 1.6 billion
hectares69
– an more than one and a half times the area
of the European continent.
	 The majority of beef is purchased and consumed as
fresh or frozen cuts, e.g. steaks, mince and roasting
joints. However – like most meats – it is also found in
a range of food products, e.g. burgers and ready meals.
Nearly half of all bovine leather is used to manufacture
shoes, with a further 17% used in automobile seats.
Furniture upholstery, clothes, and various leather goods
make up the rest.
TheNetherlands’imports,consumption,exports
The Netherlands imported an average of 382,000
tonnes of beef (Carcass Weight Equivalent) each year
between 2017-21. The majority is imported in the form
of fresh or chilled beef (55%) and live animals (32%).
Over the same period, the Netherlands imported
110,000 tonnes of bovine leather, predominantly as raw
hides (64%) and manufactured leather cases and bags
(20%). This compares with an average annual domestic
production of 290,000 tonnes beef and 38,000 tonnes
leather over the same period. Exports were on average
399,000 tonnes of beef per year and 123,000 tonnes of
leather. Consumption averaged 274,000 tonnes of beef
per year and 26,000 tonnes of leather.
	 The Netherlands’ external footprint for beef &
leather is equal 3.9 million hectares each year, an
area equivalent to nearly 90% of the Netherlands. The
majority of this, 78% of the land area, was for beef. The
EU dominates the Netherlands imports of beef, with
75% of the quantity coming from Belgium, Poland,
Germany, France, Ireland and Italy alone. A small
proportion comes from South American countries
including Brazil (4%), Uruguay (2%) and Argentina
(3%), but as these countries have comparatively
extensive beef systems, they dominate the land
46 47
BEEFAND
LEATHER
AVERAGEANNUALVOLUMEOFIMPORTS
©
Serhii
Opikanets
/
Shutterstock
100000
0
300000
400000
500000
600000
700000
800000
900000
200000
%
PROVENANCE
VOLUME
(TONNES)
RISKSCORE
>11VeryHighRisk
9-10HighRisk
7-8MediumRisk
5-6Medium-lowrisk
4LowRisk
BELGIUM
17%
POLAND
13%
GERMANY
12%
FRANCE
11%
IRELAND
9%
ITALY
7%
AUSTRIA
6%
BRAZIL
4%
ARGENTINA
3%
SPAIN
3%
UNITED
KINGDOM
3%
URUGUAY
2%
OTHER
11%
GERMANY
31%
BELGIUM
23%
CHINA
11%
ITALY
7%
POLAND
4%
VIETNAM
4%
UNITED
KINGDOM
3%
INDIA
3%
CZECHIA
2%
FRANCE
2%
OTHER
11%
42.973
8.000
33.993
25.087
11.714
7.290
4.480
3.942
3.815 2.958
2.492
2.086
12.031
13.129
10.892
9.978
13.773
21.487
25.993
34.563
40.768
44.618
50.372
66.090
BEEF LEATHER
OTHERS
371.238ha
INDIA
2.286ha
VIETNAM
3.633ha
CHINA
164.998ha
ARGENTINA
1.395.198ha
URUGUAY
183.503ha
BRAZIL
489.838ha
GERMANY
289.749ha
POLAND
72.991ha
THEIMPACTOFDUTCHIMPORTSONNATURELOSSWORLDWIDE THEIMPACTOFDUTCHIMPORTSONNATURELOSSWORLDWIDE
IRELAND
185.944ha
FRANCE
86.091ha
SPAIN
113.569ha
ITALY
263.453ha
CZECHIA
7.195ha
BELGIUM
42.462ha
UNITEDKINDOM
112.443ha
THEIMPACTOFDUTCHIMPORTSONNATURELOSSWORLDWIDE THEIMPACTOFDUTCHIMPORTSONNATURELOSSWORLDWIDE
IMPORTEDDEFORESTATION
48 49
49
© Jason Houston / WWF-US
42%OFTHELANDAREAOFTHE
NETHERLANDS’IMPORTSOF
BEEF–BUTONLYAROUND8%
OFTHEQUANTITYOFIMPORTS
–COMESFROMHIGHANDVERY-
HIGHRISKCOUNTRIES
THEAREAOFLANDREQUIREDTO
SUPPLYTHENETHERLANDS’IMPORTSOF
BEEFANDLEATHERISEQUIVALENTTO
90%OFTHENETHERLANDS’LANDAREA
THENETHERLANDSIMPORTSOFBEEFANDLEATHER
PRODUCTTYPE(AVERAGE,2017-21)
55%
FRESHOR
CHILLEDMEAT
32%
LIVECATTLE
9%
FROZENMEAT
4%
PRESERVEDMEAT
ANDPREPARATIONS
CONTAININGMEAT
are rated high- and very-high risk respectively, resulting
in 42% of the external land footprint of the Netherlands’
imports being from high- or very high risk countries.
Note that intensive livestock systems have other risks
associated with them, including the import of feed (see
soy and maize, above) and local nitrogen pollution.
	 Whilst imports of leather are also dominated by the
EU, China and Vietnam are also significant sourcing
countries. China dominates the land area required, due to
its low productivity per hectare, and is largely responsible
for 44% of the external land footprint of the Netherlands’
imports being from high- or very high risk countries.
	 It was not possible to quantify the GHG emissions of
the beef and leather imported by the Netherlands (see
Methods,below).However,beefcattleareoneofthemajor
drivers of deforestation worldwide – in fact some research
indicates it as the single largest cause of deforestation and
conversion70
– and hence the greenhouse gas emissions
from land use change associated with the Netherlands’
imports are likely to be significant.
Impactsandrisks
Cattle production is the dominant agricultural driver
of deforestation globally, accounting for more than 45
million hectares of deforestation between 2001-201571
.
It is the predominant land use following deforestation in
several WWF Priority Places such as the Amazon, Cerrado
and Pantanal. Pasture can also be an intermediate step
between conversion and the final land use (e.g. soy).
According to the International Labour Organisation,
some 62% of slave labour in Brazil is employed in livestock
farming-related businesses72
.
	 There are limited options available for companies and
consumers wishing to purchase sustainable beef and
leather. The Sustainable Agriculture Network (SAN)
Standard for Sustainable Cattle Production Systems
(Rainforest Alliance) has had very limited uptake,
and the Global Roundtable for Sustainable Beef have
developed a standard but the process of verification and
levels of uptake are unclear73
.
1%
LEATHER(PREPARED
TOVARYINGDEGREES)
5%
FOOTWEAR
7%
LEATHERSEATS
21%
LEATHERBAGS,
CASESAND
CLOTHING
1%
OTHER(E.G.,SADDLERY)
65%
HIDES
TIMBER
There are two major production systems for timber:
plantations and natural forest. India, the USA, Brazil
and the Russian Federation are the largest producers of
wood globally, with the USA and the Russian Federation
exporting the greatest quantity in terms of weight (and
noting the majority of production in India is used
domestically as fuel). The USA and China dominate
global imports74
.
	 Wood is extremely versatile, and has a wide variety
of end uses, including fuel, construction, furniture,
various manufactured items (e.g., musical instruments
and kitchenware), industrial processes (e.g. electricity
generation), and paper and card. Note that the analysis
presented below does not include pulp and paper, as this
has separate supply chains.
TheNetherlands’imports,consumption,exports
The Netherlands’ external timber footprint, though
only 0.3% of the world’s timber footprint, is the largest
in absolute area of all the commodities studied in this
report, averaging 5.1 million hectares each year. This is
1.2 times larger than the land area of the Netherlands,
and it is increasing.
	 On average, 22.2 million m3
of wood raw material
equivalent (WRME) were imported to the Netherlands
every year between 2017 and 2021. The Netherlands
produced an average of 7.1 million m3
each year over
the same period. 15.5 million m3
was exported each
year, meaning that on average 62.5% of all imports
and domestic production were consumed within the
Netherlands. The largest proportion of timber imported
to the Netherlands consisted of sawn wood (22%),
fibreboard (17%) and fuel wood (11%). Fuelwood has
shown a dramatic increase over the period, from 0.87
million m3
in 2017 to over 4.5 million m3
in 2021 and is
largely responsible for the increased imports in timber
over the period.
	 Most of the Netherlands’ imports are from the EU,
with only China, the Russian Federation (both high risk
countries) and the USA being the only non-EU countries
to supply at least 2% of the Netherland’ imports. EU
countries have generally low deforestation rates, good
rule of law and labour rights. Nonetheless, at least 30%
50 51
AVERAGEANNUALVOLUMEOFIMPORTS
500000
0
1500000
2000000
2500000
3000000
3500000
4000000
4500000
1000000
%
PROVENANCE
VOLUME
(M
3
)
RISKSCORE
>11VeryHighRisk
9-10HighRisk
7-8MediumRisk
5-6Medium-lowrisk
4LowRisk
ITALY
FRANCE
BELGIUM
USA
GERMANY
2%
9%
4%
3% 11%
SWEDEN
4% 3% 4%
CHINA
6%
POLAND
19%
OTHER
23%
RUSSIA
11%
FINLAND
LATVIA
771.279 934.751
1.994.303
2.430.459
993.087
494.825 654.828978.110
2.400.474
1.338.867
4.161.090
5.087.950
©
Dorelys
Smits/UnSplash
OTHERS
1.217.384ha
CHINA
371.908ha
USA
265.958ha SWEDEN
300.935ha
LATVIA
148.198ha
FINLAND
148.824ha
GERMANY
217.005ha
FRANCE
362.601ha
POLAND
520.136ha
ITALY
154.633ha
BELGIUM
121.396ha
RUSSIA
1.846.518ha
THEIMPACTOFDUTCHIMPORTSONNATURELOSSWORLDWIDE
THEIMPACTOFDUTCHIMPORTSONNATURELOSSWORLDWIDE THEIMPACTOFDUTCHIMPORTSONNATURELOSSWORLDWIDE
IMPORTEDDEFORESTATION
52 53
of the Netherlands’ land footprint for timber imports is
from high and very-high risk countries. In practice, the
proportion is likely to be significantly higher than this:
the Netherlands imports timber and timber products
from 152 countries, and a total of 23% of the land
footprint is from countries that supplied less than 2% of
the total and hence were not assessed in this study.
Impactsandrisks
The trade in timber and timber products has long been
linked with deforestation and forest degradation75
. The
most obvious direct impact of the timber industry is
when natural and semi-natural forest is replaced by tree
plantation monocultures. Moreover, timber harvesting can
play an indirect role in deforestation, with logging access
roads opening up areas of forest to ranchers and farmers.
	 Within the forestry sector, there are two main forest
certification schemes covering timber: the Forest
Stewardship Council (FSC) and the Programme for the
Endorsement of Forest Certification (PEFC). By mid-
2013, these initiatives had together certified 23% of the
world’s managed forests76
. Canada, the United States,
Russia, Finland and Sweden were the top five countries
in terms of certified forest area.
© Mac Stone / WWF-US
53
THENETHERLANDS IMPORTSOFTIMBERBY
PRODUCTTYPE(AVERAGE,2017-21)
	 The FSC and PEFC standards have broadly similar
requirements, although the FSC is regarded as having
more rigorous requirements on some key outcome
requirements (e.g. maintenance of High Conservation
Values, workers’ rights) and process aspects (e.g.
multi- stakeholder engagement and formulation of
audit teams)77
. The FSC also has a greater certified area
in the tropics than PEFC and is supported by leading
environmental NGOs. The FSC Principles and Criteria
exclude certification of plantations established on areas
converted from natural forest after November 1994,
unless the plantation is a small part of the certified area,
or if the management organisation was not responsible
for the conversion. The PEFC standard is broadly similar,
but with a cut-off date of 2010.
	 A recent survey of Netherlands Timber Trade
Association (VVNH) members estimated that nearly 99%
of softwood and 67% of hardwood (including tropical
species) imported into the Netherlands in 2020 was FSC
or PEFC certified78
. The survey covered 2 million m3
of
timber, which is less than 10% of total imports, and it is
not clear whether the survey results are applicable to the
entirety of the Netherlands’ imports.
THEAREAOFLAND
REQUIREDTOSUPPLYTHE
NETHERLANDS’IMPORTS
OFTIMBERISLARGERTHAN
THELANDAREAOFTHE
NETHERLANDS
6%
PACKINGCASESANDBOXES
9%
OTHER
7%
FURNITURE
2%
VENEER
25%
FIBREBOARD
ANDPARTICLEBOARD	
5%
PLYWOOD
8%
WOODINTHEROUGH
11%
FUELWOOD
25%
SAWNWOOD
2%
CHARCOAL
THEIMPACTOFDUTCHIMPORTSONNATURELOSSWORLDWIDE THEIMPACTOFDUTCHIMPORTSONNATURELOSSWORLDWIDE
Commodityfootprinting
Import data from UN Comtrade79
was used to estimate
the net weight of imports for the period from 2017 to
2021. We examined imports of raw materials (e.g. palm
oil, soymeal, cocoa beans), commodities as components
or ingredients of imported manufactured goods (e.g.
palm oil in margarine), and commodities embedded
within imported products as part of the upstream
production process (e.g. soymeal used in chicken feed
embedded in imported chicken). Where a commodity
is imported as an ingredient or is embedded, the weight
of imported goods was adjusted to an estimated weight
of the commodity using a mid-range conversion factor
derived from published literature. As many commodities
are used in thousands of different products, analysis was
confined to those product categories that are cited in the
literature as being major uses of the commodity. The
estimates provided are therefore conservative.
Provenanceanalysis
ItisnotstraightforwardtoworkoutwheretheNetherland’s
imported commodities were originally grown. The first
step was to take the direct country of origin for imports
to the Netherlands as reported in UN Comtrade data. The
Netherlands’ imports from these exporter countries were
then assumed to come from the countries that supplied
that country in the same proportion plus domestic
production (if any). For example, imports of cocoa into
the Netherlands from Germany (which does not grow
any cocoa domestically) were re-assigned to the countries
supplying cocoa to Germany, in the same proportions.
The sourcing provenance of all countries responsible for
at least 2% of the Netherlands’ imports of each commodity
were assessed.
Landfootprints
For the majority of commodities, estimating the
land area required to produce the quantities of
commodities imported by the Netherlands was relatively
straightforward, as yield data is readily available for each
country in each year of production from FAO STAT.
OVERVIEWOFMETHODS
54 55
	 For crops that produce co-products yield was allocated
to the co-products. This applied to soy (soymeal and soy
oil), cocoa (butter, paste and powder), palm oil (palm
oil, palm kernel oil and palm kernel meal). We allocated
land use to co-product fractions. In this case, imported
goods are first assigned to the fraction of the commodity
they contain, and then yield is assigned to that fraction
in the same proportion that the fraction is derived from
the harvested crop.
	 No yield data is available for beef & leather and
timber. For beef and leather, we adapted a method used
by de Ruiter et al. (2017)80
that allocates total country
pastureland to different grazing animals based on the
relative feed conversion efficiencies and overall sector
production. The area assigned to beef cattle is then
divided by the national production of beef and leather to
give a hectare per tonne estimate. Given that beef cattle
have two products (i.e. meat and leather), we allocated
a share of the land footprint to beef and leather co-
products on the basis of their mass.
	 The Netherlands’s imports of timber were converted
from tonnes of imports to wood raw material equivalent
(WRME). The area of forest required to produce the total
imported volume was estimated by dividing the total
WRME by the producer country’s Net Annual Increment81
EstimationofGHGfromlandusechange
The Land Use Change Impact Tool82
was used to estimate
commodity specific per-hectare CO2e emissions for
soy, cocoa, coffee, coconut, palm oil and maize. The tool
allows emissions from land use change to be assessed
when the country of production is known, but the exact
parcel of land used to produce the crop is unknown.
This matches the level of detail of our provenance
calculations, which is determined by the available data.
The associated emissions per hectare are then calculated
based on methods consistent with the Intergovernmental
Panel on Climate Change (IPCC) and the PAS 2050-1
framework, in including ‘amortisation’ so that the total
emissions from the 20-year period of the land-use change
are apportioned equally over the 20 years (see tool’s
methodology for further details). The commodity-specific
Full details of the method are available in the accompanying technical report ‘Risky Business Netherlands:
deforestation, conversion and social risks in the Netherlands’ commodity supply chains ‘
per-hectare CO2e emissions was then multiplied by the
Netherlands’ land footprint per commodity to estimate
the GHG emissions associated with LUC per country, for
each crop in each year.
	 The Land Use Change Impact Tool is one of the most
comprehensive tools for estimating GHG emissions from
direct LUC with global coverage. However, there are
still significant data gaps. For example, there is no data
available for forest products nor livestock. Therefore, no
GHG emissions estimates were made for beef & leather,
or for timber products.
Environmentalandsocialriskrating
Having derived a minimum estimate of the provenance
of the Netherlands’ imports and the associated land
footprint, this study explored the potential risks linked
with imports from these countries. Only countries that
account for at least 2% of the volume imported into the
Netherlands were included.
	 We used four indicators to explore deforestation and
key social and governance risks (see table bottom page).
	 For each producer country the criteria were scored
and summed to give a total out of 12. These were then
allocated to five categories: very high risk (total score of
11 or more), high risk (9-10), medium risk (7-8), medium-
low risk (5-6) and low risk (4 or less). Being based on
national-level datasets, these represent the generic level
of risk, not the risk specific to a commodity or the part
of the country it may be sourced from. It also represents
an unmitigated level of risk, i.e. before any action may
have been taken to ensure that production is not linked
to deforestation or social challenges.
	 The approach used provides some estimates of
the risks to ecosystems with at least 10% tree cover,
therefore not only considering forests but also other
ecosystems with partial tree cover, including most of the
Cerrado. However, we were unable to assess risks due
to conversion of grasslands or other ecosystems with
a lower tree density as there are no global datasets for
these ecosystems: the text highlights where the risks of
conversion of ecosystems with low or no tree cover are
associated with a particular commodity.
	 It is important to recognise that the limited traceability
of supply chains means that most of the Netherlands’
imports can not be traced back to specific sub-national
locations or risks. Despite its limitations, the risk-based
approach highlights the need for Dutch actors to manage
their potential risk of creating negative impacts overseas.
Risk Factor Description Rationale High Risk Medium Risk Low Risk
Deforestation
extent
Deforestation
rate
Labour
rights
Rude of Law
Area of forest cover loss
2017-21 (Global Forest
Watch)
% net natural forest loss
2010-20 (FAO)
Labour standards score
(ITUC)
Rule of Law score
(World Bank)
Amount of deforestation
Rate of deforestation
Reported incidence
of major labour rights
violations
Perception of how good
laws are and how well they
are implemented
>1 Mha
>1%
4 - 5
<-0.3
0.5 Mha-1
M ha
0% - 1%
2 - 3
0.3 - 1
< 0.5 Mha
< 0%
1
>1
THEIMPACTOFDUTCHIMPORTSONNATURELOSSWORLDWIDE THEIMPACTOFDUTCHIMPORTSONNATURELOSSWORLDWIDE
56 57
REFERENCES
1 	 Global Witness (2021). Last line of defence: the industries causing the climate crisis 	
	 and attacks against land and environmental defenders.
2	 Convention on Biological Diversity, 2018. Aichi Biodiversity Targets.
	 https://www.cbd.int/sp/targets/
3	 UN Climate Change Conference UK 2021 (November 2021). Glasgow leaders’ 	
	 declaration on forests and land use. https://ukcop26.org/glasgow-leaders-	
	 declaration-on-forests-and-land-use/
4	 European Commission (2020). Communication from the
	 Commission: A Farm to Fork Strategy. https://eur-lex.europa.eu/legal-content/	
	 EN/TXT/?uri=CELEX%3A52020DC0381
5	 BothEnds (2014). Soy Barometer 2014. http://www.bothends.org/uploaded
	 _files/document/Soy_Barometer2014_ENG.pdf
6	 We distinguish between the consumption of a commodity (direct human 		
	 consumption or embedded in the production of other products - e.g. feed embedded 	
	 in animal products) and the use of a commodity (what is used in the Netherlands, 	
	 for example as feed, that is later exported in the form of animal products) in this report
7	 A recent EU-wide estimate put the figure at 90% (Kuepper, B. & Manon Stravens, 	
	 M. (2022). Mapping the European Soy Supply Chain Embedded Soy in Animal 	
	 Products Consumed in the EU27+UK. ProFundo), whilst an older estimate 	
	 specifically for the Netherlands estimated that 88% of combined quantity soybeans, 	
	 meal and oil was used as animal feed (BothEnds (2014). Soy Barometer 2014. 	
	 http://www.bothends.org/uploaded_files/document/Soy_Barometer2014_ENG.pdf
8	 Wedeux, B. & Schulmeister-Oldenhove, A. (2021). Stepping up? The continuing 	
	 impact of EU consumption on nature worldwide. WWF.
9	 Jennings, S., Munkedal, C., Abbott, C., and McCormack, C. (2022). Beyond Forests: 	
	 Reducing the EU’s footprint on all natural ecosystems. WWF.
	 https://www.wwf.eu/?5709966/Beyond-Forests-Reducing-the-EUs-footprint-
	 on-all-natural-ecosystems
10	 The Nature Conservancy (2019). Incentives for sustainable soy in the Cerrado. 	
	 https://www.nature.org/content/dam/tnc/nature/en/documents/TNC_	
	 IncentivesforSustainableSoyinCerrado_Nov2019.pdf
11	 IBGE. (2018). Agricultural census 2017. www.sidra.ibge.gov.br/pesquisa/censo- 	
	 agropecuario/censo-agropecuario-2017
12	 Agrosatélite Geotecnologia Aplicada Ltda. Análise geoespacial da expansão da soja 	
	 no bioma Cerrado: 2000/01 a 2020/21. – Florianópolis-SC, Brasil, 2021.
	 ISBN: 978-65-991465-4-1
13	 Data in this case study refers only to direct exports of soy to the Netherlands, and 	
	 does not include soy that was exported to other countries and then later exported 	
	 to the Netherlands, either as soy or embedded in other imports. As a consequence, 	
	 the numbers are not directly comparable to those presented in the rest of the report.
14	 The data (volumes, companies and GHG emissions) presented here are based on an 	
	 analysis of TRASE: https://www.trase.earth/
15	 Vijay V., Pimm S.L., Jenkins C.N., Smith S.J. (2017). The Impacts of Oil Palm on 	
	 Recent Deforestation and Biodiversity Loss. PLoS ONE 11/7, 1-19.
16	 Summarised in Barthel, M., Jennings, S., Schreiber, W., Sheane, R., Royston, S., 	
	 Fry, J., Khor, Y.L. and McGill, J., (2017). Study on the environmental impact of 	
	 palm oil consumption and on existing sustainability standards. Brussels: 		
	 Directorate-General for Environment, European Commission. www.ec.europa.eu/	
	 environment/forests/pdf/palm_oil_study_kh0218208enn_new.pdf
17	 Dutch Alliance for Sustainable Palm Oil (2021). Annual Report DASPO 2020.
18	 ‘Mass Balance’ is a system whereby certified and non-certified materials are mixed, 	
	 with a proportion claimed as certified.
19	 Statistics Indonesia. (2021). Indonesian palm oil statistics 2020. Jakarta, Indonesia: 	
	 BPS. ISSN: 1978-9947
20	 Gillison, A.N. (2001). Vegetation surveuy and habitat assessment of the Tesso 	
	 Nilo forest complex, Pekanbaru, Riau Province, Sumatra, Indonesia. WWF 	
	 Technnical Report, WWF, Washington DC, USA.
21	 IUCN (2021). https://www.iucnredlist.org/ ‘Endangered’ species are considered 	
	 here as vulnerable, endangered, critically endangered and extinct.
22	 Statistics Indonesia. (2010). Indonesian palm oil statistics 2020. Jakarta, 	
	 Indonesia: BPS. ISSN. 1978-9947
23	 Khor, Yuleng (2016), Socio-economic parameters for peat restoration policy makers 	
	 [presentation], LM International Ltd, 15th International Peat Congress (Kuching: 17 	
	 Aug. 2016).
24	 Apresian, S.R., Tyson, A., Varkkey, H., Al, S., Choiruzzad, S. & Indraswari, R. 	
	 (2020). Palm Oil Development in Riau, Indonesia: Balancing Economic Growth and 	
	 Environmental Protection. 2. 1-29. 10.6936/NIJHSS.202006_2(1).0001.
25	 Helmi, H. Djafri, D., Mutiani, C., Halim, N.A., Badri, M., Yefni, Y. (2021). 	
	 Indigenous people in the dynamics of land use changes, forest fires, and haze in 	
	 Riau Province, Indonesia. Pages 291-308 in Natural Resource Governance in Asia, 	
	 Chapter 18. Editor(s): Raza Ullah, Shubhechchha Sharma, Makoto Inoue, Sobia 	
	 Asghar, Ganesh Shivakoti. Elsevier. ISBN 9780323857291, https://doi.org/10.1016/	
	 B978-0-323-85729-1.00023-2
26	 Global Forest Watch (2021). https://www.globalforestwatch.org/
27	 Zhao, J., Lee, J.S.H., 2,3, Elmore, A.J., Fatimah, Y.A., Numata, I., Zhang, X., & A 	
	 Cochrane (2022). Spatial patterns and drivers of smallholder oil palm expansion 	
	 within peat swamp forests of Riau, Indonesia. Environmental Research Letters, 	
	 Volume 17, 4
28	 Eyes on the Forest (2018). Palm oil plantations operating in the Riau forest estate 	
	 without permits and linked to allegedly law violations
29	 Butler, R. (2014). Half of Riau’s oil palm plantations are illegal. Mongabay. 	
	 https://news.mongabay.com/2014/08/half-of-riaus-oil-palm-plantations-	
	 are-illegal/#:~:text=Half%20of%20the%20oil%20palm,oil%20palm%20	
	 plantations%20lack%20permits.
30	 TRASE https://www.trase.earth/
31	 Olenex Edible Oils B.V. – Rotterdam. Traceability Summary - Supplies January 	
	 2020 – December 2020; Bunge Loders Croklaan Global 2020 Full Year Mill List; 	
	 Cargill Global Mill List - Quarter 4, 2021; AAK public mill list (September 2021).
32	 Viterra B.V. (2020). RSPO Annual Communication of Progress 2020.
	 https://www.rspo.org/members/
33	 Global Forest Watch. Universal Mill List. https://data.globalforestwatch.org/	
	 documents/universal-mill-list/explore
34	 Eyes on the Forest (2020). Enough is enough - time for the palm oil market to 	
	 start the real work to stop driving deforestation. Investigative report. https://www.	
	 eyesontheforest.or.id/reports/investigative-report-enough-is-enough-jun-2018
35	 WWF-Indonesia (2013). Palming off a National Park. Tracking illegal oil palm fruit 	
	 in Riau, Sumatra. https://wwf.panda.org/wwf_news/?209261/REPORT-Palming-	
	 off-a-National-Park-Tracking-Illegal-Palm-Oil-Fruit-in-Riau-Sumatra
36	 Eyes on the Forest (2020). Enough is enough - time for the palm oil market to 	
	 start the real work to stop driving deforestation. Investigative report. https://www.	
	 eyesontheforest.or.id/reports/investigative-report-enough-is-enough-jun-2018
37	 FEFAC (n.d). Feed and Food Statistical Yearbook 2018.
38	 WWF (2021). 2021 Plowprint Report.
39	 CBI (22 September 2021). The Dutch market potential for cocoa. https://www.cbi.	
	 eu/market-information/cocoa-cocoa-products/netherlands/market-potential
40	 Kroeger, A. et al. (2017) Eliminating Deforestation from the Cocoa Supply Chain. 	
	 World Bank Group, 2017.
41	 ILO (2007). Rooting out Child Labour from Cocoa Farms. Paper No. 2: health and 	
	 Safety Hazards.
42	 Sadhu, S., Kysia, K., Onyango, L., Zinnes, C., Lord, S., Monnard, A., & Arellano, 	
	 I.R (2020). NORC Final Report: Assessing Progress in Reducing Child Labor in 	
	 Cocoa Production in Cocoa Growing Areas of Côte d’Ivoire and Ghana
43	 ITC. (2019). The State of Sustainable Markets 2019: Statistics and Emerging 	
	 Trends. www.intracen.org/ uploadedFiles/intracenorg/Content/Publications/ 	
	 Sustainabile%20markets%202019%20web.pdf
44	 World Cocoa Foundation https://www.worldcocoafoundation.org/about-wcf/	
	 vision-mission/
45	 Cocoa and Forests Initiative https://www.worldcocoafoundation.org/initiative/	
	 cocoa-forests-initiative/
46	 NU (03 May 2018). Nederlandse bedrijven gebruiken vaker duurzame cacao. 	
	 https://www.nu.nl/duurzaam/5248700/nederlandse-bedrijven-gebruiken-vaker-	
	 duurzame-cacao.html
47	 Dutch Initiative on Sustainable Cocoa https://www.idhsustainabletrade.com/	
	 initiative/dutch-initiative-on-sustainable-cocoa-disco/
48	 IDH (2021). Roadmap to deforestation-free cocoa in Cameroon. https://www.	
	 idhsustainabletrade.com/uploaded/2021/01/20210111-RDFC-2-Pager-2-_Final.pdf
49	 European Commission (2020). Analysis of the cacao value chain of Cameroon. 	
	 Value Chains for Development no. 23.
50	 Office of Child Labor, Forced Labor, and Human Trafficking (2021). Findings on the 	
	 worst forms of child labour 2020. Bureau of International Labor Affairs. United 	
	 States Department of Labor. https://www.dol.gov/sites/dolgov/files/ILAB/child_	
	 labor_reports/tda2020/2020_TDA_BigBook_Online_optimized.pdf
51	 WWF (12 February 2020). TRIDOM Initiative for People and Biodiversity: 	
	 Reconciling conservation and human wellbeing in Africa’s unique forest. https://	
	 africa.panda.org/?30901/TRIDOM-Initiative-for-People-and-Biodiversity-	
	 Reconciling-conservation-and-human-wellbeing-in-Africas-unique-forest
52	 Koffi, G. (25 February 2021). On the road to deforestation-free cocoa in Cameroon. 	
	 World Agroforestry. https://worldagroforestry.org/blog/2021/02/25/road-	
	 deforestation-free-cocoa-cameroon
53	 UNCOMTRADE. https://comtrade.un.org/
54	 CBI (22 September 2021). The Dutch market potential for cocoa. https://www.cbi.	
	 eu/market-information/cocoa-cocoa-products/netherlands/market-potential
55	 Voora, V., Bermúdez, S., Larrea, C & Baliño, S. (2019). Global Market Report: 	
	 Coffee. IISD.
56	 Fountain, A.C. & Heutz-Adams, F. (2021). Cocoa Barometer 2020. https://	
	 voicenetwork.cc/wp-content/uploads/2021/03/2020-Cocoa-Barometer-EN.pdf
57	 Office National du Cacao et du Café (n.d.). Cocoa Producing Areas of Cameroon. 	
	 https://oncc.cm/cocoa-production-zones
58	 FAOSTAT. (2022). Food and Agriculture data. www.fao.org/faostat/en/#home
59	 Panhuysen, S. and Pierrot, J. (2018). Coffee Barometer 2018
60	 World Vision (2016). No Child for Sale: Coffee. Available at http://nochildforsale.	
	 ca/wp- content/uploads/2016/04/Coffee_Infographic.pdf
61	 Danwatch (2016). Bitter Kaffee. Available at https://old.danwatch.dk/en/	
	 undersogelse/bitter-kaffe/
62	 The Guardian (2016). Nestle admits slave labour risk on Brazil coffee plantations. 	
	 Available at https://www.theguardian.com/global-development/2016/mar/02/	
	 nestle-admits-slave-labour-risk-on-brazil-coffee- plantations
63	 Bunn et al. (2015). A bitter cup: climate change profile of global production of 	
	 Arabica and Robusta coffee. Climate Change, 129: 89-101
64	 FAOSTAT. (2022). Food and Agriculture data. www.fao.org/faostat/en/#home
65	 Erik Meijaard, E., Abrams, J.F., Juffe-Bignoli, D., Voigt, M., & Sheil, D. 		
	 (2020). Coconut oil, conservation and the conscientious consumer. 		
	 Current Biology, Volume z30, Issue 13, Open ArchiveDOI: https://doi.		
	 org/10.1016/j.cub.2020.05.059
66	 Rochmyaningsih, D (July 2020). Claim that coconut oil is worse for
	 biodiversity than palm oil sparks furious debate. ScienceInsider. https://www.	
	 science.org/content/article/claim-coconut-oil-worse-biodiversity-palm-oil-sparks-	
	 furious-debate
67	 http://www.napc.gov.ph/sites/default/files/documents/articles/Issue%20No.%20	
	 2%20- %20Coconut%20Road%20Map.compressed.pdf
68	 https://www.dol.gov/sites/dolgov/files/ILAB/ListofGoods.pdf
69	 Estimated from FAOSTAT by apportioning national pasture area between beef, 	
	 dairy and sheep/goats based on national production data and food conversion and 	
	 food conversion ratios.
70	 Henders, S. Persson, U.M, Kastner, T. (2015), Trading forests: land-use change 	
	 and carbon emissions embodied in production and exports of forest-risk 		
	 commodities. Environ. Res. Lett. 10 125012
71	 Goldman, E., Weisse, M.J., Harris, N. & Schneider, M. (2020). Estimating the Role 	
	 of Seven Commodities in Agriculture-Linked Deforestation: Oil Palm, Soy, Cattle, 	
	 Wood Fiber, Cocoa, Coffee, and Rubber.” Technical Note. Washington, DC: World 	
	 Resources Institute.
72	 ILO (2009) Fighting Forced Labour: The Example of Brazil. International
	 Labour Organization.
73	 Global Roundtable for Sustainable Beef. https://grsbeef.org/
74	 FAOSTAT. (2022). Food and Agriculture data. www.fao.org/faostat/en/#home
75	 Dudley, N., Jeanrenaud, J.P., and Sullivan, F. (2014). Bad Harvest: The Timber 	
	 Trade and the Degradation of Global Forests. Taylor & Francis.
76	 Potts, J., Lynch, M., Wilkings, A., Huppé, G., Cunningham, M., and Voora, V. 	
	 (2014). State of Sustainability Initiatives Review. IISD & IIED.
77	 WWF International (2015). WWF Certification Assessment Tool v03: Forest 	
	 Stewardship Council (FSC), and WWF Certification Assessment Tool v03: 	
	 Programme for the Endorsement of Forest Certification (PEFC). Both available at 	
	 http://wwf.panda.org/?246871/WWF-Forest-Certification-Assessment-Tool-CAT
78	 Penninkhof, J. & Oldenburger, J. (2021). Resultaten VVNH monitoring
	 2020. Probos.
79	 UNCOMTRADE. https://comtrade.un.org/
80	 De Ruiter, H., Macdiarmid, J.I., Matthews, R.B., Kastner, T., Lynd, L.R. & Smith, 	
	 P. (2017). Total global land footprint associated with UK food supply 1986-2011. 	
	 Global Environmental Change. 43, 72-81. Doi:10.1016/j.gloenvcha.2017.01.007
81	 FAO (2016) Global Forest Resource Assessment 2015: Desk Reference. FAO, Rome.
82	 De Weert. L (2021). LUC Impact Tool. Blonc Consultants.
	 https://blonksustainability.nl/news/update-of-the-blonk-direct-land-
	 use-change-assessment-tool
WWF-NL
Driebergseweg 10
3708 JB Zeist
Postal address
Postbus 7
3700 AA Zeist
Tel.: 0800-1962
©
1986
Panda
Symbol
WWF
®
«WWF»
is
a
trademark
registered
by
WWF
Our Mission
Together, we protect the environment and create
a future worth living for generations to come.

More Related Content

Similar to WWF Report: Risky Business

Dr. Sami Lakkis - Impact of Untreated Urban and Industrial Solid Waste
Dr. Sami Lakkis - Impact of Untreated Urban and Industrial Solid WasteDr. Sami Lakkis - Impact of Untreated Urban and Industrial Solid Waste
Dr. Sami Lakkis - Impact of Untreated Urban and Industrial Solid WasteHudhaib Al-Allatti
 
1. wool scouring environment issues
1. wool scouring environment issues1. wool scouring environment issues
1. wool scouring environment issuesAdane Nega
 
1. wool scouring environment issues
1. wool scouring environment issues1. wool scouring environment issues
1. wool scouring environment issuesAdane Nega
 
A presentation on petrochemical indutries of Bangladesh
A presentation on petrochemical indutries of BangladeshA presentation on petrochemical indutries of Bangladesh
A presentation on petrochemical indutries of Bangladeshshakiloney
 
solid waste management in switzerland.pptx
solid waste management in switzerland.pptxsolid waste management in switzerland.pptx
solid waste management in switzerland.pptxVittalSBajantri
 
Recyclamed : outdated pharmaceutics destruction
Recyclamed : outdated pharmaceutics destructionRecyclamed : outdated pharmaceutics destruction
Recyclamed : outdated pharmaceutics destructionRECYCLAMED OUTDATED DRUGS
 
New ideas for feeding cities in 2030
New ideas for feeding cities in 2030New ideas for feeding cities in 2030
New ideas for feeding cities in 2030Jan de Wilt
 
Plantagon def 10102016 De Wilt 2
Plantagon def 10102016 De Wilt 2Plantagon def 10102016 De Wilt 2
Plantagon def 10102016 De Wilt 2Jan de Wilt
 
Bio based products 2/2: Feedstocks and formulation, certification workshop [a...
Bio based products 2/2: Feedstocks and formulation, certification workshop [a...Bio based products 2/2: Feedstocks and formulation, certification workshop [a...
Bio based products 2/2: Feedstocks and formulation, certification workshop [a...James Sherwood
 
INDUSTRIAL SYMBIOSIS.pdf
INDUSTRIAL SYMBIOSIS.pdfINDUSTRIAL SYMBIOSIS.pdf
INDUSTRIAL SYMBIOSIS.pdfDrReyaIssac
 
MYRA Business School, Mysore Business education in emerging markets - integra...
MYRA Business School, Mysore Business education in emerging markets - integra...MYRA Business School, Mysore Business education in emerging markets - integra...
MYRA Business School, Mysore Business education in emerging markets - integra...MyRA School of Business
 
MYRA Business School, Mysore Business education in emerging markets - integra...
MYRA Business School, Mysore Business education in emerging markets - integra...MYRA Business School, Mysore Business education in emerging markets - integra...
MYRA Business School, Mysore Business education in emerging markets - integra...MYRA School of Business
 
Waste as a resource - Pathway to a Resilient Future for Dorset - Workshop Pre...
Waste as a resource - Pathway to a Resilient Future for Dorset - Workshop Pre...Waste as a resource - Pathway to a Resilient Future for Dorset - Workshop Pre...
Waste as a resource - Pathway to a Resilient Future for Dorset - Workshop Pre...Ecological Sequestration Trust
 
Livestock production, climate change and mitigation strategies
Livestock production, climate change and mitigation strategiesLivestock production, climate change and mitigation strategies
Livestock production, climate change and mitigation strategiesDr. Ishwor Dhakal
 
Livestock summary of key points 40-c
Livestock   summary of key points 40-cLivestock   summary of key points 40-c
Livestock summary of key points 40-cPaul Mahony
 
Agroforestry for Europe's farmers
Agroforestry for Europe's farmersAgroforestry for Europe's farmers
Agroforestry for Europe's farmersPatrick Worms
 
EHS pulp & paper indutry
EHS pulp & paper indutryEHS pulp & paper indutry
EHS pulp & paper indutryArvind Kumar
 
Euro Food 2015_eFoodLab_Special Issue_2015
Euro Food 2015_eFoodLab_Special Issue_2015Euro Food 2015_eFoodLab_Special Issue_2015
Euro Food 2015_eFoodLab_Special Issue_2015Nancy Albert
 

Similar to WWF Report: Risky Business (20)

Dr. Sami Lakkis - Impact of Untreated Urban and Industrial Solid Waste
Dr. Sami Lakkis - Impact of Untreated Urban and Industrial Solid WasteDr. Sami Lakkis - Impact of Untreated Urban and Industrial Solid Waste
Dr. Sami Lakkis - Impact of Untreated Urban and Industrial Solid Waste
 
1. wool scouring environment issues
1. wool scouring environment issues1. wool scouring environment issues
1. wool scouring environment issues
 
1. wool scouring environment issues
1. wool scouring environment issues1. wool scouring environment issues
1. wool scouring environment issues
 
A presentation on petrochemical indutries of Bangladesh
A presentation on petrochemical indutries of BangladeshA presentation on petrochemical indutries of Bangladesh
A presentation on petrochemical indutries of Bangladesh
 
solid waste management in switzerland.pptx
solid waste management in switzerland.pptxsolid waste management in switzerland.pptx
solid waste management in switzerland.pptx
 
ESPP eNews #005 November 2016
 ESPP eNews #005 November 2016  ESPP eNews #005 November 2016
ESPP eNews #005 November 2016
 
Solid waste
Solid wasteSolid waste
Solid waste
 
Recyclamed : outdated pharmaceutics destruction
Recyclamed : outdated pharmaceutics destructionRecyclamed : outdated pharmaceutics destruction
Recyclamed : outdated pharmaceutics destruction
 
New ideas for feeding cities in 2030
New ideas for feeding cities in 2030New ideas for feeding cities in 2030
New ideas for feeding cities in 2030
 
Plantagon def 10102016 De Wilt 2
Plantagon def 10102016 De Wilt 2Plantagon def 10102016 De Wilt 2
Plantagon def 10102016 De Wilt 2
 
Bio based products 2/2: Feedstocks and formulation, certification workshop [a...
Bio based products 2/2: Feedstocks and formulation, certification workshop [a...Bio based products 2/2: Feedstocks and formulation, certification workshop [a...
Bio based products 2/2: Feedstocks and formulation, certification workshop [a...
 
INDUSTRIAL SYMBIOSIS.pdf
INDUSTRIAL SYMBIOSIS.pdfINDUSTRIAL SYMBIOSIS.pdf
INDUSTRIAL SYMBIOSIS.pdf
 
MYRA Business School, Mysore Business education in emerging markets - integra...
MYRA Business School, Mysore Business education in emerging markets - integra...MYRA Business School, Mysore Business education in emerging markets - integra...
MYRA Business School, Mysore Business education in emerging markets - integra...
 
MYRA Business School, Mysore Business education in emerging markets - integra...
MYRA Business School, Mysore Business education in emerging markets - integra...MYRA Business School, Mysore Business education in emerging markets - integra...
MYRA Business School, Mysore Business education in emerging markets - integra...
 
Waste as a resource - Pathway to a Resilient Future for Dorset - Workshop Pre...
Waste as a resource - Pathway to a Resilient Future for Dorset - Workshop Pre...Waste as a resource - Pathway to a Resilient Future for Dorset - Workshop Pre...
Waste as a resource - Pathway to a Resilient Future for Dorset - Workshop Pre...
 
Livestock production, climate change and mitigation strategies
Livestock production, climate change and mitigation strategiesLivestock production, climate change and mitigation strategies
Livestock production, climate change and mitigation strategies
 
Livestock summary of key points 40-c
Livestock   summary of key points 40-cLivestock   summary of key points 40-c
Livestock summary of key points 40-c
 
Agroforestry for Europe's farmers
Agroforestry for Europe's farmersAgroforestry for Europe's farmers
Agroforestry for Europe's farmers
 
EHS pulp & paper indutry
EHS pulp & paper indutryEHS pulp & paper indutry
EHS pulp & paper indutry
 
Euro Food 2015_eFoodLab_Special Issue_2015
Euro Food 2015_eFoodLab_Special Issue_2015Euro Food 2015_eFoodLab_Special Issue_2015
Euro Food 2015_eFoodLab_Special Issue_2015
 

More from Energy for One World

DNV publication: China Energy Transition Outlook 2024
DNV publication: China Energy Transition Outlook 2024DNV publication: China Energy Transition Outlook 2024
DNV publication: China Energy Transition Outlook 2024Energy for One World
 
Club of Rome: Eco-nomics for an Ecological Civilization
Club of Rome: Eco-nomics for an Ecological CivilizationClub of Rome: Eco-nomics for an Ecological Civilization
Club of Rome: Eco-nomics for an Ecological CivilizationEnergy for One World
 
Science Publication: The Economic Cost of Climate Change
Science Publication: The Economic Cost of Climate ChangeScience Publication: The Economic Cost of Climate Change
Science Publication: The Economic Cost of Climate ChangeEnergy for One World
 
Shell Climate Court Case: Concluding Remarks 2024-04-12 Slotpleidooi Milieude...
Shell Climate Court Case: Concluding Remarks 2024-04-12 Slotpleidooi Milieude...Shell Climate Court Case: Concluding Remarks 2024-04-12 Slotpleidooi Milieude...
Shell Climate Court Case: Concluding Remarks 2024-04-12 Slotpleidooi Milieude...Energy for One World
 
Science Publication: The atlas of unburnable oil for supply-side climate poli...
Science Publication: The atlas of unburnable oil for supply-side climate poli...Science Publication: The atlas of unburnable oil for supply-side climate poli...
Science Publication: The atlas of unburnable oil for supply-side climate poli...Energy for One World
 
UN DESA: Finance for Development 2024 Report
UN DESA: Finance for Development 2024 ReportUN DESA: Finance for Development 2024 Report
UN DESA: Finance for Development 2024 ReportEnergy for One World
 
OECD Global Reporting Initiative_ Executive summary (1).pdf
OECD Global Reporting Initiative_ Executive summary (1).pdfOECD Global Reporting Initiative_ Executive summary (1).pdf
OECD Global Reporting Initiative_ Executive summary (1).pdfEnergy for One World
 
European Court of Human Rights: Judgment Verein KlimaSeniorinnen Schweiz and ...
European Court of Human Rights: Judgment Verein KlimaSeniorinnen Schweiz and ...European Court of Human Rights: Judgment Verein KlimaSeniorinnen Schweiz and ...
European Court of Human Rights: Judgment Verein KlimaSeniorinnen Schweiz and ...Energy for One World
 
Pope Francis Teaching: Dignitas Infinita- On Human Dignity
Pope Francis Teaching: Dignitas Infinita- On Human DignityPope Francis Teaching: Dignitas Infinita- On Human Dignity
Pope Francis Teaching: Dignitas Infinita- On Human DignityEnergy for One World
 
2024-04-03 Pleidooi Milieudefensie dag 3 - deel 1 (1).pdf
2024-04-03 Pleidooi Milieudefensie dag 3 - deel 1 (1).pdf2024-04-03 Pleidooi Milieudefensie dag 3 - deel 1 (1).pdf
2024-04-03 Pleidooi Milieudefensie dag 3 - deel 1 (1).pdfEnergy for One World
 
The Shell Court Case: 2024-04-04 Pleidooi Milieudefensie c.s. - effectiviteit...
The Shell Court Case: 2024-04-04 Pleidooi Milieudefensie c.s. - effectiviteit...The Shell Court Case: 2024-04-04 Pleidooi Milieudefensie c.s. - effectiviteit...
The Shell Court Case: 2024-04-04 Pleidooi Milieudefensie c.s. - effectiviteit...Energy for One World
 
The Shell Court Case :2024-04-04 Stuk over Shell's beleid-def (1).pdf
The Shell Court Case :2024-04-04 Stuk over Shell's beleid-def (1).pdfThe Shell Court Case :2024-04-04 Stuk over Shell's beleid-def (1).pdf
The Shell Court Case :2024-04-04 Stuk over Shell's beleid-def (1).pdfEnergy for One World
 
The Shell Court Case: 2024-04-03 Pleidooi dag 3 - deel 4.pdf
The Shell Court Case: 2024-04-03 Pleidooi dag 3 - deel 4.pdfThe Shell Court Case: 2024-04-03 Pleidooi dag 3 - deel 4.pdf
The Shell Court Case: 2024-04-03 Pleidooi dag 3 - deel 4.pdfEnergy for One World
 
The Shell Court Case: 2024-04-03 Pleidooi dag 3 - deel 3
The Shell Court Case: 2024-04-03 Pleidooi dag 3 - deel 3The Shell Court Case: 2024-04-03 Pleidooi dag 3 - deel 3
The Shell Court Case: 2024-04-03 Pleidooi dag 3 - deel 3Energy for One World
 
The Shell Court Case: 2024-04-01 Openingspleidooi Milieudefensie c.s. - deel ...
The Shell Court Case: 2024-04-01 Openingspleidooi Milieudefensie c.s. - deel ...The Shell Court Case: 2024-04-01 Openingspleidooi Milieudefensie c.s. - deel ...
The Shell Court Case: 2024-04-01 Openingspleidooi Milieudefensie c.s. - deel ...Energy for One World
 
The Shell Court Case : 2024-04-01 Openingspleidooi Milieudefensie c.s. - deel...
The Shell Court Case : 2024-04-01 Openingspleidooi Milieudefensie c.s. - deel...The Shell Court Case : 2024-04-01 Openingspleidooi Milieudefensie c.s. - deel...
The Shell Court Case : 2024-04-01 Openingspleidooi Milieudefensie c.s. - deel...Energy for One World
 
World Energy Council: Issues Monitor 2024- Full_Report
World Energy Council: Issues Monitor 2024- Full_ReportWorld Energy Council: Issues Monitor 2024- Full_Report
World Energy Council: Issues Monitor 2024- Full_ReportEnergy for One World
 
Global Energy Monitor: Global Oil and Gas Extraction Tracker March-2024
Global Energy Monitor: Global Oil and Gas Extraction Tracker March-2024Global Energy Monitor: Global Oil and Gas Extraction Tracker March-2024
Global Energy Monitor: Global Oil and Gas Extraction Tracker March-2024Energy for One World
 
World Happiness Report 2024- Full Report
World Happiness Report 2024- Full ReportWorld Happiness Report 2024- Full Report
World Happiness Report 2024- Full ReportEnergy for One World
 
CeraWeek 2024 - Executive conference agenda
CeraWeek 2024 - Executive conference agendaCeraWeek 2024 - Executive conference agenda
CeraWeek 2024 - Executive conference agendaEnergy for One World
 

More from Energy for One World (20)

DNV publication: China Energy Transition Outlook 2024
DNV publication: China Energy Transition Outlook 2024DNV publication: China Energy Transition Outlook 2024
DNV publication: China Energy Transition Outlook 2024
 
Club of Rome: Eco-nomics for an Ecological Civilization
Club of Rome: Eco-nomics for an Ecological CivilizationClub of Rome: Eco-nomics for an Ecological Civilization
Club of Rome: Eco-nomics for an Ecological Civilization
 
Science Publication: The Economic Cost of Climate Change
Science Publication: The Economic Cost of Climate ChangeScience Publication: The Economic Cost of Climate Change
Science Publication: The Economic Cost of Climate Change
 
Shell Climate Court Case: Concluding Remarks 2024-04-12 Slotpleidooi Milieude...
Shell Climate Court Case: Concluding Remarks 2024-04-12 Slotpleidooi Milieude...Shell Climate Court Case: Concluding Remarks 2024-04-12 Slotpleidooi Milieude...
Shell Climate Court Case: Concluding Remarks 2024-04-12 Slotpleidooi Milieude...
 
Science Publication: The atlas of unburnable oil for supply-side climate poli...
Science Publication: The atlas of unburnable oil for supply-side climate poli...Science Publication: The atlas of unburnable oil for supply-side climate poli...
Science Publication: The atlas of unburnable oil for supply-side climate poli...
 
UN DESA: Finance for Development 2024 Report
UN DESA: Finance for Development 2024 ReportUN DESA: Finance for Development 2024 Report
UN DESA: Finance for Development 2024 Report
 
OECD Global Reporting Initiative_ Executive summary (1).pdf
OECD Global Reporting Initiative_ Executive summary (1).pdfOECD Global Reporting Initiative_ Executive summary (1).pdf
OECD Global Reporting Initiative_ Executive summary (1).pdf
 
European Court of Human Rights: Judgment Verein KlimaSeniorinnen Schweiz and ...
European Court of Human Rights: Judgment Verein KlimaSeniorinnen Schweiz and ...European Court of Human Rights: Judgment Verein KlimaSeniorinnen Schweiz and ...
European Court of Human Rights: Judgment Verein KlimaSeniorinnen Schweiz and ...
 
Pope Francis Teaching: Dignitas Infinita- On Human Dignity
Pope Francis Teaching: Dignitas Infinita- On Human DignityPope Francis Teaching: Dignitas Infinita- On Human Dignity
Pope Francis Teaching: Dignitas Infinita- On Human Dignity
 
2024-04-03 Pleidooi Milieudefensie dag 3 - deel 1 (1).pdf
2024-04-03 Pleidooi Milieudefensie dag 3 - deel 1 (1).pdf2024-04-03 Pleidooi Milieudefensie dag 3 - deel 1 (1).pdf
2024-04-03 Pleidooi Milieudefensie dag 3 - deel 1 (1).pdf
 
The Shell Court Case: 2024-04-04 Pleidooi Milieudefensie c.s. - effectiviteit...
The Shell Court Case: 2024-04-04 Pleidooi Milieudefensie c.s. - effectiviteit...The Shell Court Case: 2024-04-04 Pleidooi Milieudefensie c.s. - effectiviteit...
The Shell Court Case: 2024-04-04 Pleidooi Milieudefensie c.s. - effectiviteit...
 
The Shell Court Case :2024-04-04 Stuk over Shell's beleid-def (1).pdf
The Shell Court Case :2024-04-04 Stuk over Shell's beleid-def (1).pdfThe Shell Court Case :2024-04-04 Stuk over Shell's beleid-def (1).pdf
The Shell Court Case :2024-04-04 Stuk over Shell's beleid-def (1).pdf
 
The Shell Court Case: 2024-04-03 Pleidooi dag 3 - deel 4.pdf
The Shell Court Case: 2024-04-03 Pleidooi dag 3 - deel 4.pdfThe Shell Court Case: 2024-04-03 Pleidooi dag 3 - deel 4.pdf
The Shell Court Case: 2024-04-03 Pleidooi dag 3 - deel 4.pdf
 
The Shell Court Case: 2024-04-03 Pleidooi dag 3 - deel 3
The Shell Court Case: 2024-04-03 Pleidooi dag 3 - deel 3The Shell Court Case: 2024-04-03 Pleidooi dag 3 - deel 3
The Shell Court Case: 2024-04-03 Pleidooi dag 3 - deel 3
 
The Shell Court Case: 2024-04-01 Openingspleidooi Milieudefensie c.s. - deel ...
The Shell Court Case: 2024-04-01 Openingspleidooi Milieudefensie c.s. - deel ...The Shell Court Case: 2024-04-01 Openingspleidooi Milieudefensie c.s. - deel ...
The Shell Court Case: 2024-04-01 Openingspleidooi Milieudefensie c.s. - deel ...
 
The Shell Court Case : 2024-04-01 Openingspleidooi Milieudefensie c.s. - deel...
The Shell Court Case : 2024-04-01 Openingspleidooi Milieudefensie c.s. - deel...The Shell Court Case : 2024-04-01 Openingspleidooi Milieudefensie c.s. - deel...
The Shell Court Case : 2024-04-01 Openingspleidooi Milieudefensie c.s. - deel...
 
World Energy Council: Issues Monitor 2024- Full_Report
World Energy Council: Issues Monitor 2024- Full_ReportWorld Energy Council: Issues Monitor 2024- Full_Report
World Energy Council: Issues Monitor 2024- Full_Report
 
Global Energy Monitor: Global Oil and Gas Extraction Tracker March-2024
Global Energy Monitor: Global Oil and Gas Extraction Tracker March-2024Global Energy Monitor: Global Oil and Gas Extraction Tracker March-2024
Global Energy Monitor: Global Oil and Gas Extraction Tracker March-2024
 
World Happiness Report 2024- Full Report
World Happiness Report 2024- Full ReportWorld Happiness Report 2024- Full Report
World Happiness Report 2024- Full Report
 
CeraWeek 2024 - Executive conference agenda
CeraWeek 2024 - Executive conference agendaCeraWeek 2024 - Executive conference agenda
CeraWeek 2024 - Executive conference agenda
 

Recently uploaded

Climate change and safety and health at work
Climate change and safety and health at workClimate change and safety and health at work
Climate change and safety and health at workChristina Parmionova
 
2024 Zoom Reinstein Legacy Asbestos Webinar
2024 Zoom Reinstein Legacy Asbestos Webinar2024 Zoom Reinstein Legacy Asbestos Webinar
2024 Zoom Reinstein Legacy Asbestos WebinarLinda Reinstein
 
EDUROOT SME_ Performance upto March-2024.pptx
EDUROOT SME_ Performance upto March-2024.pptxEDUROOT SME_ Performance upto March-2024.pptx
EDUROOT SME_ Performance upto March-2024.pptxaaryamanorathofficia
 
CBO’s Recent Appeals for New Research on Health-Related Topics
CBO’s Recent Appeals for New Research on Health-Related TopicsCBO’s Recent Appeals for New Research on Health-Related Topics
CBO’s Recent Appeals for New Research on Health-Related TopicsCongressional Budget Office
 
Election 2024 Presiding Duty Keypoints_01.pdf
Election 2024 Presiding Duty Keypoints_01.pdfElection 2024 Presiding Duty Keypoints_01.pdf
Election 2024 Presiding Duty Keypoints_01.pdfSamirsinh Parmar
 
Get Premium Balaji Nagar Call Girls (8005736733) 24x7 Rate 15999 with A/c Roo...
Get Premium Balaji Nagar Call Girls (8005736733) 24x7 Rate 15999 with A/c Roo...Get Premium Balaji Nagar Call Girls (8005736733) 24x7 Rate 15999 with A/c Roo...
Get Premium Balaji Nagar Call Girls (8005736733) 24x7 Rate 15999 with A/c Roo...MOHANI PANDEY
 
Global debate on climate change and occupational safety and health.
Global debate on climate change and occupational safety and health.Global debate on climate change and occupational safety and health.
Global debate on climate change and occupational safety and health.Christina Parmionova
 
The U.S. Budget and Economic Outlook (Presentation)
The U.S. Budget and Economic Outlook (Presentation)The U.S. Budget and Economic Outlook (Presentation)
The U.S. Budget and Economic Outlook (Presentation)Congressional Budget Office
 
Item # 4 - 231 Encino Ave (Significance Only).pdf
Item # 4 - 231 Encino Ave (Significance Only).pdfItem # 4 - 231 Encino Ave (Significance Only).pdf
Item # 4 - 231 Encino Ave (Significance Only).pdfahcitycouncil
 
(NEHA) Bhosari Call Girls Just Call 7001035870 [ Cash on Delivery ] Pune Escorts
(NEHA) Bhosari Call Girls Just Call 7001035870 [ Cash on Delivery ] Pune Escorts(NEHA) Bhosari Call Girls Just Call 7001035870 [ Cash on Delivery ] Pune Escorts
(NEHA) Bhosari Call Girls Just Call 7001035870 [ Cash on Delivery ] Pune Escortsranjana rawat
 
Expressive clarity oral presentation.pptx
Expressive clarity oral presentation.pptxExpressive clarity oral presentation.pptx
Expressive clarity oral presentation.pptxtsionhagos36
 
VIP Call Girls Bhavnagar 7001035870 Whatsapp Number, 24/07 Booking
VIP Call Girls Bhavnagar 7001035870 Whatsapp Number, 24/07 BookingVIP Call Girls Bhavnagar 7001035870 Whatsapp Number, 24/07 Booking
VIP Call Girls Bhavnagar 7001035870 Whatsapp Number, 24/07 Bookingdharasingh5698
 
Regional Snapshot Atlanta Aging Trends 2024
Regional Snapshot Atlanta Aging Trends 2024Regional Snapshot Atlanta Aging Trends 2024
Regional Snapshot Atlanta Aging Trends 2024ARCResearch
 
Call On 6297143586 Viman Nagar Call Girls In All Pune 24/7 Provide Call With...
Call On 6297143586  Viman Nagar Call Girls In All Pune 24/7 Provide Call With...Call On 6297143586  Viman Nagar Call Girls In All Pune 24/7 Provide Call With...
Call On 6297143586 Viman Nagar Call Girls In All Pune 24/7 Provide Call With...tanu pandey
 
The Economic and Organised Crime Office (EOCO) has been advised by the Office...
The Economic and Organised Crime Office (EOCO) has been advised by the Office...The Economic and Organised Crime Office (EOCO) has been advised by the Office...
The Economic and Organised Crime Office (EOCO) has been advised by the Office...nservice241
 
Akurdi ( Call Girls ) Pune 6297143586 Hot Model With Sexy Bhabi Ready For S...
Akurdi ( Call Girls ) Pune  6297143586  Hot Model With Sexy Bhabi Ready For S...Akurdi ( Call Girls ) Pune  6297143586  Hot Model With Sexy Bhabi Ready For S...
Akurdi ( Call Girls ) Pune 6297143586 Hot Model With Sexy Bhabi Ready For S...tanu pandey
 
2024: The FAR, Federal Acquisition Regulations, Part 30
2024: The FAR, Federal Acquisition Regulations, Part 302024: The FAR, Federal Acquisition Regulations, Part 30
2024: The FAR, Federal Acquisition Regulations, Part 30JSchaus & Associates
 

Recently uploaded (20)

Climate change and safety and health at work
Climate change and safety and health at workClimate change and safety and health at work
Climate change and safety and health at work
 
2024 Zoom Reinstein Legacy Asbestos Webinar
2024 Zoom Reinstein Legacy Asbestos Webinar2024 Zoom Reinstein Legacy Asbestos Webinar
2024 Zoom Reinstein Legacy Asbestos Webinar
 
EDUROOT SME_ Performance upto March-2024.pptx
EDUROOT SME_ Performance upto March-2024.pptxEDUROOT SME_ Performance upto March-2024.pptx
EDUROOT SME_ Performance upto March-2024.pptx
 
CBO’s Recent Appeals for New Research on Health-Related Topics
CBO’s Recent Appeals for New Research on Health-Related TopicsCBO’s Recent Appeals for New Research on Health-Related Topics
CBO’s Recent Appeals for New Research on Health-Related Topics
 
Election 2024 Presiding Duty Keypoints_01.pdf
Election 2024 Presiding Duty Keypoints_01.pdfElection 2024 Presiding Duty Keypoints_01.pdf
Election 2024 Presiding Duty Keypoints_01.pdf
 
Get Premium Balaji Nagar Call Girls (8005736733) 24x7 Rate 15999 with A/c Roo...
Get Premium Balaji Nagar Call Girls (8005736733) 24x7 Rate 15999 with A/c Roo...Get Premium Balaji Nagar Call Girls (8005736733) 24x7 Rate 15999 with A/c Roo...
Get Premium Balaji Nagar Call Girls (8005736733) 24x7 Rate 15999 with A/c Roo...
 
Global debate on climate change and occupational safety and health.
Global debate on climate change and occupational safety and health.Global debate on climate change and occupational safety and health.
Global debate on climate change and occupational safety and health.
 
Rohini Sector 37 Call Girls Delhi 9999965857 @Sabina Saikh No Advance
Rohini Sector 37 Call Girls Delhi 9999965857 @Sabina Saikh No AdvanceRohini Sector 37 Call Girls Delhi 9999965857 @Sabina Saikh No Advance
Rohini Sector 37 Call Girls Delhi 9999965857 @Sabina Saikh No Advance
 
The U.S. Budget and Economic Outlook (Presentation)
The U.S. Budget and Economic Outlook (Presentation)The U.S. Budget and Economic Outlook (Presentation)
The U.S. Budget and Economic Outlook (Presentation)
 
Item # 4 - 231 Encino Ave (Significance Only).pdf
Item # 4 - 231 Encino Ave (Significance Only).pdfItem # 4 - 231 Encino Ave (Significance Only).pdf
Item # 4 - 231 Encino Ave (Significance Only).pdf
 
(NEHA) Bhosari Call Girls Just Call 7001035870 [ Cash on Delivery ] Pune Escorts
(NEHA) Bhosari Call Girls Just Call 7001035870 [ Cash on Delivery ] Pune Escorts(NEHA) Bhosari Call Girls Just Call 7001035870 [ Cash on Delivery ] Pune Escorts
(NEHA) Bhosari Call Girls Just Call 7001035870 [ Cash on Delivery ] Pune Escorts
 
Expressive clarity oral presentation.pptx
Expressive clarity oral presentation.pptxExpressive clarity oral presentation.pptx
Expressive clarity oral presentation.pptx
 
(NEHA) Call Girls Nagpur Call Now 8250077686 Nagpur Escorts 24x7
(NEHA) Call Girls Nagpur Call Now 8250077686 Nagpur Escorts 24x7(NEHA) Call Girls Nagpur Call Now 8250077686 Nagpur Escorts 24x7
(NEHA) Call Girls Nagpur Call Now 8250077686 Nagpur Escorts 24x7
 
VIP Call Girls Bhavnagar 7001035870 Whatsapp Number, 24/07 Booking
VIP Call Girls Bhavnagar 7001035870 Whatsapp Number, 24/07 BookingVIP Call Girls Bhavnagar 7001035870 Whatsapp Number, 24/07 Booking
VIP Call Girls Bhavnagar 7001035870 Whatsapp Number, 24/07 Booking
 
Regional Snapshot Atlanta Aging Trends 2024
Regional Snapshot Atlanta Aging Trends 2024Regional Snapshot Atlanta Aging Trends 2024
Regional Snapshot Atlanta Aging Trends 2024
 
Call On 6297143586 Viman Nagar Call Girls In All Pune 24/7 Provide Call With...
Call On 6297143586  Viman Nagar Call Girls In All Pune 24/7 Provide Call With...Call On 6297143586  Viman Nagar Call Girls In All Pune 24/7 Provide Call With...
Call On 6297143586 Viman Nagar Call Girls In All Pune 24/7 Provide Call With...
 
The Economic and Organised Crime Office (EOCO) has been advised by the Office...
The Economic and Organised Crime Office (EOCO) has been advised by the Office...The Economic and Organised Crime Office (EOCO) has been advised by the Office...
The Economic and Organised Crime Office (EOCO) has been advised by the Office...
 
Call Girls Service Connaught Place @9999965857 Delhi 🫦 No Advance VVIP 🍎 SER...
Call Girls Service Connaught Place @9999965857 Delhi 🫦 No Advance  VVIP 🍎 SER...Call Girls Service Connaught Place @9999965857 Delhi 🫦 No Advance  VVIP 🍎 SER...
Call Girls Service Connaught Place @9999965857 Delhi 🫦 No Advance VVIP 🍎 SER...
 
Akurdi ( Call Girls ) Pune 6297143586 Hot Model With Sexy Bhabi Ready For S...
Akurdi ( Call Girls ) Pune  6297143586  Hot Model With Sexy Bhabi Ready For S...Akurdi ( Call Girls ) Pune  6297143586  Hot Model With Sexy Bhabi Ready For S...
Akurdi ( Call Girls ) Pune 6297143586 Hot Model With Sexy Bhabi Ready For S...
 
2024: The FAR, Federal Acquisition Regulations, Part 30
2024: The FAR, Federal Acquisition Regulations, Part 302024: The FAR, Federal Acquisition Regulations, Part 30
2024: The FAR, Federal Acquisition Regulations, Part 30
 

WWF Report: Risky Business

  • 2. THEIMPACTOFDUTCHIMPORTSONNATURELOSSWORLDWIDE THEIMPACTOFDUTCHIMPORTSONNATURELOSSWORLDWIDE 2 3 INTRODUCTION..........................................................5 KEYFINDINGSFORTHENETHERLANDS...............................6 RECOMMENDATIONS.................................................. 12 COMMODITYSPECIFICFINDINGS.................................... 16 SOY............................................................... 16 PALMOIL......................................................... 22 MAIZE........................................................... 28 COCOA............................................................ 32 COFFEE........................................................... 38 COCONUT......................................................... 42 BEEFANDLEATHER............................................. 46 TIMBER.......................................................... 50 OVERVIEWOFMETHODOLOGY...................................... 54 REFERENCES.......................................................... 56 CONTENTS This report summarises findings of original research undertaken by Alauda Consulting Ltd and WWF Netherlands Authors: Steve Jennings (Alauda Consulting), Seline Meijer and Corné van Dooren (WWF Netherlands) The following provided invaluable feedback into one or more versions of this report: Aditya Benyamin (WWF Indonesia), David Boyd (WWF Netherlands), Sarah Doornbos (WWF Netherlands), Roberty Pamphyl Essama (WWF Cameroon), Cécile Lachaux (WWF France), Steve Mualim (WWF Indonesia), Sandra Mulder (WWF Netherlands), Natasja Oerlemans (WWF Netherlands), Nicolas Poolen (WWF Netherlands), Angga Prathama Putra (WWF Indonesia), Anneke Rooth (WWF Netherlands), Joko Sarjito (WWF Indonesia), Anke Schulmeister- Oldenhove (WWF-EU), Daniel Silva (WWF Brazil), Guillaume Tessier (WWF Brazil), and Jean-François Timmers (WWF Brazil). Design: WWF Netherlands Publication date: September 2022
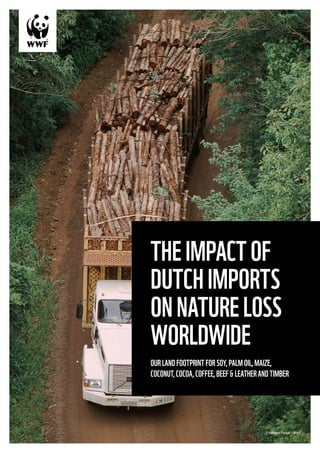
  • 3. THEIMPACTOFDUTCHIMPORTSONNATURELOSSWORLDWIDE THEIMPACTOFDUTCHIMPORTSONNATURELOSSWORLDWIDE 5 © Shutterstock / Rich Carey / WWF-Sweden INTRODUCTION We are in an era of unprecedented global environmental change, driven almost entirely by human activities. The climate crisis, disruption of biogeochemical cycles, conversion of natural ecosystems, overfishing and pollution are driven by overconsumption, unsustainable extraction rates, and by the methods we use to produce the goods we consume. One of the major drivers of the biodiversity and climate emergencies is the conversion of natural ecosystems. Eighty per cent of global deforestation results from agriculture which produces the commodities we consumers take for granted and increasingly demand. Furthermore, the conversion of natural ecosystems often results in local and indigenous peoples losing their customary land, and along with it, part of their traditional livelihoods and cultural reference. The European Commission is developing legislation making it mandatory for companies to conduct due diligence on deforestation and degradation associated withthecommoditiestheyplaceontheEuropeanmarket. As it stands now, this regulation will have a profound effect on companies operating in the Netherlands – obliging them to be truly vigilant and transparent about the environmental harms embedded within their global supply chains. It is crucial that the EU legislation is strong and effective, covering the conversion of all natural ecosystems and all relevant commodities and their products. A robust legal framework is an important starting point to motivate businesses to reconsider their impact on deforestation and conversion, yet they should notstopatmeetingthebareminimumlegalrequirements of this regulation and use this opportunity to eliminate deforestation and conversion and human rights abuses from their supply chain and that of their suppliers. The purpose of this report is to highlight the critical role that the Netherlands plays in importing and trading agricultural and forest commodities that are associated with deforestation and conversion. The report assesses the quantity and provenance of the Netherlands’ import and use of eight deforestation and conversion risk commodities: soy, palm oil, maize, coconut, cocoa, coffee, beef & leather, and timber. It estimates the area of land required to supply these imports, the risk of deforestation and conversion, and social issues associated with that land footprint, and the resulting greenhouse gas emissions. It provides recommendations for governments, businesses, the financial sector and citizens. EIGHTYPERCENTOF GLOBALDEFORESTATION RESULTSFROM AGRICULTUREWHICH PRODUCESTHE COMMODITIESWE CONSUMERSTAKE FORGRANTEDAND INCREASINGLYDEMAND
  • 4. THEIMPACTOFDUTCHIMPORTSONNATURELOSSWORLDWIDE THEIMPACTOFDUTCHIMPORTSONNATURELOSSWORLDWIDE 6 Landfootprintandgreenhousegasemissions The land required to supply the Netherlands’ imports of just eight commodities (soy, palm oil, maize, coconut, cocoa, coffee, beef & leather, and timber) is an estimated 17.3 million hectares a year. This is equivalent to more than four times the Netherlands’ land area. The largest contributions to the Netherlands’ external land footprint are imports of timber (5.1 million hectares each year), beef & leather (3.9 million hectares), soy (2.7 million hectares) and cocoa (2.5 million hectares). The greenhouse gas emissions associated with the conversion of natural ecosystems for the six commodities for which emissions could be estimated (soy, palm oil, maize, cocoa, coconut and coffee) amounted to an average of 43.6 million tonnes of CO2-equivalent each year between 2017 and 2021. This is KEYFINDINGSFORTHENETHERLANDS equivalent to 24% of the Netherlands’ domestic greenhouse gas emissions in 2019. Three commodities, soy (50%), cocoa (26%) and maize (16%) are together responsible for over 90% of these greenhouse gas emissions. EMISSIONS FROM LAND USE CHANGE ASSOCIATED WITH IMPORTS OF JUST SIX COMMODITIES ARE EQUIVALENT TO ALMOST ONE QUARTER OF THE NETHERLANDS’ DOMESTIC GREENHOUSE GAS EMISSIONS © Peter Caton / WWF-UK 7 0 1,000,000 2,000,000 3,000,000 4,000,000 5,000,000 6,000,000 7,000,000 8,000,000 9,000,000 10,000,000 11,000,000 12,000,000 13,000,000 14,000,000 15,000,000 16,000,000 17,000,000 GreenhousegasemissionsfromlandusechangeassociatedwiththeNetherlandsimports,bycommodity Averageannuallandfootprint(%thesize oftheNetherlands),bycommodity TonnesCO2 eq SOY PALMOIL MAIZE COCOA COCONUT COFFEE 13,000,000 14,000,000 15,000,000 16,000,000 17,000,000 428.770 tonnesCO2 eq 197.927 tonnesCO2 eq 11.349.657 tonnesCO2 eq 6.911.675 tonnesCO2 eq 2.852.858 tonnesCO2 eq 21.903.777 tonnesCO2 eq ANAREAFOURTIMESTHESIZEOF THENETHERLANDSISREQUIRED EACHYEARTOSUPPLYTHE NETHERLANDS’IMPORTSOFJUST EIGHTCOMMODITIES 65% SOY 19% PALMOIL 37% MAIZE 60% COCOA 12% COCONUT 5% COFFEE 122% TIMBER 95% BEEF&LEATHER 415% TOTAL 0 0 20 20 40 40 60 60 80 80 100 100 120 120 806.346ha 1.532.095ha 502.494ha 2.499.164ha 202.523ha 5.074.608ha 3.926.662ha 2.713.503ha
  • 5. THEIMPACTOFDUTCHIMPORTSONNATURELOSSWORLDWIDE THEIMPACTOFDUTCHIMPORTSONNATURELOSSWORLDWIDE Highriskfootprint Forty-three percent of the imported land footprint – 7.5 million hectares – is from countries that have a high or very high risk of deforestation, poor rule of law and a poor record of labour rights. A high proportion of the land footprints of imported palm oil (86%), cocoa (80%), coffee (69%) soy (48%) and timber (30%) is produced by countries assessed to have a high or very high risk. Large areas of land in high risk countries are also required to supply the Netherlands with commodities such as maize and coconuts, which have received less attention for their environmental impacts. Tradingdeforestation The Netherlands is a significant global actor in the trade of many of these commodities. For example, it imports 23% of the cocoa produced globally. The Netherlands exports a high proportion of these imported commodities to other countries, often after additional processing (for example of cocoa into chocolate). For example, 85% of soy imports are exported to other countries, and over half of all imported palm oil, cocoa, coffee, coconut, timber and beef and leather are exported. Exports of products from the Netherlands require an estimated 57% of the total land footprint (9.9 million hectares) emphasising the Netherlands’ critical role in international trade, and the country’s global responsibility for ensuring that commodities are free from deforestation and conversion and social harm. THE NETHERLANDS EXPORTS REQUIRE 57% OF THE IMPORTED LAND FOOTPRINT TO PRODUCE, EMPHASISING THE COUNTRY’S GLOBAL RESPONSIBILITY FOR ENSURING THAT COMMODITIES ARE FREE FROM DEFORESTATION AND CONVERSION AND SOCIAL HARM ENVIRONMENTALDEFENDERS The production of agricultural and forest commodities can sometimes be associated with social impacts beyond the issues of rule of law and workers’ rights that are assessed in this analysis. Amongst the most extreme of these is the killing of environmental defenders. In 2020, at least 227 environmental defenders who were taking peaceful action against environmental destruction were murdered globally1 . At least a third of these were indigenous people. Logging and agribusiness were amongst the leading motives for these murders and for other human rights abuses perpetrated against environmental defenders. The Netherlands imports significant quantities of commodities associated with deforestation and conversion from many of the countries in which the highest number of environmental defenders were killed: coffee and palm oil from Colombia (65 killings), coconuts from the Philippines (29), soy, maize, coffee, and beef and leather from Brazil (20), and palm oil and coffee from Honduras (17). 9 © Andre Dib / WWF Brazil © Tessel in 't Veld / WWF-Netherlands Txai Suruí is an environmental defender protecting the Amazon
  • 6. THEIMPACTOFDUTCHIMPORTSONNATURELOSSWORLDWIDE THEIMPACTOFDUTCHIMPORTSONNATURELOSSWORLDWIDE 10 11 RISKSCORE >11VeryHighRisk 9-10HighRisk 7-8MediumRisk 5-6Medium-lowRisk 4LowRisk GLOBALSNAPSHOT BEEFAND LEATHER SOY PALMOIL MAIZE COCOA COFFEE COCONUT TIMBER GUATEMALA RISKSCORE:10 HONDURAS RISKSCORE:10 PERU RISKSCORE:12 ECUADOR RISKSCORE:10 ARGENTINA RISKSCORE:10 CÔTED’IVOIRE RISKSCORE:9 NIGERIA RISKSCORE:12 BRAZIL RISKSCORE:11 CAMEROON RISKSCORE:11 COLOMBIA RISKSCORE:11 RUSSIA RISKSCORE:9 CHINA RISKSCORE:9 INDONESIA RISKSCORE:12 MALAYSIA RISKSCORE:11 VIETNAM RISKSCORE:9 PAPUANEW GUINEA RISKSCORE:9 SRILANKA RISKSCORE:9 160.617ha 1.144.307ha 40.137ha 47.563ha 24.325ha 143.688ha 365.290ha 72.231ha 109.335ha 57.469ha 1.123.351ha 425.567ha 358.709ha 23.865ha 7.018ha 22.217ha 4.757ha 59.000ha 10.359ha 2.220ha 596ha 43.319ha 21.945ha 371.908ha 1.846.518ha 489.838ha 1.395.198ha 3.633ha 164.998ha
  • 7. THEIMPACTOFDUTCHIMPORTSONNATURELOSSWORLDWIDE THEIMPACTOFDUTCHIMPORTSONNATURELOSSWORLDWIDE 12 RECOMMENDATIONS The Netherlands is signatory to several international instruments and commitments to prevent deforestation. Under the Aichi biodiversity targets it has agreed to ensure that the ‘rate of loss of all natural habitats, including forests, is at least halved and where feasible brought close to zero, and degradation and fragmentation is significantly reduced’2 . The Glasgow Leaders’ Declaration on Forests and Land Use commits to ‘conserve forests and other terrestrial ecosystems’3 . It is difficult to see how the EU’s environmental aspirations - such as ‘to have a neutral or positive environmental impact’4 - could be achieved if deforestation and conversion of all ecosystems are not eliminated from the Netherlands’ supply chains. Despite the commitments, global deforestation and biodiversity loss continues at an alarming rate and failure to fully account for the Netherlands’ deforestation footprint and associated risks overseas threatens the country’s environmental credibility and the long-term sustainability of commodity supply. Wecallon… THEGOVERNMENT → Support a strong EU regulation on deforestation-free products as an outcome of the ongoing political process by: ● Demanding that the scope of the EuropeanCommission proposal is extended beyond deforestation and forest degradation to also include the conversion of natural ecosystems such as grasslands, savannahs and wetlands and that all deforestation and conversion risk commodities, their products and by-products are included within the scope of the regulation. The scope should also include a definition that meaningfully protects forests from degradation. ● Providing a stringent due diligence system with full traceability of all commodities and products to the site of production, to ensure effective transparency of the supply chains, respect of protected areas, protection of traditional communities´ land rights and inclusion as well as active participation of all relevant stakeholders, including smallholder producers. ● Ensuring effective and timely monitoring and implementation of the new legislation through providing sufficient resources to the Dutch authorities involved in the enforcement of the new law, including through carrying out a sufficient number of checks and applying dissuasive penalties and sanctions when the law is broken. → Pushing for strong action targets, in partnership with key producer and consumer countries to protect species and habitats as part of the Post-2020 Global Biodiversity Framework under the Convention on Biological Diversity. → Taking responsibility as a major trading nation to eliminate deforestation, conversion of natural ecosystems and human rights abuses from commodity production and promote fair and transparent supply chains through bilateral and multilateral initiatives. COMPANIES → Set robust policies, time-bound commitments and implement transparent monitoring, verification and public reporting to eliminate deforestation and conversion and human rights abuses from all supply chains by 2025 at the latest, with a cut-off-date for deforestation and conversion of 2020. This includes materials that are imported to the Netherlands and then traded (after further processing or otherwise) with other countries. Policies, commitments and processes should be fully aligned with the Accountability Framework and WWF DCF Principles and Asks. → Increase transparency of supply chains and require traceability for all commodity volumes sourced from direct and indirect suppliers – ensuring that traceability cascades upstream to the origin through supplier requirements and engagement. © Maarten Zeehandelaar / Shutterstock
  • 8. THEIMPACTOFDUTCHIMPORTSONNATURELOSSWORLDWIDE THEIMPACTOFDUTCHIMPORTSONNATURELOSSWORLDWIDE → Advocate for further action among peers and wider stakeholders (e.g. government and civil society) for policies to achieve deforestation/conversion-free supply chains (e.g. supporting calls for robust environmental and social standards in trade agreements, national and EU legislation). → Collaborate with relevant stakeholders – including smallholder producers – in production landscapes and biomes to overcome systemic drivers of deforestation, conversion, and human rights abuses and to achieve long-term protection, restoration, and inclusive local development outcomes across these landscapes. FINANCIALINSTITUTIONS → Set clear and immediate policies with defined goals and pre-screening and monitoring systems in line with proposed due diligence commitments for the finance sector in the deforestation law and which align with WWF guidance on deforestation for financial institutions. These policies should ensure that no lending or investments are associated with illegal environmental or social practices, or with any deforestation or conversion of natural ecosystems, nor any further destruction of nature. Policies and systems for green- or sustainability-labelled financial products should be aligned with the EU taxonomy for sustainable activities to ensure consistency and transparency. → Assess and disclose current risk exposure through an assessment of investees and clients’ operations. Engage early with identified clients and investees to align their activities withdeforestationandconversionfreepolicy.Reportpublicly on risks, opportunities, dependencies and impacts and on the progress in addressing these; and request clients to do so. The Taskforce for Nature-related Financial Disclosures (TNFD) will provide a framework for this reporting that can ensure consistency across the industry. → Invest at scale in opportunities linked to nature positive activities through instruments such as green bonds or sustainability focused funds and enable the transition to 15 sustainable commodity production (e.g. finance sustainable agriculture practices, nature-based solutions, and support projects to improve sustainability in at risk landscapes). CITIZENS → Adopt a "planet-based diet" to reduce the demand for agricultural expansion which drives deforestation and conversion: ● Eat more plant-based and less animal-based foods. ●Buyfreshandlocalproductsaboveultra-processedfoods. ● Choose products from a more sustainable method of agriculture, with a preference for organic products. ● Bring more variation and balance to your plate, everything in moderation. → Pressure your national minister and Members of European Parliament to support strengthening of the draft EU deforestation due diligence regulation and other regulations and agreements to halt the destruction of nature and safeguard human rights. → Demand greater transparency and action from your supermarket and favourite brands to ensure that the products you enjoy are not associated with deforestation, conversion, or human rights abuses. © Laurens Verhoeven / Shutterstock
  • 9. SOY Global soy production has increased eightfold since the 1960s. This growth in production has been dominated by three countries: Argentina, Brazil and the USA, which together account for more than 80% of global production. Most soy is processed into meal and oil, with direct human consumption minimal outside East Asia. Soy meal is high protein and is widely used as livestock feed, especially for poultry and pigs but also in aquaculture and in intensive beef and dairy production systems. TheNetherlands’imports,consumption6 ,exports From 2017 to 2021, the Netherlands imported on average 8.1 million tonnes of soy per year, as soybeans, meal and oil and embedded within meat (especially poultry and pigs) and livestock products (e.g., milk and eggs). Eighty-eight to 90% of the combined volumes of soybeans, meal and oil imported by the Netherlands is used to feed livestock7 . An estimated 85% of the imported soy was re-exported, typically after processing imported beans into soy meal, but also through significant exports of biodiesel and poultry. The land required to produce this imported quantity of soy was on average 2.7 million hectares each year, an area nearly two-thirds the size of the Netherlands. This land footprint falls predominantly in Brazil (42%), the USA (28%) and Argentina (6%) and is increasing. Forty- eight percent of the land footprint comes from high and very high-risk countries, especially Brazil and Argentina. It should be noted that the expansion of soy production from the Great Plains in the USA is one of the main drivers of ecosystem conversion there, alongside maize and wheat. The greenhouse gas (GHG) emissions from land-use change resulting from the Netherlands’ soy imports are an estimated 21.9 million tonnes CO2-equivalent per year between 2017 and 2021 – equivalent to 12% of the Netherlands domestic emissions from all sources in 2019. This is by far the largest carbon footprint of any of the commodities analysed here. 16 17 AVERAGEANNUALVOLUMEOFIMPORTS % PROVENANCE VOLUME (TONNES) RISKSCORE >11VeryHighRisk 9-10HighRisk 7-8MediumRisk 5-6Medium-lowrisk 4LowRisk OTHERS UKRAINE ARGENTINA CANADA USA URUGUAY 9% 2% 250000 0 750000 1000000 1250000 1500000 1750000 2000000 2500000 500000 6% 3% 31% 2% USA 746.542ha UKRAINE 75.363ha AN ESTIMATED 88% OF THE NETHERLANDS’ USE OF SOY IS USED TO FEED LIVESTOCK5 BRAZIL 47% 2.482.192 3.776.129 282.329 465.502 187.897 165.175 745.805 © Ana Paula Rabelo / WWF-UK URUGUAY 72.534ha ARGENTINA 160.617ha CANADA 99.325ha OTHERS 414.817ha BRAZIL 1.144.307ha THEIMPACTOFDUTCHIMPORTSONNATURELOSSWORLDWIDE THEIMPACTOFDUTCHIMPORTSONNATURELOSSWORLDWIDE
  • 10. THEIMPACTOFDUTCHIMPORTSONNATURELOSSWORLDWIDE THEIMPACTOFDUTCHIMPORTSONNATURELOSSWORLDWIDE 18 19 Impactsandrisks Soybeans and derived products are estimated to be responsible for almost one third of the deforestation embodied in crop and livestock products imported into the EU8 . The expansion of soy production is also associated with widespread conversion of grassland and savannah ecosystems, including the threatened Cerrado in Brazil, the great plains in the USA, and the Gran Chaco and Pampas in Argentina9 . Soy can also act as an indirect driver of deforestation and conversion, displacing cattle ranching towards the forest frontier and driving up the price of converted land. The most prominent soy certification schemes are the Roundtable on Responsible Soy (RTRS), ProTerra and the International Sustainability and Carbon Certification (ISCC) which together certify less than 3% of global soy production. Although it can lead to positive environmental and social outcomes at farm level, certification does not prevent new deforestation and conversion in high-risk landscapes, and it isnotenoughtomaketheglobalsoymarketconversion-free. Keysourcinglandscape: theBrazilianCerrado The Cerrado is a complex ecosystem of savannahs, grasslands and forests in Brazil. Its high biodiversity and endemism give it global importance: it contains about 5% of the world’s biodiversity and roughly a third of all species found there are endemic, including the giant armadillo (Priodontes maximus), the northern tiger cat (Leopardus tigrinus), and the maned wolf (Chrysocyon brachyurus). TheCerradoranksamongstthemostthreatenedbiomes in South America10 , and more than half of the Cerrado’s original area has already been cleared of its native vegetation. Most of the conversion has occurred since the 1970s, driven principally by soy and cattle production. For example, a large expansion of soy plantations took place in Mato Grosso, with a ~60% increase in cropland area between 2006 and 201711 , and the biome now produces over half of Brazil’s entire soy crop12 . AN AREA NEARLY TWO THIRDS THE SIZE OF THE NETHERLANDS IS REQUIRED TO SUPPLY DUTCH IMPORTS OF SOY THENETHERLANDSIMPORTSOFSOYBY PRODUCTTYPE(AVERAGE,2017-21) 3% BIODIESEL 1% PORK 1% DAIRY 10% POULTRY, POULTRYMEAT ANDEGGS 52% SOYBEANS 2% OTHER (CATTLEMEAT,SOY SEED,ETC) 28% SOYMEAL 2% SOYOIL © Jaime Rojo / WWF-US THEIMPACTOFDUTCHIMPORTSONNATURELOSSWORLDWIDE
  • 11. THEIMPACTOFDUTCHIMPORTSONNATURELOSSWORLDWIDE THEIMPACTOFDUTCHIMPORTSONNATURELOSSWORLDWIDE 20 21 CompaniestradingsoyfromtheCerrado totheNetherlands Just eight companies were responsible for at least 82% of all the Netherlands’ imports from the Cerrado. They include subsidiaries of some of the largest global grain and oilseed traders, such as Cargill, Bunge, and Louis Dreyfus, as well as large Brazilian producers and traders (e.g., Amaggi). Just half of these imports (52%) were covered by corporate zero deforestation commitments. Despite this, imports of all the major traders were associated with conversion of the Cerrado. Of equal concern is that one third of the imported deforestation and conversion (34%) was from soy that is ostensibly covered by corporate zero deforestation pledges. TheNetherland’simportsfromtheCerrado 1.75 million tonnes of soy were exported directly13 from the Cerrado to the Netherlands in 2018, accounting for 45% of the Netherlands’ direct soy imports from Brazil14 . These imports are highly concentrated, with 85% coming from just two states, Mato Grosso and Goias. Both states are also centres of deforestation and conversion, together accounting for 23% of the area of habitat loss attributed to soy in Brazil. The Netherland’s direct imports of soy from the Cerrado were associated with an estimated 41,000 hectares of conversion in total between 2009-18, with resulting cumulative greenhouse gas emissions estimated at 5.95 million tonnes CO2-equivalent. AMAG GI INTERGRAIN SA UNKNOWN AGROGRAIN LTD SUCURSAL URUGUAY CARGILL AGRICOLA SA BUNGE INTERNATIONAL COMMERCE CUCURSAL URUGUAY LOUIS DREY FUS CP GLOBAL TRADING LLP CEFE TRA BV KMP KOSTER MARINE PROTEINS GAVILON KOSTER MARINE PROTEINS GMBH COFCO BRAZIL OVERSEAS LTD AGROGRAIN LTD MPH MARINE PROTEIN HOLDINGS GMBH E CO KG KOSTER MARINE PROTEINS GLENCORE AGRICULTURE KOSTER MARINE PROTEIN HOLDINGS CMBHE CO KG CJ EUROPE GMBH KVSTER MARINE PROTEINS GMBH 150 200 250 300 350 100 50 DEFORESTATION (HECTARES) COVERED BY A ZERO DEFORESTATION COMMITMENT NOT COVERED BY ZERO DEFORESTION COMMITMENT THEIMPACTOFDUTCHIMPORTSONNATURELOSSWORLDWIDE © Martin Harvey / WWF
  • 12. 22 23 PALMOIL Palm oil is the most productive oil crop per hectare and is extremely versatile: palm oil, palm kernel oil and their derivatives are estimated to be present in more than 50% of packaged supermarket products, whilst palm kernel meal is mainly used as livestock feed. Global palm oil production has increased from 15.2 million tonnes in 1995 to an estimated 62.9 million tonnes in 2017. Large-scale palm oil plantations produce approximately 60% of the world’s production with much of the rest grown by an estimated three million smallholders. Palm oil is predominantly produced by Indonesia (60% of global production) and Malaysia (24%). There has also been a marked increase in palm oil production in other parts of the world in recent years, largely in South and Central America, Thailand and western Africa. TheNetherlands’imports,consumption,exports On average 5.59 million tonnes of palm oil was imported into the Netherlands every year between 2017 and 2021, as palm oil, palm kernel oil, palm kernel meal and embedded within imported foods such as margarine and bakery products. Imports increased by around half a million tonnes during the period. Forty-one per cent of imports were consumed within the Netherlands, the remainder was exported. The land required to supply the Netherlands’ palm oil importsbetween2017and2021wasonaverage0.81million hectares per year, almost equivalent to the combined land area of North Brabant and Friesland. Indonesia (42%) and Malaysia (21%) dominate the Netherland’s palm oil footprint,butthereisanoticeablesupplyfromtheAmericas – Colombia (6%), Honduras (6%) and Guatemala (4%) in particular. All of these countries are high or very-high risk locations due to high rates of tree cover loss, a high proportion of natural forest loss, and poor rule of law and record of workers’ rights violations. As a result, at least 86% of the palm oil imported by the Netherlands was from high or very-high risk countries. The estimated GHG emissions from land use change of palm oil imported to the Netherlands were 2.85 million tonnes CO2-equivalent per year – equal to around 2% of the Netherlands domestic GHG emissions. AVERAGEANNUALVOLUMEOFIMPORTS % PROVENANCE VOLUME (TONNES) RISKSCORE >11VeryHighRisk 9-10HighRisk 7-8MediumRisk 5-6Medium-lowrisk 4LowRisk INDONESIA MALAYSIA HONDURAS GUATEMALA OTHER PAPUA NEW GUINEA COLOMBIA 9% 45% 21% 6% 4% 12% 6% INDONESIA 365.290ha PAPUA NEW GUINEA 72.231ha 250000 0 750000 1000000 1250000 1500000 1750000 2000000 2500000 500000 689.705 226.172 333.231 310.304 1.174.478 2.357.917 497.692 © Suwit Ngaokaew / Shutterstock OTHERS 113.112ha MALAYSIA 143.688ha HONDURAS 40.137ha GUATEMALA 24.325ha COLOMBIA 47.563ha THEIMPACTOFDUTCHIMPORTSONNATURELOSSWORLDWIDE THEIMPACTOFDUTCHIMPORTSONNATURELOSSWORLDWIDE
  • 13. THEIMPACTOFDUTCHIMPORTSONNATURELOSSWORLDWIDE THEIMPACTOFDUTCHIMPORTSONNATURELOSSWORLDWIDE 24 25 Impactsandrisks The expansion of palm oil cultivation has long been linked with deforestation. A study concluded that 45% of oil palm plantations studied in southeast Asia were in areas that had been forest in 198915 . A significant part of this deforestation is embedded in global trade. The economic and social impacts of palm oil are complex and contradictory. Oil palm cultivation has improved the incomes for many rural people, including smallholder farmers. It has also supported the development of rural economies and the growth of national economies of producer countries. However, oil palm production has often been associated with land use rights issues (particularly in Indonesia, but also in other producer countries), forced and child labour (especially Indonesia and Malaysia), and issues relating to the terms and conditions of labour (such as wages, health and safety and gender discrimination)16 . The main certification scheme for oil palm is the Roundtable on Sustainable Palm Oil (RSPO). RSPO certified palm oil now accounts for 19% of global production. Less than 6% of the combined palm oil, palm kernel oil, palm kernel meal, refined and embedded palm oil that is imported into the Netherlands is claimed to be RSPOcertified17 .However,severalcritiqueshavereduced confidence that RSPO certificates guarantee palm oil is produced without deforestation and exploitation. This has prompted a drive to develop a more robust standard. A major drawback in the RSPO system is the lack of controls on the uncertified portion of mass balance certified palm oil18 . This is likely to be the major source of deforestation-associated palm oil in many European markets, where certification levels are high, but are in large part mass balance. Indonesia and Malaysia have both developed national palmoilcertificationsystems.Itisimportanttonotethatthe controls on deforestation within these national standards are generally regarded as less stringent than those in the most rigorous voluntary, international schemes. Keysourcinglandscape: RiauProvince,Indonesia Indonesia produces approximately 60% of the world’s palm oil. One fifth of that comes from Riau Province on the island of Sumatra19 . The natural ecosystems of the island of Sumatra, and Riau province within it, are amongst the most biodiverse places on earth. For example, the Tesso Nilo forest in Riau has possibly the highest diversity of vascular plants of any tropical forest in the world20 . Twenty per cent of the 2475 plant and animal species recorded in Sumatra are endangered21 . Some of the more iconic species include Sumatran tiger, Sunda pangolin, sun bear, Sumatran rhinos, and Asian elephant. The rate of increase in Riau’s oil palm area and palm oil production has been astonishing: in 2008 there were 1.38 million hectares of oil palm, producing 4.8 million tonnes of crude palm oil. By 2020 this had increased to 2.74 million hectares (a quarter of the province’s land area) and 9.5 million tonnes22 . AT LEAST 86% OF THE PALM OIL IMPORTED BY THE NETHERLANDS WAS FROM COUNTRIES WITH A HIGH RISK OF DEFORESTATION AND HUMAN RIGHTS ISSUES 4% PALMKERNEL OIL 24% PALMKERNEL MEAL 45% PALMOIL 2% COSMETICANDPERSONAL HYGIENEPRODUCTS 1% FOODPRODUCTS(E.G.MARGARINE, BAKERY,CHOCOLATE) 23% BIODIESEL THENETHERLANDSIMPORTSOFPALMOILBY PRODUCTTYPE(AVERAGE,2017-21) © Harm Vriend / WWF THEIMPACTOFDUTCHIMPORTSONNATURELOSSWORLDWIDE
  • 14. THEIMPACTOFDUTCHIMPORTSONNATURELOSSWORLDWIDE THEIMPACTOFDUTCHIMPORTSONNATURELOSSWORLDWIDE IMPORTEDDEFORESTATION 26 27 The growth of the palm oil sector has made a significant contribution to Riau’s gross regional domestic product, created jobs, and provides many smallholders with an income above the minimum wage23 . However, poverty and unemployment rates have changed little, and the incidence of public health hazards such as fires (sometimes lit deliberately to clear land for new plantations) and the associated air pollution have increased24 . The expansion of oil palm plantations onto land that had customary or indigenous rights has generated conflict25 . Riaulostmorethan1.7millionhectaresofforestbetween 2011 and 2020, more than one-fifth of its forest cover in 201026 . Of particular concern in Riau is the conversion and degradation of peat swamp forest. Since 1990, 70% of Riau'speatswampforestshavebeenclearedandmostofthe remaining forests are degraded27 . Oxidation of the organic matter in drained peat swamps results in extreme carbon dioxide emissions, and drained peat is highly flammable: once alight, peat fires can burn for months or even years. A large proportion of the oil palm estates in Riau have been developed without the correct permits and are in effect illegal28 : including up to 2 million hectares of the province’s palm oil area29 . The Indonesian government has made significant efforts to verify the legality of oil palm plantations, through the introduction and subsequent revision of the Indonesian Sustainable Palm Oil (ISPO) standard. While ISPO certification can provide an indication of whether legality has been met, it does not give any indication of whether this was given to a management unit that had been or is currently deforesting or that has adopted a zero-deforestation commitment in its supply chain. TheNetherland’simportsfromRiau The only direct publicly available data tracing palm oil from Riau to the Netherlands is for 201530 . However, given the rapid expansion of oil palm cultivation in Riau, as well as the turnover in companies’ supply bases, this is considered too dated to be used for analysis. In the absence of up-to-date data tracing oil palm from Riau to the Netherlands, the supply bases of five companies with significant operations in the Netherlands were examined to assess their links to palm oil from Riau31 . Of these companies, only two, Olenex and Bunge Loders Croklaan (BLC), provide lists of mills that supply their facilities in the Netherlands. Cargill (who have major facilities in the Netherlands), and AAK (who own a palm oil refinery in Rotterdam) only supply lists of their global palm oil supply base. In the absence of greater transparency, it is therefore assumed that oil palm products originating in Riau could be part of their imports to the Netherlands. A fifth company, Viterra B.V., is headquartered in the Netherlands. They do not provide any public information on their palm oil supply base, but source large quantities of palm kernel meal (763,852 tonnes in 201932 ) which they trade as animal feed. All of the companies assessed have strong links to palm oil from Riau. The Universal Mill List (a database that attempts to list all known palm oil mills with their geographic coordinates and ownership) lists a total of 217 mills in Riau33 . All companies source from some of Riau’s mills, and in the case of Cargill and AAK, from most of them. The Roundtable on Sustainable Palm Oil (RSPO) is a voluntary standards system that is by far the most widely used in the palm oil sector. None of the companies have more than 20% of their Riau supply base certified. The low levels of certification coupled with the sheer complexity and lack of transparency of palm oil supply chains makes it almost inevitable that some material from environmentally and socially undesirable sources will enter supply chains. For example, only Bunge Loders Croklaan does not have at least one of the six mills that have been found to receive illegal fresh fruit bunches from within Tesso Nilo National Park within their supply base (see Table, below). Given that only a fraction of the fresh fruit bunch supply from within the National Park has been traced to mills, this almost certainly underestimates the supply chain linkages between Tesso Nilo and the Netherlands. Tesso Nilo National Park was established in Riau in 2004 and at the time included some of the largest contiguous areas of lowland rainforest remaining in Sumatra. An estimated 75% of the area of the national park is now occupied by oil palm plantations34 , and at least 50 mills operate in the area35 . © Aaron Gekoski / WWF-US RIAULOSTMORETHAN 1.7MILLIONHECTARESOF FORESTBETWEEN2011 AND2020,MORETHAN ONE-FIFTHOFITSFOREST COVERIN2010 THEIMPACTOFDUTCHIMPORTSONNATURELOSSWORLDWIDE
  • 15. MAIZE Maize is the third largest plant-based human food source (after wheat and rice), is a major animal feed and biofuel feedstock, and is widely processed for edible oil, refined sugars and for numerous chemical purposes. Within the EU, the predominant use of maize is animal feed, with over 57 million tonnes used as feed, which is 70% of all maize used within the bloc37 . Rotterdam hosts Europe’s largest bioethanol refinery, owned by Alco Energy, and which is dedicated to producing bioethanol from maize. The United States and China are the predominant producers of maize, accounting for 33% and 23% of global production respectively. TheNetherlands’imports,consumption,exports TheNetherlandsimportedanaverageof10.1milliontonnes of maize each year between 2017-21, as maize, as products derived from maize (e.g., vegetable oil, high fructose corn syrup) or products in which maize is embedded in production (e.g., ethyl alcohol). The country’s own production averaged 0.13 million tonnes per year over the same period – equivalent to 1.3% of imports. An average of 3.7 million tonnes were exported each year (36% of the combined domestic production plus imports). The overall trend is a decline in imports and consumption and a rise in exports. The land required to supply the Netherlands’ maize imports was on average 1.53 million hectares each year, equivalent to over one third of the Netherlands’ total land area. The Netherlands’ imports are predominantly from two geographies: Europe and the Americas. One third of the land area required to supply the Netherlands with its demand for imports was in the Ukraine (33%), with a further 11% in France and 9% in the United States. The only major supplier to the Netherlands that ranks as very high risk is Brazil (7% of total land area). The estimated GHG emissions from land use change for those imports was 6.9 million tonnes CO2-equivalent per year, equal to approximately 4% of the Netherlands’ domestic emission in 2019. 28 29 AVERAGEANNUALVOLUMEOFIMPORTS 50000 0 150000 200000 250000 300000 350000 400000 450000 100000 % PROVENANCE VOLUME (TONNES) RISKSCORE >11VeryHighRisk 9-10HighRisk 7-8MediumRisk 5-6Medium-lowrisk 4LowRisk UKRAINE 33% 3.326.126 OTHER 20% 2.038.534 POLAND 5% 547.835 ROMANIA 5% 530.314 FRANCE 15% 1.502.356 BRAZIL 6% 601.551 USA 16% 1.588.223 © Hryshchyshen Serhii / Shutterstock ROMANIA 96.098ha FRANCE 170.784ha USA 144.905ha BRAZIL 109.335ha POLAND 86.627ha UKRAINE 512.729ha OTHERS 411.617ha THEIMPACTOFDUTCHIMPORTSONNATURELOSSWORLDWIDE THEIMPACTOFDUTCHIMPORTSONNATURELOSSWORLDWIDE
  • 16. THEIMPACTOFDUTCHIMPORTSONNATURELOSSWORLDWIDE THEIMPACTOFDUTCHIMPORTSONNATURELOSSWORLDWIDE 31 Impactsandrisks Maize has drawn less scrutiny for its environmental and social impacts than many other crops. However, it is one of the main drivers of the conversion of the Great Plains ecosystem in the United States: approximately 70% of the conversion of grasslands between 2018-2019 was for three crops: maize (25%), soy (22%), and wheat (21%)38 . In Brazil, maize is often cropped alternately with soy, meaning that it has a significant role in conversion of natural ecosystems and the resulting GHG emissions from land use change in that country. There is no sector-specific certification system for maize thatoperatesatasignificantscale,norsignificantoverarching efforts to reduce the deforestation and conversion impacts of thecrop(althoughsomeof maize’sproducts,suchasethanol MAIZEISAMAJORDRIVEROFECOSYSTEM CONVERSIONANDTHERESULTINGGREENHOUSE GASEMISSIONSINBRAZILANDTHEUSA used in biofuels, are covered by The EU Renewable Energy Directive (EU RED) and certification schemes designed to verify compliance with EU RED, such as the ISCC certification system). THE LAND REQUIRED TO SUPPLY THE NETHERLANDS’ IMPORTS OF MAIZE IS OVER 1.5 MILLION HECTARES EACH YEAR AN AREA EQUIVALENT TO ONE THIRD OF THE NETHERLANDS’ LAND AREA” © Maksim Safaniuk / Shutterstock 56% MAIZE THENETHERLANDSIMPORTSOFMAIZEBY PRODUCTTYPE(AVERAGE,2017-21) 7% PROCESSED MAIZE 11% MAIZEOIL 1% MAIZE STARCH 3% MAIZE SUGARS 21% ETHYL ALCOHOL
  • 17. COCOA The majority of cocoa is produced by smallholders, with more than 90% of global cocoa production originating from farms covering only 2-5 hectares. Côte d’Ivoire and Ghana are the major global exporters, whilst the Netherlands is the world’s largest importer of cocoa beans and the world’s second largest cocoa processor39 (behind Côte d’Ivoire). The principal end use of cocoa beans is chocolate and chocolate products which are manufactured from the intermediate products of cocoa beans: cocoa paste (also known as cocoa liquor), cocoa butter and cocoa powder, with cocoa butter also used in cosmetic products: TheNetherlands’imports,consumption,exports On average between 2017 and 2021, the Netherlands imported 1.29 million tonnes of cocoa each year, in the form of cocoa beans, primary processed products of cocoa (cocoa butter, paste and powder) or as ingredients in imported food (especially chocolate). This is equivalent to 23% of global production. An estimated 1.05 million tonnes were exported each year, meaning that 81% of importswereexportedand19%ofimportswereconsumed within the Netherlands. Seventy per cent of the cocoa imported to the Netherlands is in the form of cocoa beans, whereas the Netherlands adds significant value to these imports by processing and exporting cocoa paste, butter, powder and chocolate. The land required to produce the Netherlands’ cocoa importswasonaverage2.5millionhectaresperyear,anarea 60% the size of the Netherlands. The Netherlands’ sourcing is heavily focused on West Africa: 45% of the Netherlands’ land footprint was in Côte d’Ivoire, followed by Nigeria (17%), Cameroon (14%) and Ghana (13%). Except for Ghana (medium risk), the other major sourcing countries rate as high- or very-high risk on account of very high deforestation rates,poorrecordsonworkers’rightsandlowlevelsofruleof law. Consequently, at least 80% of the Netherlands’ imports come from high- or very-high risk countries. The estimated GHG emissions attributed to the Netherlands’ cocoa land footprint between 2017 and 2021 were 11.3 million tonnes CO2-equivalent per year – equivalent to over 6% of the Netherlands’ domestic emissions in 2019. 32 33 AVERAGEANNUALVOLUMEOFIMPORTS % PROVENANCE VOLUME (TONNES) RISKSCORE >11VeryHighRisk 9-10HighRisk 7-8MediumRisk 5-6Medium-lowrisk 4LowRisk ECUADOR 57.469ha NIGERIA 425.567ha 50000 0 150000 200000 250000 300000 350000 400000 450000 100000 ECUADOR 3% 32.526 GHANA 15% 191.825 SIERRA LEONE 2% 20.754 NIGERIA 10% 132.617 CÔTE D’IVOIRE 47% 609.263 OTHERS 10% 134.516 © Nutt / Shutterstock OTHERS 183.624ha CAMEROON 358.709ha CÔTED’IVOIRE 1.123.351ha GHANA 318.612ha CAMEROON 13% 167.881 THEIMPACTOFDUTCHIMPORTSONNATURELOSSWORLDWIDE THEIMPACTOFDUTCHIMPORTSONNATURELOSSWORLDWIDE
  • 18. THEIMPACTOFDUTCHIMPORTSONNATURELOSSWORLDWIDE THEIMPACTOFDUTCHIMPORTSONNATURELOSSWORLDWIDE © WWF / Jaap van der Waarde Impactsandrisks Despitethepotentialforcocoatobegrowninagroforestry systems, cocoa production is driving deforestation in major producing countries. Global forest loss driven by cocoa expansion is estimated to be around 2-3 million hectares from 1998-2008, accounting for roughly 1% of all forest loss during this period40 . Deforestation in the sector is in part driven by low investment in smallholder farmers (financially, and in terms of skills and management training), and in part because aging trees have lower yields, which means that farmers tend to expand production by cutting down trees for new cocoa fields. Cocoa cultivation provides a livelihood for millions of smallholders in countries such as Côte d’Ivoire, Indonesia, Ghana, Cameroon and Nigeria. However, cocoa farmers are often living in poverty and receive a small percentage of overall cocoa price – between 3 and 5% of the value of a chocolate bar. Child and forced labour are endemic in the sector, particularly in some West African countries. It is estimated that a total of 1.56 million children – the majority of who are exposed to hazardous working conditions41 – worked illegally in the cocoa sector in Ghana and Côte d’Ivoire during the 2018- 19 season42 . The incidence of child labour is increasing. There are numerous certification schemes aimed at mandating minimum sustainability standards for cocoa producers. These include voluntary standards schemes such as Rainforest Alliance, Fairtrade and organic. 34 35 The global area of cocoa certified by one of more of the voluntary standards schemes reaches 25% of the global cocoa area43 . The above schemes provide varying levels of protection against deforestation. By contrast, Fairtrade is the only certification scheme that has a minimum price for cocoa as well as a fixed premium of US $400 per tonne of cocoa. This helps provide farmers with greater financial security during periods of price volatility and decline on the world market for cocoa. In addition, many of the major manufacturers and traders run their own proprietary sustainability schemes. The World Cocoa Foundation44 is a grouping of cocoa industry actors that was established to improve environmental and social sustainability within the sector. It created the Cocoa and Forests Initiative (CFI) in 2017, with the aim of ending deforestation and restoring forests in Côte d’Ivoire and Ghana. The group includes the governments of those two countries, along with 35 leading cocoa and chocolate companies45 . The Dutch cocoa sector increased its use of sustainable cocoa from 21% to 30% between 2014 and 201646 . The Dutch Initiative on Sustainable Cocoa – a collaboration of business and civil society – aims to end deforestation associated with Dutch cocoa sourcing by 202547 . The above suggests increasing efforts by cocoa traders and chocolate companies, but these have so far failed to drive meaningful change in the industry, as cocoa production continues to be linked to deforestation, child and forced labour, and farmer poverty. 70% COCOABEANS THENETHERLANDSIMPORTSOFCOCOABYPRODUCTTYPE(2017-21) 7% COCOABUTTER 11% COCOAPASTE 5% COCOAPOWDER 6% CHOCOLATEANDPRODUCTS CONTAININGCHOCOLATE 1% OTHER Keysourcingcountry: Cameroon Cameroon is the fourth largest cocoa producer in West Africa and fifth globally. The area of cocoa harvested in Cameroonhasalmostdoubledsincetheearly1960s,from around 380,000 hectares in the early 1960s to nearly 700,000 in 2020, with production of cocoa increasing nearly four-fold over the same period. The country has ambitions to more than double cocoa production in the next decade48 . Smallholders account for 89% of production, but many receive an income from cocoa that is less than the national minimum wage49 . Although the government of Cameroon has made advances in eliminating the worst forms of child labour, it is still prevalent within the cocoa sector50 . THEIMPACTOFDUTCHIMPORTSONNATURELOSSWORLDWIDE
  • 19. THEIMPACTOFDUTCHIMPORTSONNATURELOSSWORLDWIDE THEIMPACTOFDUTCHIMPORTSONNATURELOSSWORLDWIDE TheNetherland’simportsfromCameroon The EU is by far the biggest consumer of cocoa, responsible for 60% of global imports, with the Netherlands alone importing 23% of the world’s cocoa production. Amongst these imports are an average of 168,000 tonnes per year from Cameroon, equivalent to more than half of Cameroon’s national production53 . The Netherlands therefore has a disproportionate influence on, and responsibility for, the environmental and social issues associated with cocoa production in the country. Some of the largest cocoa traders globally, including ADM Cocoa, Cargill and Olam have cocoa operations in the Netherlands, along with Dutch companies that are part of the Swiss headquartered ECOM group, including Dutch Cocoa, Daarnhouwer and Theobroma54 . Cargill and Olam are globally the second and third largest traders and grinders of cocoa beans55 . The forest zones of the Centre and South West Regions are the main cocoa producing areas, with some production also occurring in the mangrove and savannah ecosystems. Cocoa is one of the major drivers of deforestation and biodiversity loss in Cameroon, which is one of the most biodiverse countries in Africa. The country includes part of the critical cross-border Tri-National Dja- Odzala-Minkébé (TRIDOM) forest, which it shares with the Republic of Congo and Gabon, and which covers 178,000 square kilometres. The area provides a habitat for elephants, chimpanzees and western lowland gorillas but is threatened by illegal logging, large-scale mining, poaching, and forest conversion for commodity crops51 . A roadmap towards deforestation-free cocoa was signed by the Government of Cameroon, international development partners, businesses and civil society in January 2021. Although too early to tell whether it will be effective, the agreement aims to decouple cocoa production from deforestation by driving more sustainable production and forest protection while ensuring social inclusion52 . The cocoa sector has little supply chain transparency, with pledges to improve transparency as yet largely unfulfilled56 . Imports of cocoa from Cameroon to the Netherlands are no different, and so it is not possible to directly match imports as a whole or those of individual companies to specific incidents of deforestation. Given the disproportionate role that the Netherlands plays in exporting Cameroon’s cocoa, and the absence of supply chain transparency, it appears likely that some of the Netherlands’ imports are associated with deforestation, child labour, and other environmental and social harms. THEIMPACTOFDUTCHIMPORTSONNATURELOSSWORLDWIDE 36 37 ATLEAST80%OFTHE NETHERLANDSIMPORTS OFCOCOACOMEFROM COUNTRIESWITHAHIGH ORVERY-HIGHRISKOF DEFORESTATIONAND HUMANRIGHTSISSUES © Christiaan van der Hoeven / WWF-Netherlands
  • 20. COFFEE Brazil and Vietnam are the world’s largest coffee producers,witha32%and16%shareofglobalproduction respectively, whilst the United States, Germany, Italy, Japan, and Spain rank as the main importing countries58 . The primary end use for coffee beans is for the coffee beverage, though there is a small but growing use of coffee extract in food products and coffee bean extract for food supplements. Green coffee beans purchased for coffee production are first tasted for quality before they are roasted to either a light, medium, or dark roast level. The roasted coffee beans are either sold as whole beans to consumers of ground to varying levels of coarseness. TheNetherlands’imports,consumption,exports On average between 2017 and 2021, the Netherlands imported0.29milliontonnesofcoffee,intheformofcoffee beans, roasted and/or decaffeinated coffee, or extracts and food preparations with coffee as a major ingredient. This is equivalent to 2.9% of global production. An estimated 0.15 million tonnes were exported each year, meaning that an estimated 47% of imports were consumed. Most of the coffee imported into the Netherlands is in the form of coffee beans or roasted coffee. The largest exports are of roasted coffee: the Netherlands is the third largest exporter of roasted coffee in the world, principally supplying European countries. Unlike most of the other commodities assessed in this report, a large volume of coffee imports arrives in the Netherlands via third-party countries:40%viaBelgiumandafurther23%viaGermany. The land required to produce the Netherlands’ coffee imports was on average 203,000 hectares per year – equivalent to about 2% of the world’s land footprint for coffee and almost the same area as the Dutch province of Limburg. Apart from Vietnam (20% of the import land footprint), the Netherlands’ sourcing is heavily focused on South and Central America: Brazil (35%), Honduras (9%), Colombia (7%) and Guatemala (2%). All of these countries rank as high- or very high risk as a result of rapid deforestation, poorlabourrightsandlowruleoflawscores.Consequently, at least 69% of the Netherlands’ imports come from high- or very-high risk countries (the remainder is the portion that has not been assigned a provenance). 38 39 AVERAGEANNUALVOLUMEOFIMPORTS 10000 0 30000 40000 50000 60000 70000 80000 90000 20000 % PROVENANCE VOLUME (TONNES) RISKSCORE >11VeryHighRisk 9-10HighRisk 7-8MediumRisk 5-6Medium-lowrisk 4LowRisk PERU 4.757ha BRAZIL 35% 102.399 COLOMBIA 7% 21.587 PERU 1% 4.003 GUATEMALA 2% 4.999 HONDURAS 9% 26.594 VIETNAM 20% 58.247 OTHER 25% 73.038 © PixieMe / Shutterstock OTHERS 63.721ha COLOMBIA 22.217ha HONDURAS 23.865ha GUATEMALA 7.018ha BRAZIL 59.000ha VIETNAM 21.945ha THEIMPACTOFDUTCHIMPORTSONNATURELOSSWORLDWIDE THEIMPACTOFDUTCHIMPORTSONNATURELOSSWORLDWIDE
  • 21. THEIMPACTOFDUTCHIMPORTSONNATURELOSSWORLDWIDE THEIMPACTOFDUTCHIMPORTSONNATURELOSSWORLDWIDE The estimated GHG emissions attributed to the Netherlands’ coffee land footprint between 2017 and 2021 were around 0.198 million tonnes CO2-equivalent per year. Impactsandrisks Coffee is traditionally grown under shade trees, which provides a multitude of ecosystem services, including pest control, carbon sequestration, watershed protection, and a habitat for wildlife. However, in the 1970s, a movement began in Central America towards open-sun coffee production systems to increase yields. Accompanying this move away from shade management was an uptake in the use of agrochemical inputs to combat pests and diseases. Recent analysis of land use data indicates that many countries where coffee production is rapidly expanding (e.g. Vietnam, Indonesia, Ethiopia, and Peru) create new land for coffee through deforestation, using lightly shaded or full-sun production systems59 . There are significant economic and social issues surrounding coffee production. World coffee prices have fallen by two-thirds since the early 1980s, and the earnings of coffee farmers have halved during that time, and it is becoming questionable whether coffee is still a profitable crop. Most of the value produced by coffee goes to major retailers and brands rather than the farmers, who receive only 7–10% of the retail price of coffee60 . Given the pressure to cut economic costs, there are increasing reports of exploitation in coffee production. This includes accounts of debt bondage, child labour, exposure to deadly pesticides, a lack of protective equipment, especially in Brazil61 . In 2016, two of the largest coffee companies, Nestlé and the Dutch company JDE Peet’s, admitted that the coffee they sourced from Brazil may come from plantations where forced labour is practiced62 . While the two companies claim not to purchase directly from plantations with a history of labour violations, they do purchase from exporters and middlemen who might be sourcing the beans from these plantations. Climate change poses a substantial risk to coffee production. Changes in temperature and rainfall will both increase pressure from pests and diseases and decrease the area suitable for coffee cultivation, particularly in the largest coffee producing countries, Brazil and Vietnam63 . Certification of coffee is well-established and growing, providing assurance against some forms of deforestation, with variations between schemes. The most common standards are the 4C code, Fairtrade, Rainforest Alliance, and organic which together covered an estimated 22% of the global coffee area in 2017. Private corporations, including Nespresso and Starbucks, also have their own standards and global initiatives. IMPORTEDDEFORESTATION 40 41 © WWF-Indonesia / Natalie J. Tangkepayung THENETHERLANDS IMPORTSOFCOFFEEBY PRODUCTTYPE(AVERAGE,2015-19) 29% ROASTED COFFEE 3% OTHER 63% UNROASTED COFFEE THEIMPACTSOFCLIMATE CHANGEANDTHELOW PRICESPAIDTOFARMERS FORCOFFEE,ARELIKELY TOMAKECOFFEEGROWING UNPROFITABLEFORMANY SMALLHOLDERS 5% UNROASTED DECAFFINATED COFFEE 1% ROASTED DECAFFINATED COFFEE
  • 22. COCONUT Coconut is used for a large variety of end products: fresh coconut and coconut water are major uses in producer countries, with desiccated coconut and coconut milk the other uses for human consumption; coconut oil and its derivatives are predominantly used in personal care products; and coir (the fibres from the coconut husk) is used to make carpets, twine and matting. Indonesia(28%),thePhilippines(24%)andIndia(23%) share three quarters of global production, with China (29% of global trade), Thailand (16%) and Malaysia (13%) the largest importers. Within the EU, the Netherlands is the predominant importer, importing almost twice the quantity of the next largest importer, Germany64 . TheNetherlands’imports,consumption,exports On average between 2017 and 2021, the Netherlands imported 2.1 million tonnes of coconut equivalent, predominantly in the form of crude coconut oil. This is approximately 3.5% of global coconut production. An estimated 1.3 million tonnes were exported each year, meaning that an estimated 37% of imports were consumed within the Netherlands. Most of the coconut imported into the Netherlands is in the form of crude coconut oil, which is refined and used in the food and cosmetics sectors. By contrast, exports are dominated by refined coconut oil (which is largely used in food, cosmetics, personal hygiene products). The land required to produce the Netherlands’ coconut imports was on average 0.5 million hectares per year – equivalent to about 4.3% of the world’s land footprint for coconut and an area the size of the Dutch province of Gelderland. The Netherlands’ sourcing is overwhelmingly from the Philippines (87% of the land area), Indonesia (9%) and Côte d’Ivoire (2%). The Philippines is ranked as medium risk country: rates of tree cover loss and natural forest loss are relatively low, although it ranks poorly on rule of law and labour rights. The other main sourcing countries rate as high or very- high risk. As a consequence, 11% of the Netherland’s coconut sourcing is from high or very-high risk countries. The estimated GHG emissions attributed to the Netherlands’ cocoa land footprint between 2017 and 2021 were around 0.43 million tonnes CO2-equivalent per year. 42 43 AVERAGEANNUALVOLUMEOFIMPORTS 25000 0 75000 100000 125000 150000 200000 225000 250000 50000 % PROVENANCE AVERAGEANNUALVOLUMEOFIMPORTS VOLUME (TONNES) RISKSCORE >11VeryHighRisk 9-10HighRisk 7-8MediumRisk 5-6Medium-lowrisk 4LowRisk CÔTE D'IVOIRE 1% 27.497 SRI LANKA 1% 11.214 MALAYSIA 0% 4.490 PHILIPPINES 82% 1.748.815 INDONESIA 13% 281.416 OTHERS 3% 55.960 © ChenPG / AdobeStock OTHERS 7.920ha PHILIPPINES 438.079ha INDONESIA 43.319ha SRILANKA 2.220ha MALAYSIA 596ha CÔTED’IVOIRE 10.359ha THEIMPACTOFDUTCHIMPORTSONNATURELOSSWORLDWIDE THEIMPACTOFDUTCHIMPORTSONNATURELOSSWORLDWIDE
  • 23. THEIMPACTOFDUTCHIMPORTSONNATURELOSSWORLDWIDE THEIMPACTOFDUTCHIMPORTSONNATURELOSSWORLDWIDE Impactsandrisks A recent paper suggests that coconut oil has the largest impact on biodiversity of any vegetable oil65 . The analysis has been criticised, as the methodology is biased towards small island nations that have high levels of endemic and threatened species, but which produce little coconut oil for the international market66 , but the central point – that the expansion of coconut production is not without ecological consequence – remains valid. Incomes from coconut farming are very low. For example, the majority of the 3.5 million coconut farmers IMPORTEDDEFORESTATION 44 45 THENETHERLANDS IMPORTS OFCOCONUTBY PRODUCTTYPE (AVERAGE,2017-21) 87% CRUDECOCONUTOIL ATLEAST11%OFTHE NETHERLANDSIMPORTS OFCOCONUTCOMEFROM COUNTRIESWITHAHIGH ORVERY-HIGHRISKOF DEFORESTATIONAND HUMANRIGHTSISSUES © xuanhuongho / AdobeStock in the Philippines live below the poverty line, earning less than $1 per day67 . Low incomes also encourage the use of unpaid or child labour and coconut production is listed on the US Department of Labour’s list of goods produced by child labour or forced labour in the Philippines68 . There is so far very limited certification of coconuts, meaning that the overwhelming majority of the Netherlands’importsarenotcoveredbyanyindependently verified assurance of being deforestation free. THELANDAREAREQUIREDTOSUPPLYTHE NETHERLANDSIMPORTSOFCOCONUTEACH YEARISEQUIVALENTTOANAREATHESIZEOF THEDUTCHPROVINCEOFGELDERLAND 2% OTHER(EGEDIBLE COCONUTS,COIR) 3% REFINED COCONUTOIL 1% COSMETICAND PERSONALHYGIENE PRODUCTS 7% DESSICATED COCONUT
  • 24. The world’s land footprint for beef & leather (i.e. the grazing area dedicated for cattle globally, excluding dairy cattle) encompasses an estimated 1.6 billion hectares69 – an more than one and a half times the area of the European continent. The majority of beef is purchased and consumed as fresh or frozen cuts, e.g. steaks, mince and roasting joints. However – like most meats – it is also found in a range of food products, e.g. burgers and ready meals. Nearly half of all bovine leather is used to manufacture shoes, with a further 17% used in automobile seats. Furniture upholstery, clothes, and various leather goods make up the rest. TheNetherlands’imports,consumption,exports The Netherlands imported an average of 382,000 tonnes of beef (Carcass Weight Equivalent) each year between 2017-21. The majority is imported in the form of fresh or chilled beef (55%) and live animals (32%). Over the same period, the Netherlands imported 110,000 tonnes of bovine leather, predominantly as raw hides (64%) and manufactured leather cases and bags (20%). This compares with an average annual domestic production of 290,000 tonnes beef and 38,000 tonnes leather over the same period. Exports were on average 399,000 tonnes of beef per year and 123,000 tonnes of leather. Consumption averaged 274,000 tonnes of beef per year and 26,000 tonnes of leather. The Netherlands’ external footprint for beef & leather is equal 3.9 million hectares each year, an area equivalent to nearly 90% of the Netherlands. The majority of this, 78% of the land area, was for beef. The EU dominates the Netherlands imports of beef, with 75% of the quantity coming from Belgium, Poland, Germany, France, Ireland and Italy alone. A small proportion comes from South American countries including Brazil (4%), Uruguay (2%) and Argentina (3%), but as these countries have comparatively extensive beef systems, they dominate the land 46 47 BEEFAND LEATHER AVERAGEANNUALVOLUMEOFIMPORTS © Serhii Opikanets / Shutterstock 100000 0 300000 400000 500000 600000 700000 800000 900000 200000 % PROVENANCE VOLUME (TONNES) RISKSCORE >11VeryHighRisk 9-10HighRisk 7-8MediumRisk 5-6Medium-lowrisk 4LowRisk BELGIUM 17% POLAND 13% GERMANY 12% FRANCE 11% IRELAND 9% ITALY 7% AUSTRIA 6% BRAZIL 4% ARGENTINA 3% SPAIN 3% UNITED KINGDOM 3% URUGUAY 2% OTHER 11% GERMANY 31% BELGIUM 23% CHINA 11% ITALY 7% POLAND 4% VIETNAM 4% UNITED KINGDOM 3% INDIA 3% CZECHIA 2% FRANCE 2% OTHER 11% 42.973 8.000 33.993 25.087 11.714 7.290 4.480 3.942 3.815 2.958 2.492 2.086 12.031 13.129 10.892 9.978 13.773 21.487 25.993 34.563 40.768 44.618 50.372 66.090 BEEF LEATHER OTHERS 371.238ha INDIA 2.286ha VIETNAM 3.633ha CHINA 164.998ha ARGENTINA 1.395.198ha URUGUAY 183.503ha BRAZIL 489.838ha GERMANY 289.749ha POLAND 72.991ha THEIMPACTOFDUTCHIMPORTSONNATURELOSSWORLDWIDE THEIMPACTOFDUTCHIMPORTSONNATURELOSSWORLDWIDE IRELAND 185.944ha FRANCE 86.091ha SPAIN 113.569ha ITALY 263.453ha CZECHIA 7.195ha BELGIUM 42.462ha UNITEDKINDOM 112.443ha
  • 25. THEIMPACTOFDUTCHIMPORTSONNATURELOSSWORLDWIDE THEIMPACTOFDUTCHIMPORTSONNATURELOSSWORLDWIDE IMPORTEDDEFORESTATION 48 49 49 © Jason Houston / WWF-US 42%OFTHELANDAREAOFTHE NETHERLANDS’IMPORTSOF BEEF–BUTONLYAROUND8% OFTHEQUANTITYOFIMPORTS –COMESFROMHIGHANDVERY- HIGHRISKCOUNTRIES THEAREAOFLANDREQUIREDTO SUPPLYTHENETHERLANDS’IMPORTSOF BEEFANDLEATHERISEQUIVALENTTO 90%OFTHENETHERLANDS’LANDAREA THENETHERLANDSIMPORTSOFBEEFANDLEATHER PRODUCTTYPE(AVERAGE,2017-21) 55% FRESHOR CHILLEDMEAT 32% LIVECATTLE 9% FROZENMEAT 4% PRESERVEDMEAT ANDPREPARATIONS CONTAININGMEAT are rated high- and very-high risk respectively, resulting in 42% of the external land footprint of the Netherlands’ imports being from high- or very high risk countries. Note that intensive livestock systems have other risks associated with them, including the import of feed (see soy and maize, above) and local nitrogen pollution. Whilst imports of leather are also dominated by the EU, China and Vietnam are also significant sourcing countries. China dominates the land area required, due to its low productivity per hectare, and is largely responsible for 44% of the external land footprint of the Netherlands’ imports being from high- or very high risk countries. It was not possible to quantify the GHG emissions of the beef and leather imported by the Netherlands (see Methods,below).However,beefcattleareoneofthemajor drivers of deforestation worldwide – in fact some research indicates it as the single largest cause of deforestation and conversion70 – and hence the greenhouse gas emissions from land use change associated with the Netherlands’ imports are likely to be significant. Impactsandrisks Cattle production is the dominant agricultural driver of deforestation globally, accounting for more than 45 million hectares of deforestation between 2001-201571 . It is the predominant land use following deforestation in several WWF Priority Places such as the Amazon, Cerrado and Pantanal. Pasture can also be an intermediate step between conversion and the final land use (e.g. soy). According to the International Labour Organisation, some 62% of slave labour in Brazil is employed in livestock farming-related businesses72 . There are limited options available for companies and consumers wishing to purchase sustainable beef and leather. The Sustainable Agriculture Network (SAN) Standard for Sustainable Cattle Production Systems (Rainforest Alliance) has had very limited uptake, and the Global Roundtable for Sustainable Beef have developed a standard but the process of verification and levels of uptake are unclear73 . 1% LEATHER(PREPARED TOVARYINGDEGREES) 5% FOOTWEAR 7% LEATHERSEATS 21% LEATHERBAGS, CASESAND CLOTHING 1% OTHER(E.G.,SADDLERY) 65% HIDES
  • 26. TIMBER There are two major production systems for timber: plantations and natural forest. India, the USA, Brazil and the Russian Federation are the largest producers of wood globally, with the USA and the Russian Federation exporting the greatest quantity in terms of weight (and noting the majority of production in India is used domestically as fuel). The USA and China dominate global imports74 . Wood is extremely versatile, and has a wide variety of end uses, including fuel, construction, furniture, various manufactured items (e.g., musical instruments and kitchenware), industrial processes (e.g. electricity generation), and paper and card. Note that the analysis presented below does not include pulp and paper, as this has separate supply chains. TheNetherlands’imports,consumption,exports The Netherlands’ external timber footprint, though only 0.3% of the world’s timber footprint, is the largest in absolute area of all the commodities studied in this report, averaging 5.1 million hectares each year. This is 1.2 times larger than the land area of the Netherlands, and it is increasing. On average, 22.2 million m3 of wood raw material equivalent (WRME) were imported to the Netherlands every year between 2017 and 2021. The Netherlands produced an average of 7.1 million m3 each year over the same period. 15.5 million m3 was exported each year, meaning that on average 62.5% of all imports and domestic production were consumed within the Netherlands. The largest proportion of timber imported to the Netherlands consisted of sawn wood (22%), fibreboard (17%) and fuel wood (11%). Fuelwood has shown a dramatic increase over the period, from 0.87 million m3 in 2017 to over 4.5 million m3 in 2021 and is largely responsible for the increased imports in timber over the period. Most of the Netherlands’ imports are from the EU, with only China, the Russian Federation (both high risk countries) and the USA being the only non-EU countries to supply at least 2% of the Netherland’ imports. EU countries have generally low deforestation rates, good rule of law and labour rights. Nonetheless, at least 30% 50 51 AVERAGEANNUALVOLUMEOFIMPORTS 500000 0 1500000 2000000 2500000 3000000 3500000 4000000 4500000 1000000 % PROVENANCE VOLUME (M 3 ) RISKSCORE >11VeryHighRisk 9-10HighRisk 7-8MediumRisk 5-6Medium-lowrisk 4LowRisk ITALY FRANCE BELGIUM USA GERMANY 2% 9% 4% 3% 11% SWEDEN 4% 3% 4% CHINA 6% POLAND 19% OTHER 23% RUSSIA 11% FINLAND LATVIA 771.279 934.751 1.994.303 2.430.459 993.087 494.825 654.828978.110 2.400.474 1.338.867 4.161.090 5.087.950 © Dorelys Smits/UnSplash OTHERS 1.217.384ha CHINA 371.908ha USA 265.958ha SWEDEN 300.935ha LATVIA 148.198ha FINLAND 148.824ha GERMANY 217.005ha FRANCE 362.601ha POLAND 520.136ha ITALY 154.633ha BELGIUM 121.396ha RUSSIA 1.846.518ha THEIMPACTOFDUTCHIMPORTSONNATURELOSSWORLDWIDE
  • 27. THEIMPACTOFDUTCHIMPORTSONNATURELOSSWORLDWIDE THEIMPACTOFDUTCHIMPORTSONNATURELOSSWORLDWIDE IMPORTEDDEFORESTATION 52 53 of the Netherlands’ land footprint for timber imports is from high and very-high risk countries. In practice, the proportion is likely to be significantly higher than this: the Netherlands imports timber and timber products from 152 countries, and a total of 23% of the land footprint is from countries that supplied less than 2% of the total and hence were not assessed in this study. Impactsandrisks The trade in timber and timber products has long been linked with deforestation and forest degradation75 . The most obvious direct impact of the timber industry is when natural and semi-natural forest is replaced by tree plantation monocultures. Moreover, timber harvesting can play an indirect role in deforestation, with logging access roads opening up areas of forest to ranchers and farmers. Within the forestry sector, there are two main forest certification schemes covering timber: the Forest Stewardship Council (FSC) and the Programme for the Endorsement of Forest Certification (PEFC). By mid- 2013, these initiatives had together certified 23% of the world’s managed forests76 . Canada, the United States, Russia, Finland and Sweden were the top five countries in terms of certified forest area. © Mac Stone / WWF-US 53 THENETHERLANDS IMPORTSOFTIMBERBY PRODUCTTYPE(AVERAGE,2017-21) The FSC and PEFC standards have broadly similar requirements, although the FSC is regarded as having more rigorous requirements on some key outcome requirements (e.g. maintenance of High Conservation Values, workers’ rights) and process aspects (e.g. multi- stakeholder engagement and formulation of audit teams)77 . The FSC also has a greater certified area in the tropics than PEFC and is supported by leading environmental NGOs. The FSC Principles and Criteria exclude certification of plantations established on areas converted from natural forest after November 1994, unless the plantation is a small part of the certified area, or if the management organisation was not responsible for the conversion. The PEFC standard is broadly similar, but with a cut-off date of 2010. A recent survey of Netherlands Timber Trade Association (VVNH) members estimated that nearly 99% of softwood and 67% of hardwood (including tropical species) imported into the Netherlands in 2020 was FSC or PEFC certified78 . The survey covered 2 million m3 of timber, which is less than 10% of total imports, and it is not clear whether the survey results are applicable to the entirety of the Netherlands’ imports. THEAREAOFLAND REQUIREDTOSUPPLYTHE NETHERLANDS’IMPORTS OFTIMBERISLARGERTHAN THELANDAREAOFTHE NETHERLANDS 6% PACKINGCASESANDBOXES 9% OTHER 7% FURNITURE 2% VENEER 25% FIBREBOARD ANDPARTICLEBOARD 5% PLYWOOD 8% WOODINTHEROUGH 11% FUELWOOD 25% SAWNWOOD 2% CHARCOAL
  • 28. THEIMPACTOFDUTCHIMPORTSONNATURELOSSWORLDWIDE THEIMPACTOFDUTCHIMPORTSONNATURELOSSWORLDWIDE Commodityfootprinting Import data from UN Comtrade79 was used to estimate the net weight of imports for the period from 2017 to 2021. We examined imports of raw materials (e.g. palm oil, soymeal, cocoa beans), commodities as components or ingredients of imported manufactured goods (e.g. palm oil in margarine), and commodities embedded within imported products as part of the upstream production process (e.g. soymeal used in chicken feed embedded in imported chicken). Where a commodity is imported as an ingredient or is embedded, the weight of imported goods was adjusted to an estimated weight of the commodity using a mid-range conversion factor derived from published literature. As many commodities are used in thousands of different products, analysis was confined to those product categories that are cited in the literature as being major uses of the commodity. The estimates provided are therefore conservative. Provenanceanalysis ItisnotstraightforwardtoworkoutwheretheNetherland’s imported commodities were originally grown. The first step was to take the direct country of origin for imports to the Netherlands as reported in UN Comtrade data. The Netherlands’ imports from these exporter countries were then assumed to come from the countries that supplied that country in the same proportion plus domestic production (if any). For example, imports of cocoa into the Netherlands from Germany (which does not grow any cocoa domestically) were re-assigned to the countries supplying cocoa to Germany, in the same proportions. The sourcing provenance of all countries responsible for at least 2% of the Netherlands’ imports of each commodity were assessed. Landfootprints For the majority of commodities, estimating the land area required to produce the quantities of commodities imported by the Netherlands was relatively straightforward, as yield data is readily available for each country in each year of production from FAO STAT. OVERVIEWOFMETHODS 54 55 For crops that produce co-products yield was allocated to the co-products. This applied to soy (soymeal and soy oil), cocoa (butter, paste and powder), palm oil (palm oil, palm kernel oil and palm kernel meal). We allocated land use to co-product fractions. In this case, imported goods are first assigned to the fraction of the commodity they contain, and then yield is assigned to that fraction in the same proportion that the fraction is derived from the harvested crop. No yield data is available for beef & leather and timber. For beef and leather, we adapted a method used by de Ruiter et al. (2017)80 that allocates total country pastureland to different grazing animals based on the relative feed conversion efficiencies and overall sector production. The area assigned to beef cattle is then divided by the national production of beef and leather to give a hectare per tonne estimate. Given that beef cattle have two products (i.e. meat and leather), we allocated a share of the land footprint to beef and leather co- products on the basis of their mass. The Netherlands’s imports of timber were converted from tonnes of imports to wood raw material equivalent (WRME). The area of forest required to produce the total imported volume was estimated by dividing the total WRME by the producer country’s Net Annual Increment81 EstimationofGHGfromlandusechange The Land Use Change Impact Tool82 was used to estimate commodity specific per-hectare CO2e emissions for soy, cocoa, coffee, coconut, palm oil and maize. The tool allows emissions from land use change to be assessed when the country of production is known, but the exact parcel of land used to produce the crop is unknown. This matches the level of detail of our provenance calculations, which is determined by the available data. The associated emissions per hectare are then calculated based on methods consistent with the Intergovernmental Panel on Climate Change (IPCC) and the PAS 2050-1 framework, in including ‘amortisation’ so that the total emissions from the 20-year period of the land-use change are apportioned equally over the 20 years (see tool’s methodology for further details). The commodity-specific Full details of the method are available in the accompanying technical report ‘Risky Business Netherlands: deforestation, conversion and social risks in the Netherlands’ commodity supply chains ‘ per-hectare CO2e emissions was then multiplied by the Netherlands’ land footprint per commodity to estimate the GHG emissions associated with LUC per country, for each crop in each year. The Land Use Change Impact Tool is one of the most comprehensive tools for estimating GHG emissions from direct LUC with global coverage. However, there are still significant data gaps. For example, there is no data available for forest products nor livestock. Therefore, no GHG emissions estimates were made for beef & leather, or for timber products. Environmentalandsocialriskrating Having derived a minimum estimate of the provenance of the Netherlands’ imports and the associated land footprint, this study explored the potential risks linked with imports from these countries. Only countries that account for at least 2% of the volume imported into the Netherlands were included. We used four indicators to explore deforestation and key social and governance risks (see table bottom page). For each producer country the criteria were scored and summed to give a total out of 12. These were then allocated to five categories: very high risk (total score of 11 or more), high risk (9-10), medium risk (7-8), medium- low risk (5-6) and low risk (4 or less). Being based on national-level datasets, these represent the generic level of risk, not the risk specific to a commodity or the part of the country it may be sourced from. It also represents an unmitigated level of risk, i.e. before any action may have been taken to ensure that production is not linked to deforestation or social challenges. The approach used provides some estimates of the risks to ecosystems with at least 10% tree cover, therefore not only considering forests but also other ecosystems with partial tree cover, including most of the Cerrado. However, we were unable to assess risks due to conversion of grasslands or other ecosystems with a lower tree density as there are no global datasets for these ecosystems: the text highlights where the risks of conversion of ecosystems with low or no tree cover are associated with a particular commodity. It is important to recognise that the limited traceability of supply chains means that most of the Netherlands’ imports can not be traced back to specific sub-national locations or risks. Despite its limitations, the risk-based approach highlights the need for Dutch actors to manage their potential risk of creating negative impacts overseas. Risk Factor Description Rationale High Risk Medium Risk Low Risk Deforestation extent Deforestation rate Labour rights Rude of Law Area of forest cover loss 2017-21 (Global Forest Watch) % net natural forest loss 2010-20 (FAO) Labour standards score (ITUC) Rule of Law score (World Bank) Amount of deforestation Rate of deforestation Reported incidence of major labour rights violations Perception of how good laws are and how well they are implemented >1 Mha >1% 4 - 5 <-0.3 0.5 Mha-1 M ha 0% - 1% 2 - 3 0.3 - 1 < 0.5 Mha < 0% 1 >1
  • 29. THEIMPACTOFDUTCHIMPORTSONNATURELOSSWORLDWIDE THEIMPACTOFDUTCHIMPORTSONNATURELOSSWORLDWIDE 56 57 REFERENCES 1 Global Witness (2021). Last line of defence: the industries causing the climate crisis and attacks against land and environmental defenders. 2 Convention on Biological Diversity, 2018. Aichi Biodiversity Targets. https://www.cbd.int/sp/targets/ 3 UN Climate Change Conference UK 2021 (November 2021). Glasgow leaders’ declaration on forests and land use. https://ukcop26.org/glasgow-leaders- declaration-on-forests-and-land-use/ 4 European Commission (2020). Communication from the Commission: A Farm to Fork Strategy. https://eur-lex.europa.eu/legal-content/ EN/TXT/?uri=CELEX%3A52020DC0381 5 BothEnds (2014). Soy Barometer 2014. http://www.bothends.org/uploaded _files/document/Soy_Barometer2014_ENG.pdf 6 We distinguish between the consumption of a commodity (direct human consumption or embedded in the production of other products - e.g. feed embedded in animal products) and the use of a commodity (what is used in the Netherlands, for example as feed, that is later exported in the form of animal products) in this report 7 A recent EU-wide estimate put the figure at 90% (Kuepper, B. & Manon Stravens, M. (2022). Mapping the European Soy Supply Chain Embedded Soy in Animal Products Consumed in the EU27+UK. ProFundo), whilst an older estimate specifically for the Netherlands estimated that 88% of combined quantity soybeans, meal and oil was used as animal feed (BothEnds (2014). Soy Barometer 2014. http://www.bothends.org/uploaded_files/document/Soy_Barometer2014_ENG.pdf 8 Wedeux, B. & Schulmeister-Oldenhove, A. (2021). Stepping up? The continuing impact of EU consumption on nature worldwide. WWF. 9 Jennings, S., Munkedal, C., Abbott, C., and McCormack, C. (2022). Beyond Forests: Reducing the EU’s footprint on all natural ecosystems. WWF. https://www.wwf.eu/?5709966/Beyond-Forests-Reducing-the-EUs-footprint- on-all-natural-ecosystems 10 The Nature Conservancy (2019). Incentives for sustainable soy in the Cerrado. https://www.nature.org/content/dam/tnc/nature/en/documents/TNC_ IncentivesforSustainableSoyinCerrado_Nov2019.pdf 11 IBGE. (2018). Agricultural census 2017. www.sidra.ibge.gov.br/pesquisa/censo- agropecuario/censo-agropecuario-2017 12 Agrosatélite Geotecnologia Aplicada Ltda. Análise geoespacial da expansão da soja no bioma Cerrado: 2000/01 a 2020/21. – Florianópolis-SC, Brasil, 2021. ISBN: 978-65-991465-4-1 13 Data in this case study refers only to direct exports of soy to the Netherlands, and does not include soy that was exported to other countries and then later exported to the Netherlands, either as soy or embedded in other imports. As a consequence, the numbers are not directly comparable to those presented in the rest of the report. 14 The data (volumes, companies and GHG emissions) presented here are based on an analysis of TRASE: https://www.trase.earth/ 15 Vijay V., Pimm S.L., Jenkins C.N., Smith S.J. (2017). The Impacts of Oil Palm on Recent Deforestation and Biodiversity Loss. PLoS ONE 11/7, 1-19. 16 Summarised in Barthel, M., Jennings, S., Schreiber, W., Sheane, R., Royston, S., Fry, J., Khor, Y.L. and McGill, J., (2017). Study on the environmental impact of palm oil consumption and on existing sustainability standards. Brussels: Directorate-General for Environment, European Commission. www.ec.europa.eu/ environment/forests/pdf/palm_oil_study_kh0218208enn_new.pdf 17 Dutch Alliance for Sustainable Palm Oil (2021). Annual Report DASPO 2020. 18 ‘Mass Balance’ is a system whereby certified and non-certified materials are mixed, with a proportion claimed as certified. 19 Statistics Indonesia. (2021). Indonesian palm oil statistics 2020. Jakarta, Indonesia: BPS. ISSN: 1978-9947 20 Gillison, A.N. (2001). Vegetation surveuy and habitat assessment of the Tesso Nilo forest complex, Pekanbaru, Riau Province, Sumatra, Indonesia. WWF Technnical Report, WWF, Washington DC, USA. 21 IUCN (2021). https://www.iucnredlist.org/ ‘Endangered’ species are considered here as vulnerable, endangered, critically endangered and extinct. 22 Statistics Indonesia. (2010). Indonesian palm oil statistics 2020. Jakarta, Indonesia: BPS. ISSN. 1978-9947 23 Khor, Yuleng (2016), Socio-economic parameters for peat restoration policy makers [presentation], LM International Ltd, 15th International Peat Congress (Kuching: 17 Aug. 2016). 24 Apresian, S.R., Tyson, A., Varkkey, H., Al, S., Choiruzzad, S. & Indraswari, R. (2020). Palm Oil Development in Riau, Indonesia: Balancing Economic Growth and Environmental Protection. 2. 1-29. 10.6936/NIJHSS.202006_2(1).0001. 25 Helmi, H. Djafri, D., Mutiani, C., Halim, N.A., Badri, M., Yefni, Y. (2021). Indigenous people in the dynamics of land use changes, forest fires, and haze in Riau Province, Indonesia. Pages 291-308 in Natural Resource Governance in Asia, Chapter 18. Editor(s): Raza Ullah, Shubhechchha Sharma, Makoto Inoue, Sobia Asghar, Ganesh Shivakoti. Elsevier. ISBN 9780323857291, https://doi.org/10.1016/ B978-0-323-85729-1.00023-2 26 Global Forest Watch (2021). https://www.globalforestwatch.org/ 27 Zhao, J., Lee, J.S.H., 2,3, Elmore, A.J., Fatimah, Y.A., Numata, I., Zhang, X., & A Cochrane (2022). Spatial patterns and drivers of smallholder oil palm expansion within peat swamp forests of Riau, Indonesia. Environmental Research Letters, Volume 17, 4 28 Eyes on the Forest (2018). Palm oil plantations operating in the Riau forest estate without permits and linked to allegedly law violations 29 Butler, R. (2014). Half of Riau’s oil palm plantations are illegal. Mongabay. https://news.mongabay.com/2014/08/half-of-riaus-oil-palm-plantations- are-illegal/#:~:text=Half%20of%20the%20oil%20palm,oil%20palm%20 plantations%20lack%20permits. 30 TRASE https://www.trase.earth/ 31 Olenex Edible Oils B.V. – Rotterdam. Traceability Summary - Supplies January 2020 – December 2020; Bunge Loders Croklaan Global 2020 Full Year Mill List; Cargill Global Mill List - Quarter 4, 2021; AAK public mill list (September 2021). 32 Viterra B.V. (2020). RSPO Annual Communication of Progress 2020. https://www.rspo.org/members/ 33 Global Forest Watch. Universal Mill List. https://data.globalforestwatch.org/ documents/universal-mill-list/explore 34 Eyes on the Forest (2020). Enough is enough - time for the palm oil market to start the real work to stop driving deforestation. Investigative report. https://www. eyesontheforest.or.id/reports/investigative-report-enough-is-enough-jun-2018 35 WWF-Indonesia (2013). Palming off a National Park. Tracking illegal oil palm fruit in Riau, Sumatra. https://wwf.panda.org/wwf_news/?209261/REPORT-Palming- off-a-National-Park-Tracking-Illegal-Palm-Oil-Fruit-in-Riau-Sumatra 36 Eyes on the Forest (2020). Enough is enough - time for the palm oil market to start the real work to stop driving deforestation. Investigative report. https://www. eyesontheforest.or.id/reports/investigative-report-enough-is-enough-jun-2018 37 FEFAC (n.d). Feed and Food Statistical Yearbook 2018. 38 WWF (2021). 2021 Plowprint Report. 39 CBI (22 September 2021). The Dutch market potential for cocoa. https://www.cbi. eu/market-information/cocoa-cocoa-products/netherlands/market-potential 40 Kroeger, A. et al. (2017) Eliminating Deforestation from the Cocoa Supply Chain. World Bank Group, 2017. 41 ILO (2007). Rooting out Child Labour from Cocoa Farms. Paper No. 2: health and Safety Hazards. 42 Sadhu, S., Kysia, K., Onyango, L., Zinnes, C., Lord, S., Monnard, A., & Arellano, I.R (2020). NORC Final Report: Assessing Progress in Reducing Child Labor in Cocoa Production in Cocoa Growing Areas of Côte d’Ivoire and Ghana 43 ITC. (2019). The State of Sustainable Markets 2019: Statistics and Emerging Trends. www.intracen.org/ uploadedFiles/intracenorg/Content/Publications/ Sustainabile%20markets%202019%20web.pdf 44 World Cocoa Foundation https://www.worldcocoafoundation.org/about-wcf/ vision-mission/ 45 Cocoa and Forests Initiative https://www.worldcocoafoundation.org/initiative/ cocoa-forests-initiative/ 46 NU (03 May 2018). Nederlandse bedrijven gebruiken vaker duurzame cacao. https://www.nu.nl/duurzaam/5248700/nederlandse-bedrijven-gebruiken-vaker- duurzame-cacao.html 47 Dutch Initiative on Sustainable Cocoa https://www.idhsustainabletrade.com/ initiative/dutch-initiative-on-sustainable-cocoa-disco/ 48 IDH (2021). Roadmap to deforestation-free cocoa in Cameroon. https://www. idhsustainabletrade.com/uploaded/2021/01/20210111-RDFC-2-Pager-2-_Final.pdf 49 European Commission (2020). Analysis of the cacao value chain of Cameroon. Value Chains for Development no. 23. 50 Office of Child Labor, Forced Labor, and Human Trafficking (2021). Findings on the worst forms of child labour 2020. Bureau of International Labor Affairs. United States Department of Labor. https://www.dol.gov/sites/dolgov/files/ILAB/child_ labor_reports/tda2020/2020_TDA_BigBook_Online_optimized.pdf 51 WWF (12 February 2020). TRIDOM Initiative for People and Biodiversity: Reconciling conservation and human wellbeing in Africa’s unique forest. https:// africa.panda.org/?30901/TRIDOM-Initiative-for-People-and-Biodiversity- Reconciling-conservation-and-human-wellbeing-in-Africas-unique-forest 52 Koffi, G. (25 February 2021). On the road to deforestation-free cocoa in Cameroon. World Agroforestry. https://worldagroforestry.org/blog/2021/02/25/road- deforestation-free-cocoa-cameroon 53 UNCOMTRADE. https://comtrade.un.org/ 54 CBI (22 September 2021). The Dutch market potential for cocoa. https://www.cbi. eu/market-information/cocoa-cocoa-products/netherlands/market-potential 55 Voora, V., Bermúdez, S., Larrea, C & Baliño, S. (2019). Global Market Report: Coffee. IISD. 56 Fountain, A.C. & Heutz-Adams, F. (2021). Cocoa Barometer 2020. https:// voicenetwork.cc/wp-content/uploads/2021/03/2020-Cocoa-Barometer-EN.pdf 57 Office National du Cacao et du Café (n.d.). Cocoa Producing Areas of Cameroon. https://oncc.cm/cocoa-production-zones 58 FAOSTAT. (2022). Food and Agriculture data. www.fao.org/faostat/en/#home 59 Panhuysen, S. and Pierrot, J. (2018). Coffee Barometer 2018 60 World Vision (2016). No Child for Sale: Coffee. Available at http://nochildforsale. ca/wp- content/uploads/2016/04/Coffee_Infographic.pdf 61 Danwatch (2016). Bitter Kaffee. Available at https://old.danwatch.dk/en/ undersogelse/bitter-kaffe/ 62 The Guardian (2016). Nestle admits slave labour risk on Brazil coffee plantations. Available at https://www.theguardian.com/global-development/2016/mar/02/ nestle-admits-slave-labour-risk-on-brazil-coffee- plantations 63 Bunn et al. (2015). A bitter cup: climate change profile of global production of Arabica and Robusta coffee. Climate Change, 129: 89-101 64 FAOSTAT. (2022). Food and Agriculture data. www.fao.org/faostat/en/#home 65 Erik Meijaard, E., Abrams, J.F., Juffe-Bignoli, D., Voigt, M., & Sheil, D. (2020). Coconut oil, conservation and the conscientious consumer. Current Biology, Volume z30, Issue 13, Open ArchiveDOI: https://doi. org/10.1016/j.cub.2020.05.059 66 Rochmyaningsih, D (July 2020). Claim that coconut oil is worse for biodiversity than palm oil sparks furious debate. ScienceInsider. https://www. science.org/content/article/claim-coconut-oil-worse-biodiversity-palm-oil-sparks- furious-debate 67 http://www.napc.gov.ph/sites/default/files/documents/articles/Issue%20No.%20 2%20- %20Coconut%20Road%20Map.compressed.pdf 68 https://www.dol.gov/sites/dolgov/files/ILAB/ListofGoods.pdf 69 Estimated from FAOSTAT by apportioning national pasture area between beef, dairy and sheep/goats based on national production data and food conversion and food conversion ratios. 70 Henders, S. Persson, U.M, Kastner, T. (2015), Trading forests: land-use change and carbon emissions embodied in production and exports of forest-risk commodities. Environ. Res. Lett. 10 125012 71 Goldman, E., Weisse, M.J., Harris, N. & Schneider, M. (2020). Estimating the Role of Seven Commodities in Agriculture-Linked Deforestation: Oil Palm, Soy, Cattle, Wood Fiber, Cocoa, Coffee, and Rubber.” Technical Note. Washington, DC: World Resources Institute. 72 ILO (2009) Fighting Forced Labour: The Example of Brazil. International Labour Organization. 73 Global Roundtable for Sustainable Beef. https://grsbeef.org/ 74 FAOSTAT. (2022). Food and Agriculture data. www.fao.org/faostat/en/#home 75 Dudley, N., Jeanrenaud, J.P., and Sullivan, F. (2014). Bad Harvest: The Timber Trade and the Degradation of Global Forests. Taylor & Francis. 76 Potts, J., Lynch, M., Wilkings, A., Huppé, G., Cunningham, M., and Voora, V. (2014). State of Sustainability Initiatives Review. IISD & IIED. 77 WWF International (2015). WWF Certification Assessment Tool v03: Forest Stewardship Council (FSC), and WWF Certification Assessment Tool v03: Programme for the Endorsement of Forest Certification (PEFC). Both available at http://wwf.panda.org/?246871/WWF-Forest-Certification-Assessment-Tool-CAT 78 Penninkhof, J. & Oldenburger, J. (2021). Resultaten VVNH monitoring 2020. Probos. 79 UNCOMTRADE. https://comtrade.un.org/ 80 De Ruiter, H., Macdiarmid, J.I., Matthews, R.B., Kastner, T., Lynd, L.R. & Smith, P. (2017). Total global land footprint associated with UK food supply 1986-2011. Global Environmental Change. 43, 72-81. Doi:10.1016/j.gloenvcha.2017.01.007 81 FAO (2016) Global Forest Resource Assessment 2015: Desk Reference. FAO, Rome. 82 De Weert. L (2021). LUC Impact Tool. Blonc Consultants. https://blonksustainability.nl/news/update-of-the-blonk-direct-land- use-change-assessment-tool
  • 30. WWF-NL Driebergseweg 10 3708 JB Zeist Postal address Postbus 7 3700 AA Zeist Tel.: 0800-1962 © 1986 Panda Symbol WWF ® «WWF» is a trademark registered by WWF Our Mission Together, we protect the environment and create a future worth living for generations to come.