Training Of Trainers FAI Eng. Basel Tilapia Welfare.pdf

Sexual maturity in ponds is reached at an age of 5-6 months. Spawning begins when water temperature reaches 24˚c. The breeding process starts when the male establishes a territory, digs a craterlike spawning nest and guards his territory called a lek. Nests are prepared by scooping out depressions at pond bottom. Mature female visits the pond and there is immediate courtship and mating. The ripe female spawns in the nest, and immediately after fertilization by the male, collects the eggs into her mouth and moves off. The female incubates the eggs in her mouth and broods the fry after hatching until the yolk sac is absorbed. (1-2 weeks acc. to water temp.) The Feed Conversion Ratio is a calculation that tells us how much feed we need to give for the fish to gain 1 kg in weight. For example, a FCR of 1.5:1 means that the farmer has given 1.5 kg of feed to increase the weight of the fish by 1.0 kg. FCR = Amount of feed provided (kg) / biomass gained (kg) Ideal Feed Conversion Ratio (FCR) for tilapias in ponds and cages during grow-out stage The Body Condition Factor is a calculation that tells us if the fish have a normal weight, are underweight or are overweight for their size. To calculate this, we use the length and weight of the fish. Body condition factor (k) = 100 x (weight [g] / total length [cm]3) Ideal Condition Factor (K) for tilapias in ponds and cages during the grow-out stage. The crude protein is a measure of the % protein contained in the feed. As a rule of thumb, as tilapia grow, the percentage of crude protein needed for optimal growth decreases. In this module, we are focusing on the grow-out stage and the ideal amount of protein in ponds and cages. Ideal crude protein % for tilapias in ponds and cages during the grow-out stage.

Recommended
More Related Content
Similar to Training Of Trainers FAI Eng. Basel Tilapia Welfare.pdf
Similar to Training Of Trainers FAI Eng. Basel Tilapia Welfare.pdf (20)
More from Basel Ahmed
More from Basel Ahmed (7)
Recently uploaded
Recently uploaded (20)
Training Of Trainers FAI Eng. Basel Tilapia Welfare.pdf
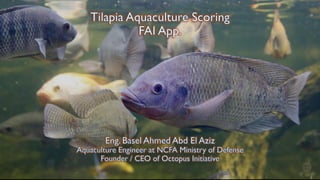
- 1. Tilapia Aquaculture Scoring FAI App. Eng. Basel Ahmed Abd El Aziz Aquaculture Engineer at NCFA Ministry of Defense Founder / CEO of Octopus Initiative
- 2. THE GLOBAL FISH PRODUCTION Global Production 179 Million Tones Fisheries 96.8 MT Aquaculture 82.2 MT 54% 46%
- 3. 01 02 03 04 69% 14% 10% 7% Asia 123.5 MT Global Fish Production America 25 MT Global Fish Production Europe 17.9 MT Global Fish Production Africa 12.5 MT Global Fish Production TOP FISH PRODUCING CONTINENTS 62.7 MT China 7 MT Peru, 6 MT America 4 MT Norway 2 MT Egypt
- 4. TOP 3 FISH SP. PRODUCED IN THE WORLD MARINE CAPTURE Gadus chalcogrammus Alaska pollock األطلنطي القد Katsuwonus pelamis Skipjack تونة - جاك سكيب Binomial name: Engraulis ringes Common Name: Anchoveta Arabic name: األنشوجة 10 % 5% 4% 7 MillionTones 3.4 MillionTones 3.2 MillionTones Total Fin Fish 71.9 Million Tones Marine Capture
- 5. TOP 3 FISH SP. PRODUCED IN THE WORLD FRESHWATER Hypophthalmichthys molitrix Silver Carp الفضي المبروك Oreochromis niloticus NileTilapia النيلي البلطي Binomial name: Ctenopharyngodon idellus Common Name: Grass Carp Arabic name: الحشائش مبروك 10.5% 8.8% 8.3% 5.7 MillionTones 4.8 MillionTones 4.5 MillionTones Total Fin Fish 54.3 Million Tones Aquaculture
- 6. THE MOST FAMOUS CULTIVATED SP. IN EGYPT FRESHWATER Kingdom: Animalia Phylum: Chordata Class: Actinopterygii Order: Cichliformes Family: Cichlidae Genus: Oreochromis Species: O. niloticus Binomial name: Oreochromis niloticus Animalia Chordata Actinopterygii Mugiliformes Mugilidae Mugil M. cephalus Mugil cephalus Liza ramada Animalia Chordata Actinopterygii Mugiliformes Mugilidae Chelon C. ramada Common name: NileTilapia Striped Mullet Thin lip Mullet Arabic name: نيلي بلطي بوري طوبار
- 7. THE NILE TILAPIA PRODUCTION Global Production 6.5 MT GlobalTilapia Production Egypt Production 1.2 MT GlobalTilapia Production 86% Aquaculture 12% Lakes 2% River Nile
- 8. WHY DO WE CULTURE MONO-SEX TILAPIA? Grow out: Type of culture Mono-sex Mixed-sex Advantage • Large harvest weight • Uniform size at harvest • Technically easy Disadvantage • Technically difficult • Small harvest weight • Mixed sizes at harvest Example Lower Preferred Upper Temperature 11-12˚c 25-32˚c 42˚c Feeding Omnivorous Grazer Filter feeder
- 9. MONO-SEX TILAPIA LIFE CYCLE Sexual Maturity: • Sexual maturity in ponds is reached at an age of 5-6 months. • Spawning begins when water temperature reaches 24˚c. • The breeding process starts when the male establishes a territory, digs a craterlike spawning nest and guards his territory called a lek. • Nests are prepared by scooping out depressions at pond bottom. • Mature female visits the pond and there is immediate courtship and mating. • The ripe female spawns in the nest, and immediately after fertilization by the male, collects the eggs into her mouth and moves off. • The female incubates the eggs in her mouth and broods the fry after hatching until the yolk sac is absorbed. (1-2 weeks acc. to water temp.)
- 10. TILAPIA WELFARE TRAINING OF TRAINERS
- 12. TILAPIA WELFARE INDICATORS - EGYPT • In this course we will learn: 1) The different types of welfare indicators. 2) The 3-score system we are using to score each indicator. 3) The 9 health indicators. 4) The 10 environmental indicators. 5) The 6 nutritional indicators. 6) The 3 behavioral indicators.
- 13. TILAPIA WELFARE INDICATORS - EGYPT • All welfare measurement criteria are based on demonstrating any evidence of CHANGE in the fish’s: The different types of welfare indicators. 1) Physical condition of the fish (health, growth). 2) Mind (pleasure, suffering). 3) Natural behavior (hiding, escaping). We use Welfare Indicators to get information about the state of the fish's needs.
- 14. Direct Indicators are fish measurements, such as: 1. The fish weight 2. The fish length 3. The health of each fish Indirect Indicators are measures of the surrounding environment, including: 1. Oxygen saturation 2. Water temperature 3. pH 4. Transparency 5. Alkalinity 6. Presence of predators TILAPIA WELFARE INDICATORS - EGYPT
- 15. TILAPIA WELFARE INDICATORS - EGYPT Welfare indicators can be direct or indirect Direct indicators are measured on the fish. In this case, the farmer measured the fish weight and made a note of the individual weights of each fish. indirect indicators are measurements of the fish surrounding environment Direct indicators are measured on the fish. In this case, the farmer is measuring the length of the fish.
- 16. In practice, the welfare Indicators we are using to assess tilapia welfare are related to the first four domains: 1. Nutrition 3. Health 2. Environment 4. Behavior TILAPIA WELFARE INDICATORS ARE RELATED TO THE FIRST FOUR WELFARE DOMAINS: Nutrition: Paulo Thara, Brazilian tilapia farmer storing feeding bags. One of the 6 nutrition indicators we score is the feed amount. Health: Checking the eyes condition during the health assessment. This is one of the 9 tilapia health indicators we score. Environment: Multi-parameter water sensor showing oxygen saturation and water temperature. Temperature and oxygen are two environment indicators out of the 10 we score. Behavior: Fish swimming near the surface, some jumping during feeding. One of the 3 behavioral indicators we score is the swimming behavior.
- 17. The three-score system: We organize the indicators in four key areas or domains. For each area we score several indicators using a three-level score system (score 1, 2 and 3). The higher the score, the greater the deviation from the normal condition. THE 3-SCORE SYSTEM APPLIED TO THE WELFARE INDICATORS Score 1 Good Score 2 Moderate Score 3 Poor The normal reference value for a specific parameter. Values normally tolerated by tilapia but are not ideal. Values that significantly affect the welfare of tilapia, which can lead to severe suffering and even death of the animals.
- 18. THE 9 HEALTH INDICATORS
- 19. Mortality is one of the nine health indicators 1. Eyes 2. Mouth and Jaws 3. Operculum 4. Gills 5. Fins 6. Spine 7. Skin 8. Ectoparasites 9. Mortality THE 9 HEALTH INDICATORS
- 20. The condition of the eyes is one of the health indicators we are measuring. In the case of the eyes, a score 1, corresponds to a fish with both eyes healthy and appearing normal, with no signs of injury or disease. So, score 1 corresponds to a normal fish, while score 2 and 3 correspond to increasing levels of injury, deformity, or disease. Below is a clear example of how the scores work using the eyes as an example. THE 3-SCORE SYSTEM APPLIED TO THE EYES Score 1: fish has both eyes healthy, both appear normal, and there are no signs of injuries, deformities, or disease. Score 2: fish has one of the eyes with an injury, deformity, or disease, in this case the fish has one eye swollen and some signs of bleeding. Score 3: fish has both eyes with an injury, deformity, or disease.
- 21. SCORING THE EYES Score Eyes description 1 Both eyes look normal and healthy 2 One eye bleeding, swollen or traumatic injury 3 Two eyes bleeding, swollen eyes or traumatic injury; chronic condition, impaired vision
- 22. SCORING THE JAWS AND MOUTH Score Jaws and mouth description 1 Jaw and mouth appear normal and healthy 2 Jaws shows moderate bleeding, redness, injury or deformity (without affecting eating behavior) 3 Severe bleeding, redness or injury or deformity (affecting eating)
- 23. SCORING THE OPERCULUM Score Operculum description 1 Normal and healthy appearance 2 The operculum is missing some tissue less than 25% 3 The operculum shows signs of bleeding, redness or absence of tissue greater than 25%
- 24. SCORING THE FINS Score Fins description 1 Normal and healthy appearance 2 The fins show scar tissue, mild necrosis or splitting. 3 The fins show severe necrosis or bleeding, redness, and some fin rays are exposed.The fins have ectoparasites or foreign bodies.
- 25. SCORING THE SKIN Score Skin description 1 Normal and healthy appearance 2 Localized loss of scales, ulcers or superficial lesions < 1 cm2 3 Rising or general loss of scales, ulcers or superficial lesions > 1 cm2 , redness, necrosis, darkening, or lightening, bleeding, swelling, or presence of parasites.
- 26. SCORING THE GILLS Score gills description 1 Normal and healthy appearance 2 Gills show signs of light injury, mild necrosis, splitting or thickening 3 Gills show signs of bleeding, redness, paleness, severe necrosis, excess of mucus, spots, swelling, deformation, adhered foreign body or ectoparasites
- 27. SCORING THE SPINE Score spine description 1 Normal structure 2 Light spine deformity (kyphosis, lordosis or scoliosis, normal weight) 3 Severe spine deformity (kyphosis, lordosis or scoliosis, weight loss)
- 28. SCORING THE ECTOPARASITES Score ectoparasites description 1 No infestation 2 Moderate infestation (≤ 5 ectoparasites) 3 Intense infestation (>5 parasites)
- 29. SCORING THE MORTALITY Score Reference values (%) 1 No ≤ 10 2 11 - 25 3 ≥ 26
- 30. THE 6 NUTRITION INDICATORS
- 31. 1. Feed amount 2. Feeding frequency 3. Feed distribution area 4. Crude protein 5. Feed Conversion Ratio 6. Condition factor THE 6 NUTRITION INDICATORS
- 32. The Feed Conversion Ratio is a calculation that tells us how much feed we need to give for the fish to gain 1 kg in weight. For example, a FCR of 1.5:1 means that the farmer has given 1.5 kg of feed to increase the weight of the fish by 1.0 kg. FCR = Amount of feed provided (kg) / biomass gained (kg) Ideal Feed Conversion Ratio (FCR) for tilapias in ponds and cages during grow-out stage WHAT IS THE FEED CONVERSION RATIO (FCR)? Ponds Cages ≤ 1.6 ≤ 2
- 33. The Body Condition Factor is a calculation that tells us if the fish have a normal weight, are underweight or are overweight for their size. To calculate this, we use the length and weight of the fish. Body condition factor (k) = 100 x (weight [g] / total length [cm]3) Ideal Condition Factor (K) for tilapias in ponds and cages during the grow-out stage. WHAT IS THE BODY CONDITION FACTOR (K)? Ponds Cages 1.6 – 1.9 1.6 – 1.9
- 34. The crude protein is a measure of the % protein contained in the feed. As a rule of thumb, as tilapia grow, the percentage of crude protein needed for optimal growth decreases. In this module, we are focusing on the grow-out stage and the ideal amount of protein in ponds and cages. Ideal crude protein % for tilapias in ponds and cages during the grow-out stage. WHAT IS THE CRUDE PROTEIN? Ponds Cages 28 – 35 % 32 – 35 %
- 35. Nutrition indicators Ponds Cages Feed amount (% of biomass/day) 2.0 – 3.0 % 1.5 – 3.0 Feeding frequency (times/day) 2 - 3 or continuous 3 - 4 or continuous Feed distribution area (% of surface area covered) ≥75 % of the surface ≥75 % of the surface Crude Protein (%) 28 – 35 % 32-35 % Feed Conversion Ratio (FCR) ≤ 1.6 ≤ 2 Condition Factor (K) 1.6 – 1.9 1.6 – 1.9 NUTRITION INDICATORS: NORMAL REFERENCE VALUES SUMMARY TABLE FOR GROW-OUT
- 36. FEED AMOUNT (% OF BIOMASS/DAY) recommended for tilapias in ponds and cages during the grow-out stage Score Ponds Cages 1 2.0 - 3.0 1.5 - 3.0 2 1.5 - 1.9 or 3.1 - 5.0 1.0 - 1.4 or 3.1 - 5.0 3 ≤ 1.4 or ≥5.1 ≤ 0.9 or ≥5.1
- 37. FEEDING FREQUENCY (TIMES/DAY) recommended for tilapias in ponds and cages during the grow-out stage Score Ponds Cages 1 2 - 3 or continuous 3 - 4 or continuous 2 1 1 - 2 3 ≤ 1 ≤ 1
- 38. CRUDE PROTEIN (%) recommended for tilapias in ponds and cages during the grow-out stage Score Ponds Cages 1 28 - 35 32 - 35 2 25 - 27 24 - 31 3 ≤ 24 or ≥36 ≤ 23 or ≥36
- 39. FEED CONVERSION RATIO (FCR) recommended for tilapias in ponds and cages during the grow-out stage Score Ponds Cages 1 ≤ 1.6 ≤ 2 2 1.7 – 1.9 2.1 – 2.5 3 ≥ 2.0 ≥ 2.6
- 40. THE 10 ENVIRONMENTAL INDICATORS
- 41. 1. Temperature 2. pH 3. Transparency 4. Oxygen saturation 5. Non-ionized ammonia (NH3) 6. Nitrite (NO2) 7. Alkalinity 8. Photoperiod 9. Terrestrial predators (birds, otter) 10. Non-specific inhabitants (aquatic competitors / predators) THE 10 ENVIRONMENTAL INDICATORS
- 42. Different fish species have different preferences and tolerances for their surrounding environment. Some species are cold water species and have a low tolerance to warm waters, while for others the opposite is true. WATER QUALITY Farmer measuring the water temperature and oxygen with a multiparameter sensor in a fish cage. Multiparameter sensor display showing water temperature (32.2 °C) and oxygen saturation (7.76 mg/L). Temperature is only one of the water quality parameters that farmers need to measure and control. Tilapias have preferences and tolerances to the pH, oxygen saturation, ammonia, and nitrite in the water. The table below shows the normal or reference values that are ideal for tilapia to grow.
- 43. Water quality Optimal levels Temperature 25 – 32 °C pH 6.0 - 8.5 Transparency 30 – 40 cm Oxygen saturation 70 – 95 % Non-ionized ammonia (NH3) 0.00 - 0.05 mg/L Nitrite (NO2) 0.00 - 0.50 mg/L Alkalinity 30 – 100 mg/L ENVIRONMENTAL INDICATORS: SUMMARY TABLE
- 44. TEMPERATURE (°C) Water temperature has a huge effect on the lives of the fish, it affects their ability to grow, to feed, and to reproduce. Different species have different tolerances to temperature -tilapia prefer water temperatures between 25 and 32 °C. Temperature Score Grow-out and finish ponds (°C) 1 25 - 32 2 20 - 24 or 33 - 37 3 ≤ 19 or ≥ 38
- 45. PH pH is a measure of how acidic/alkaline the water is. The range goes from 0 to 14, with 7 being neutral. A pH of less than 7 indicates acidity, whereas a pH greater than 7 indicates alkalinity. The pH of water is a very important measurement concerning water quality. pH Score Grow-out and finish ponds (°C) 1 6.0 - 8.5 2 5.5 - 5.9 OR 8.6 – 9.0 3 ≤ 5.4 OR ≥ 9.1
- 46. TRANSPARENCY (CM) Transparency of water relates to the depth that light will penetrate water. Water transparency depends on the amount of particles in the water. Particles can be inorganic (e.g. sediment from erosion) or organic (such as algae, phytoplankton).The less particles, the more transparent the water. Transparency Score Grow-out and finish ponds (°C) 1 41 – 65 cm 2 25 - 40 OR ≥ 66 cm 3 ≤ 24 cm
- 47. OXYGEN SATURATION (%) Dissolved oxygen is necessary for many forms of life including fish, invertebrates, bacteria and plants. Healthy water should generally have dissolved oxygen concentrations above 6.5-8 mg/L and dissolved oxygen saturation between about 80-120%. Oxygen Score Grow-out and finish ponds (°C) 1 70 – 95 % 2 40 - 69 % 3 ≤ 39 % OR ≥ 96 %
- 48. NON-IONISED AMMONIA (NH3) Ammonia (NH3) is produced by fish respiration and by the decomposition of waste products (excessive organic matter and excessive feeding). Ammonia is a strong cell poison and can cause damage to the gills at levels as low as 0.25ppm. Clinical signs include (but are not limited to) increased mucus production, red or bleeding gills, darkening of body coloration, 'gasping' for air at the surface and increased respiration rate. NH3 Score Grow-out and finish ponds (°C) 1 0.00 - 0.05 mg/L 2 0.051 - 0.10 mg/L 3 ≥ 0.11 mg/L
- 49. NITRITE (NO2) Nitrite (NO2) is generated through the oxidation of ammonia by nitrifying bacteria. Nitrite blocks oxygen uptake by the blood (similar to carbon monoxide poisoning in mammals). No2 Score Grow-out and finish ponds (°C) 1 0.00 - 0.50 mg/L 2 0.51 - 1.00 mg/L 3 ≥ 1.01 mg/L
- 50. ALKALINITY Alkalinity is not a chemical in water, but, rather, it is a property of water that is dependent on the presence of certain chemicals in the water, such as bicarbonates, carbonates, and hydroxides. Alkalinity is the buffering capacity of a water body; a measure of the ability of the water body to neutralize acids and bases and thus maintain a stable pH level. This means that water with a high alkalinity will experience less of a change in its own acidity when, for instance, there is acid rain or an acid spill.' Score Grow-out and finish ponds (°C) 1 30 – 100 mg/L 2 20 - 29 OR 101 – 200 mg/L 3 ≤ 19 OR ≥ 201 mg/L
- 51. Predators are responsible for 30% of fish losses If predators can access the pond, cages, or tank, they can eat the fish and cause the loss of 20 to 30% of the production. The presence of predators is also a stress factor that must be controlled. Even if terrestrial predators, such as birds, can’t access their prey, the tilapia still feel threatened. PREDATORS Native alligator species swimming in a tilapia pond. Native bird species flying over tilapia cages. Footprints from native feline near tilapia ponds, probably a jaguar.
- 52. SCORING THE PRESENCE OF PREDATORS The tables below show the environmental indicator scores for on-farm tilapia welfare evaluation based on predators and undesired competitors . In this module we will only score tilapias in the grow-out phase. We will be focusing on the other life stages in theTilapia Environment and Welfare. Terrestrial predators Score Grow-out and finish ponds (°C) 1 No, they are absent 2 Controlled presence 3 Uncontrolled presence
- 53. THE 3 BEHAVIORAL INDICATORS
- 54. 1. Foraging behavior 2. Swimming behavior 3. Effective stunning THE 3 BEHAVIORAL INDICATORS
- 55. SCORING THE FORAGING BEHAVIOR Tilapia usually take 3 to 6 minutes to eat all feed provided by the farmer. If fish eat quicker or slower, then it can be an indication that the feed is insufficient or too much. It can also mean that there is something wrong with the fish or the environment which needs investigating. Score Grow-out 1 All feed eaten 3 to 6 minutes 2 All feed eaten 2 to 3 minutes 3 All feed eaten < 2 min OR > 6 min
- 56. SCORING THE SWIMMING BEHAVIOR Score Grow-out 1 Normal swimming, no visible dorsal fins or belly on the water surface 2 Excited swimming behavior, but few fish with dorsal fins or belly on the water surface 3 Swimming in different directions or decreasing activity, fish stuck against net, fish floating on their side, body exposed to air for prolonged periods, exhaustion Typically, fish swim using their fins and body underwater – the dorsal fin and belly are not visible on the surface. Deviations from this behavior should be investigated. The swimming behavior can be observed and scored during feeding and harvest.
- 57. SCORING EFFECTIVE STUNNING Score Grow-out 1 Normal swimming, no visible dorsal fins or belly on the water surface Instantaneous loss of EQ,TGR, OB andVER 2 Instantaneous loss of EQ and TGR, progressive loss of OB andVER in ≤ 30s 3 Progressive loss of EQ,TGR,VER and BO in ≥ 31s • Opercular Beat (OB) is the simplest way to estimate respiratory rate, by counting the opercular movement, which is directly proportional to the level of consciousness. • Vestibulo-Ocular Reflex (VOR) is measured by the Visual Evoked Response (VER) or “rolling of the eyes,” which is the movement of the eyes when the fish's body is rolled from side to side on the vertical axis. • Equilibrium (EQ) is assessed by the position of the fish and its ability to swim when placed in the water. • Tail Grib Reflex (TGR) is the technique of grabbing the animal's tail to check if the fish tries to escape, being an effective way to assess the fish's ability to interact with the external environment.
- 59. THE THREE FEEDING CHALLENGES 1. What to eat? 2. When to eat? 3. How much to eat? Some fish are bolder and will eat more, while others are shy and will eat less. ✓ Proactive fish: eat faster and are not affected much after acute stress. ✓ Reactive fish: have more difficulty getting food and reduce or temporarily stop feeding in a stressful situation. Tilapia natural food includes: • Phytoplankton (microalgae) • Zooplankton (microscopic animals) • Algae and aquatic plants • Aquatic insects • Small benthic invertebrates (bottom-dwelling animals) • Detritus (decaying organic material) • Tilapia fry can also eat fish larvae
- 60. THE ROLE OF FEEDING AND NUTRITION IN FISH WELFARE 1. Why proper nutrition matters? 2. What impacts fish growth? 3. How to select the right feed? Proper nutrition is good for the fish: 1. Strengthens the immune system and helps fish resist diseases and parasites 2. Reduces fish competition for food, aggressive behavior, and prevents skin and fin injuries 3. Promotes growth and more efficient feed conversion 4. Increases fish tolerance to handling and transport 5. Improves fish reproductive performance 6. Improves the quality of the post-larvae in the rearing facilities Prevents poor water quality events Optimizes turnover and profit for the farmer Improves the meat quality Increases the meat yield
- 61. THE KEY FACTORS THAT IMPACT FISH GROWTH Food The food must contain the essential nutrients in sufficient quantities and proportions to provide a nutritious balanced diet. A nutritionally balanced diet maintains normal body function and increases the fish's resistance to disease. The feed also needs to be the right size. Temperature The water temperature must be adequate, for tilapia the water should be around 25 to 32°C. Oxygen The Oxygen dissolved in the water must be sufficient. Ideal concentrations of dissolved oxygen (DO) for tilapia in water at 25°C are between 70-95%, equivalent to about 5.8 to 7.8 mg/L.
- 62. WHAT ARE THE IMPACTS OF FEEDING TOO MUCH FOOD TO THE FISH, TO THE WATER QUALITY AND TO THE FARMER? to the Fish Poor welfare Poor health Stress increases Immunity response decrease Diseases increase To the water quality Poor water quality Excess of organic matter Oxygen level decreases To the farmer Production costs increases Feed is wasted Mortality may increase Disease management costs may increase
- 63. WHAT ARE THE IMPACTS OF FEEDING TOO LITTLE FOOD TO THE FISH, TO THE WATER QUALITY AND TO THE FARMER? to the Fish Growth decreases Development decreases Malformations can appear To the water quality Minimal or no impact if there are no mass mortalities To the farmer Production costs may increase Fish take longer to reach commercial size More fish may have to be rejected due to malformations
- 64. TO ACCOMMODATE FOR BOTH FISH AND FARMER NEEDS, THE FARMER MUST MAKE SURE THEY KNOW THE ANSWER TO THE FOLLOWING QUESTIONS: 1. Does the feed composition match my fish diet needs? 2. Is the size of the pellets appropriate to the size of my fish? 3. How many fish do I have to feed? 4. How much food do my fish need? 5. When is the best time of the day to feed my fish? 6. What is the best method to feed my fish? 7. How to best store the feed? 8. For how long can I store the feed?
- 65. THERE ARE 5 NUTRIENTS IN FOOD For tilapia to live, grow and reproduce they need to break down the food they eat, absorb the nutrients contained in the food and get the energy necessary to swim, breathe, excrete, grow, and reproduce. The 5 nutrients in food are: 1. Proteins 2. Lipids 3. Carbohydrates 4. Minerals 5. Vitamins Fish are more efficient at using energy than birds or mammals. Most fish do not need to spend energy to control their body temperature (therefore fish are also called ectothermic or cold-blooded animals). When the water temperature drops below the optimal levels for the species, the fish: 1. metabolism decreases 2. take in less food 3. get less energy 4. use less energy 5. grow less
- 66. 1. PROTEINS All nutrients are essential for fish, but proteins are those that most often receive attention from fish farmers - they are the most expensive ingredient in the feed and impact directly fish growth. Fish uses proteins to build and regenerate most of their tissues: 1. Muscles 2. Skin 3. Cartilage 4. Blood 5. Nerves Is more protein always better? No, more protein in the diet is not always better! In aquaculture, the rule is that the best food for a fish is the one that most closely matches its body composition. Tilapia has a high protein content, which is why tilapia is a highly prized product for human consumption.
- 67. THE 10 ESSENTIAL AMINO ACIDS There are many different proteins, and all proteins are made of 20 different amino acids. Imagine a protein like a wall made of bricks.The wall is the protein, and the bricks are the amino acids.There are 20 different types of bricks, some bigger than others. Some walls are also bigger than others. The ten essential amino acids: Amino Acid Abbreviation 1. Arginine Arg 2. Lysine Lys 3. Histidine His 4. Threonine Thr 5. Valine Val 6. Leucine Leu 7. Isoleucine Iso 8. Methionine Met 9. Phenylalanine Phe 10. Tryptophan Try
- 68. 2. LIPIDS As in humans, lipids (fats and oils) are an important source of energy in the diet. However, in excess they increase the amount of visceral fat in tilapia. Lipids are: 1. Part of the cell membranes of fish. 2. Found in hormones and enzymes. 3. Involved in the formation of red blood cells. 4. Involved in the production of antibodies. 5. Involved in the production of important hormones.
- 69. 3. CARBOHYDRATES Carbohydrates are the least studied nutrients in fish food. Tilapia use both carbohydrates and lipids for energy. The protein in the diet is mainly used for growth. Carbohydrates are cheaper than fats, as a source of energy. This is why corn is the most used ingredient as a source of both carbohydrates and energy. The Cheaper Source of Energy
- 70. 4. MINERALS At least twenty-one minerals are vital for fish, and some, such as calcium, can be absorbed directly from the water. However, most minerals and vitamins must be absorbed through natural foods and feeds. Minerals are divided into two groups: Macro elements 1. Calcium Ca 2. Magnesium Mg 3. Sodium Na 4. Potassium K 5. Phosphorus P 6. Chlorine Cl 7. Sulphur S Micro elements 1. Iron Fe 2. Zinc Zn 3. Manganese Mn 4. Copper Cu 5. Iodine I 6. Nickel Ni 7. Fluorine Fl 8. Vanadium V 9. Chromium Cr 10. Molybdenum Mo 11. Selenium Se 12. Strontium Sr 13. Silica Si
- 71. 4. MINERALS Fish need minerals for: 1. Their immune system, to cope with stress and resist disease. 2. The formation of bones, teeth, and muscles. 3. The transmission of nerve impulses and muscle contraction. 4. The pH balance of the blood. 5. The structure of enzymes, vitamins, hormones and even proteins and lipids.
- 72. 5. VITAMINS Vitamins are organic compounds found in tiny amounts in the body but are essential for the growth, reproduction and health of fish and all animals. Since animals do not produce most vitamins themselves, they must be supplied through the diet.
- 73. TILAPIA NUTRIENT NEEDS The basic nutrient needs of tilapia vary with the life stage, and breeding cycle. Tilapia larvae Tilapia adults
- 74. TILAPIA NUTRIENT NEEDS % Post Larvae Fry Juveniles Crude Protein 45-60 35-40 30-35 Carbs <25 Not Known 25-30 Total Lipids 5-8 5-8 Not Known Fatty acids ꞷ-6 0.5-1 0.5-1 0.5-1 Fatty acids ꞷ-3 0.5-1 0.5-1 0.5-1
- 75. TILAPIA NUTRIENT NEEDS % Broadstocks Adults Crude Protein 30-35 30-35 Carbs 25-30 Not Known Total Lipids Not Known 8-10 Fatty acids ꞷ-6 0.5-1 0.5-1 Fatty acids ꞷ-3 0.5-1 0.5-1
- 76. TILAPIA NUTRIENT NEEDS Fish size range (g) Pellet size (mm) Nursery 0 - 1 1 - 5 <0.5 0.8 - 1.7 Pre-growth 5 - 30 30 - 200 2 - 3 3 - 4 Growth 200 - 600 600 - 1000 1000 - 2000 4 - 5 5 - 6 6 - 8 A high-quality feed must: 1. Be nutritious - provide all nutrients in the right proportions. 2. Have the right size - adequate granulometry. 3. Have the appropriate texture. 4. Be tasty – palatable. 5. Be stable in water – doesn’t immediately dissolve and diffuse in water, losing valuable nutrients.
- 77. MAKE SURE YOU CHOOSE A STORAGE ROOM WITH THE FOLLOWING CHARACTERISTICS 1. Dry: the storage room must always be dry to avoid oxidation of fats and the growth of fungi in the fodder. 2. Waterproof walls. 3. Waterproof floor. 4. Good ventilation. 5. Good lighting. 6. No direct sunlight. 7. No rodents. 8. No insects.
- 78. FEEDING METHODS, TIPS AND TRICKS 1. Manual Method The quantity and feeding times are controlled by the farmer and delivered by the farmer. 2. Automatic Method The quantity and feeding times are controlled by the farmer but delivered by an automatic machine. 3. OnDemand Method Mechanic system, the quantity and feeding times controlled by the fish.
- 79. THE AMOUNT AND FREQUENCY OF TILAPIA FEEDING DECREASES WITH INCREASING FISH SIZE. Weight Feeding frequency (times/day) Post-larvae 5 - 8 1 - 5 g 4 - 6 5 - 200 g 3 - 5 200 - 2000 g 1 - 4
- 80. FASTING When to fast the fish Fasting is common in aquaculture and promotes gut emptying, reducing oxygen demand and waste production in the water. Fasting is recommended before three key events: Harvest Slaughter Transport How long does it take for tilapia to empty out their entire digestive content at medium temperatures (26ºC)? - It takes 13 to 14 h for tilapia to empty out their entire digestive content at medium temperatures (26ºC).
- 81. THE BIOMETRIC SURVEY In the biometric survey the farmer weighs and measures a sample of fish Why are these measurements important? The weight and total lengths allow us to calculate the Body Condition Factor (K) and the Feed Conversion Ratio (FCR) and adjust the amount of feed given to the fish. Measuring Weighing How many fish should we sample for the biometric survey? You should always sample a minimum of 30 fish or 5% of the biomass in the pond, cage or tank.
- 82. WHAT IS THE K FACTOR FOR THE FISH FROM THE GOOD LUCK FARM? The table below shows the length and weight of fish measured in two fish farms.What is the K factor for the fish from the good luck farm? Use the formula: Body condition factor (k) = 100 x (weight [g] / total length [cm]3) Good Luck Farm Weight: 60.9 g Length: 15.1 cm K Factor: ??? Sunny Side Farm Weight: 140 g Length: 19 cm K Factor: 2.04 Answer: Good luck farm = 100 x 60.9 g / 15.1^3 = 6090 / 3442.951 = 1.77 Sunny side farm = 100 x 140 / 19^3 = 14000 / 6859 = 2.04 The (K) factor seems to vary with the fish development stage, feeding and farm system.
- 83. THE IDEAL AMOUNT OF FEED, FEED SIZE, FEEDING FREQUENCY AND FCR DEPEND ON THE FISH SIZE Fish weight (g) Up to 0.5 g 0.5 - 5 g 5 - 20 g 20 - 200 g Crude protein (%) 40 - 50 40 - 45 35 - 40 32 - 35 Feed size (mm) <0.5 0.5 - 1.0 2.0 - 3.0 3.0 - 4.0 Feed amount (% biomass/day) 15 - 30 10 - 15 6 - 8 4 - 6 Feeding frequency (times/day) 6 - 8 5 - 6 3 - 4 2 - 3 Feed Conversion Ratio (FCR) 0.8 - 1.0 0.8 - 1.0 0.8 - 1.0 1.0 - 1.3
- 84. 1. FEEDING FREQUENCY (TIMES/DAY) The tables below provide the criteria to score tilapia at different life stages. If you are using the app you won't need to memorize this, or even use the tables. You will only need to record the number of times you are feeding the fish of a certain size.The app will then tell you the corresponding score. Score Hatchery/Broodstock Feeding frequency (times/day) 1 Once a day 2 Twice / day or every other day 3 Every other day or twice per day Hatchery/Broodstock
- 85. 1. FEEDING FREQUENCY (TIMES/DAY) The juveniles feeding frequency score is based on the weight of the fish. The numbers correspond to times per day, example: juveniles weighing 15 g fed 2 times per day have a score of 2. Score Weight 0.5 - 5g Feeding frequency (times/day) Weight 5 - 20g Feeding frequency (times/day) 1 ≥5 ≥3 2 3 - 4 2 3 ≤ 2 1 Juveniles (0.5 to 20g) feeding frequency
- 86. 1. FEEDING FREQUENCY (TIMES/DAY) Score Grow out and fish-ponds Feeding frequency (times/day) 1 2 - 3 or continuous 2 1 3 ≤ 1 Grow out and fish-ponds
- 87. 1. FEEDING FREQUENCY (TIMES/DAY) Score Grow out and fish cages Feeding frequency (times/day) 1 3 - 4 or continuous 2 1 - 2 3 ≤ 1 Grow out and fish cages
- 88. 2. FEED AMOUNT Scoring the Feed Amount (% of biomass/day) Hatchery/Broodstock Score Hatchery/Broodstock Feed Amount (% of biomass/day) 1 3.0 - 5.0 2 1.5 - 2.9 3 ≤ 1.4 or ≥ 5.1
- 89. 2. FEED AMOUNT Scoring the Feed Amount (% of biomass/day) Juveniles (0.5 to 20g) Score 0.5 - 5g Feed Amount (% of biomass/day) 5 - 20g Feed Amount (% of biomass/day) 1 8.5 - 16.5 5.2 - 8.8 2 7.8 or 16.5 - 18 4.4 - 5.2 or 8.8 - 9.6 3 < 7 or > 18 < 4.4 or > 9.6
- 90. 2. FEED AMOUNT Scoring the Feed Amount (% of biomass/day) Grow out and fish-ponds Score Grow out and fish-ponds Feed Amount (% of biomass/day) 1 2.0 - 3.0 2 1.5 - 1.9 or 3.1 - 5.0 3 ≤ 1.4 or ≥ 5.1
- 91. 2. FEED AMOUNT Scoring the Feed Amount (% of biomass/day) Grow out and fish cages Score Grow out and fish cages Feed Amount (% of biomass/day) 1 1.5 - 3.0 2 1.0 - 1.4 or 3. 1- 5.0 3 ≤ 0.9 or ≥ 5.1
- 92. 3. FEED DISTRIBUTION Scoring the Feed Distribution Area (% of the water surface area covered) Hatchery/Broodstock Score Hatchery/Broodstock Feed distribution area (% of the water surface area covered) 1 ≥75 % of the surface covered 2 50-74% of the surface covered 3 ≤49% of the surface covered
- 93. 3. FEED DISTRIBUTION Scoring the Feed Distribution Area (% of the water surface area covered) Juveniles (2g) Score Nursery/Juveniles 2g Feed distribution area (% of the water surface area covered) 1 ≥75 % of the surface covered 2 50-74% of the surface covered 3 ≤49% of the surface covered
- 94. 3. FEED DISTRIBUTION Scoring the Feed Distribution Area (% of the water surface area covered) Grow out and fish-ponds Score Grow out and fish-ponds Feed distribution area (% of the water surface area covered) 1 ≥75 % of the surface covered 2 50-74% of the surface covered 3 ≤49% of the surface covered
- 95. 3. FEED DISTRIBUTION Scoring the Feed Distribution Area (% of the water surface area covered) Grow out and fish cages Score Grow out and fish cages Feed distribution area (% of the water surface area covered) 1 ≥75 % of the surface covered 2 50-74% of the surface covered 3 ≤49% of the surface covered
- 96. 4. CRUDE PROTEIN Scoring the Crude Protein (%) Hatchery/Broodstock Score Hatchery/Broodstock Crude protein (%) 1 32 - 40% 2 28 - 31% or 41 - 45% 3 ≤ 27% or ≥ 46%
- 97. 4. CRUDE PROTEIN Scoring the Crude Protein (%) Juveniles (0.5 - 20g) Score 0.5 - 5g Crude protein (%) 5 - 20g Crude protein (%) 1 Data not available Data not available 2 31-35.5% or 49.5-54% 27 - 31% or 44 - 48% 3 < 31% or > 54% < 27% or > 48%
- 98. 4. CRUDE PROTEIN Scoring the Crude Protein (%) Grow out and fish-ponds Score Grow out and fish-ponds Crude protein (%) 1 28 - 35% 2 25 - 27% 3 ≤ 24% or ≥36%
- 99. 4. CRUDE PROTEIN Scoring the Crude Protein (%) Grow out and fish cages Score Grow out and fish cages Crude protein (%) 1 32 - 35% 2 24 - 31% 3 ≤ 23% or ≥ 36%
- 100. 5. CONDITION FACTOR Scoring the Condition factor (K) Body condition factor (k) = (100 x (weight [g] / total length [cm]3)) Grow out and fish-ponds Score Grow out and fish-ponds Condition factor (K) 1 1.6 - 1.9 2 1.1 - 1.5 or 2.0 - 2.3 3 ≤ 1.0 or ≥ 2.4
- 101. 5. CONDITION FACTOR Grow out and fish cages Score Grow out and fish cages Condition factor (K) 1 1.6 - 1.9 2 1.1 - 1.5 or 2.0 - 2.3 3 ≤ 1.0 or ≥ 2.4 Scoring the Condition factor (K) Body condition factor (k) = (100 x (weight [g] / total length [cm]3))
- 102. 6. FEED CONVERSION RATIO Scoring the Feed Conversion Ratio (FCR) Nursery/Juveniles 2g Score Nursery/Juveniles 2g Feed Conversion Ratio (FCR) 1 0.7 - 1.1 2 0.6 - 0.7 or 1.1 - 1.2 3 < 0.6 or > 1.2
- 103. 6. FEED CONVERSION RATIO Scoring the Feed Conversion Ratio (FCR) Grow out and fish-ponds Score Grow out and fish-ponds Feed Conversion Ratio (FCR) 1 ≤ 1.6 2 1.7 – 1.9 3 ≥ 2.0
- 104. 6. FEED CONVERSION RATIO Scoring the Feed Conversion Ratio (FCR) Grow out and fish cages Score Grow out and fish cages Feed Conversion Ratio (FCR) 1 ≤ 2 2 2.1 – 2.5 3 ≥ 2.6
- 105. TILAPIA ARE NOW FARMED IN A VARIETY OF HUSBANDRY SYSTEMS: 1. Cages 2. Bio flocs 3. RAS (Recirculatory Aquaculture System) 4. Raceways 5. IPRS (In-pond Raceway System) 6. Aquaponics 7. Ponds
- 106. WATER QUALITY IN TILAPIA CULTURE Temperature Tilapia are tropical fish that prefer higher temperatures between 25 and 32 o C. What does it mean to be an ectotherm? For tilapia and other fish, being an ectotherm means that the higher the water temperature (within the limits of comfort for each species), the more intense respiration, digestion, nutrient uptake, and excretion (that is, all metabolic activities) will be. When temperature increases, this means that the fish will: 1. Eat more 2. Need more oxygen to breath 3. Release more feces into the water 4. Release more carbon dioxide into the water 5. Grow more in less time, this means the growth rate increases
- 107. WATER QUALITY IN TILAPIA CULTURE Temperature Tilapia are tropical fish that prefer higher temperatures between 25 and 32 o C How to measure the water temperature? Use a thermometer Thermometers are very cheap. Dip the thermometer into the water, wait a few seconds and read the values while the thermometer is still submerged and record the results in a table. This method will only allow you to measure the temperature at the surface. Use an oximeter The easiest way to measure temperature at different depths is to use an oximeter, which measures temperature and oxygen. Oximeters can be bought with several meter cables which should be enough to measure oxygen at different temperatures. van Dorn bottle Use a van Dorn bottle to sample the water at different depths and then measure the temperature. A van Dorn bottle is a special bottle that opens to collect the water at a specific depth and then closes before it is lifted to reach the surface. Once the water has been collected at the desired depth, the temperature is immediately measured with a thermometer and the result is recorded in a table.
- 108. WATER QUALITY IN TILAPIA CULTURE Dissolved Oxygen The ideal concentration of dissolved oxygen (DO) for tilapia is between 70-95% (equivalent to about 5.8 to 7.8 mg/L in water at 25 o C DO). When the concentration of dissolved oxygen reaches 45 to 50% of saturation (about 3 to 3.5 mg/L at 28-30 o C), tilapia start to reduce their basic activities such as feeding and growth to conserve oxygen. This is why you should never feed tilapia when the oxygen is around 3 mg/L. Oxygen saturation below 39% and above 96% is dangerous for tilapia. Diagram showing a pond with plants at the surface, wind blowing, and decomposition at the bottom. At the surface and above the thermocline there is 100% oxygen saturation. But only 60% saturation below the thermocline.
- 109. THANK TO Barrento, M. Quintiliano, M. 2024. How to improve and assess tilapia welfare: train the trainers online course. [E-Learning] FAI Academy Click to follow the link https://fai.academy/aquaculture/welfare-in-tilapia-production-guideline-series/