Student Voice Survey - Feb08
•Download as PPT, PDF•
2 likes•2,361 views

Student voices from Dr Thomlinson Middle School

Recommended
More Related Content
What's hot
What's hot (20)
Similar to Student Voice Survey - Feb08
Similar to Student Voice Survey - Feb08 (12)
More from Geoprimary
More from Geoprimary (20)
Recently uploaded
Recently uploaded (20)
Student Voice Survey - Feb08
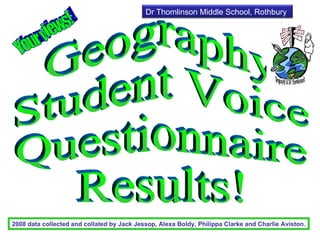
- 1. Geography Student Voice Questionnaire Results! 2008 data collected and collated by Jack Jessop, Alexa Boldy, Philippa Clarke and Charlie Aviston. Your views! Dr Thomlinson Middle School, Rothbury
- 2. Q1&2 Results: What you like about Geography already… Drawing and labelling maps & graphs Visitors coming in Going on field trips, e.g . river work, traffic survey Finding out how different people live (esp. Brazil & Egypt) Learning about Climate Change Making posters Using I.T. Making notes from videos Field sketches
- 3. Q3 Results: What you would like more of in Geography… More map work More different activities More field trips More fun games that help learning More practical work More posters / art More internet More Power-Points More about the environment More visitors in
- 4. Q4 Results: What you would like less of in Geography… Less map work Talk less Less working from text books Less sitting down Less worksheets Less written work
- 5. Q7 Results: How we could improve the Geography Student Voice Board… Display children’s work Different maps More colourful / eye-catching More interesting facts Say what each year group is doing – look on the wall opposite the SV board! LT More competitions Snappy slogans rather than longer written pieces Suggestions for lessons