Representing systemic and novel approach to assess region-specific drought adaptation in peanut to accelerate crop improvement program
•
0 likes•21 views

In Ethiopia, peanut is a food, feed and cash crop. The national mean yield is 1.75 tons/ ha, and the total area under peanut production is 81,848 ha (FAOSTAT, 2019). Babile and Fedis districts, in the Eastern region of Ethiopia are popular for peanut production. Recurrent drought is one of the major production constraints in the region. The water-deficit stress pattern (duration, time and extent) at Babile and Fedis districts was determined using the 31-years historical graded weather data of target environments of Ethiopia. Based on this the planting window at Patancheru and water deficit stress were decided to mimic pattern of the target environments using lysimeters.
Recommended

Recommended
More Related Content
What's hot
What's hot (7)
Similar to Representing systemic and novel approach to assess region-specific drought adaptation in peanut to accelerate crop improvement program
Similar to Representing systemic and novel approach to assess region-specific drought adaptation in peanut to accelerate crop improvement program (20)
More from ICRISAT
More from ICRISAT (20)
Recently uploaded
Recently uploaded (20)
Representing systemic and novel approach to assess region-specific drought adaptation in peanut to accelerate crop improvement program
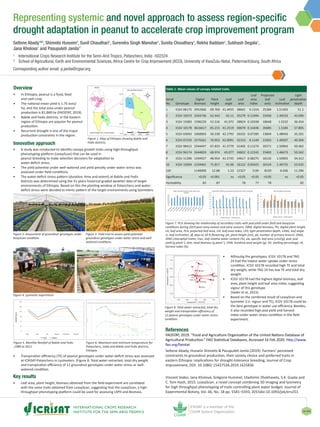
- 1. Representing systemic and novel approach to assess region-specific drought adaptation in peanut to accelerate crop improvement program Feb 2020 1. International Crops Research Institute for the Semi-Arid Tropics, Patancheru, India -502324 2. School of Agricultural, Earth and Environmental Sciences, Africa Centre for Crop Improvement (ACCI), University of KwaZulu-Natal, Pietermaritzburg, South Africa Seltene Abady12 , Shimelis Hussein2 , Sunil Chaudhari1 , Surendra Singh Manohar1 , Sunita Choudhary1 , Rekha Baddam1 , Subhash Degala1 , Jana Kholova1 and Pasupuleti Janila1* Corresponding author email: p.janila@cgiar.org Overview • In Ethiopia, peanut is a food, feed and cash crop. • The national mean yield is 1.75 tons/ ha, and the total area under peanut production is 81,848 ha (FAOSTAT, 2019). • Babile and Fedis districts, in the Eastern region of Ethiopia are popular for peanut production. • Recurrent drought is one of the major production constraints in the region. Innovative approach Figure 1. Map of Ethiopia showing Babile and Fedis districts. • A study was conducted to identify canopy growth traits using high-throughput phenotyping platform (LeasyScan) that can be used in peanut breeding to make selection decisions for adaptation to water-deficit stress. • The yield potential under well-watered and yield penalty under water stress was assessed under field conditions. • The water-deficit stress pattern (duration, time and extent) at Babile and Fedis districts was determined using the 31-years historical graded weather data of target environments of Ethiopia. Based on this the planting window at Patancheru and water- deficit stress were decided to mimic pattern of the target environments using lysimeters. Figure 2. Assessment of groundnut genotypes under leasyScan condition. Figure 3. Field trial to assess yield potential groundnut genotypes under water stress and well- watered conditions. Figure 4. Lysimeter experiment. Figure 5. Monthly Rainfall of Babile and Fedis ,1980 to 2011. • Althouhg the genotypes, ICGV 10178 and TAG 24 had the lowest water uptake under stress condition, ICGV 10178 recorded high TE and total dry weight, while TAG 24 has low TE and total dry weight. • ICGV 10178 had the highest digital biomass, leaf area, plant height and leaf area index, suggesting vigour of this genotype (Vader et al, 2015). • Based on the combined result of LeasyScan and lysimeter (i.e. vigour and TE), ICGV 10178 could be the best genotype in water use efficiency. Besides, it also recorded high pod yield and harvest index under water stress condition in the field experiment. Figure 6. Maximum and minimum temperature for Patancheru, India and Babile and Fedis districts, Ethiopia. Figure 7. PCA showing the relationship of secondary traits with pod yield under field and leasyScan conditions during 2019 post-rainy season and rainy seasons. DBM, digital biomass, PH, digital plant height, LA, leaf area, PLA, projected leaf area, LAI, leaf area index, LPD, light penetration depth, LANG, leaf angle, LI, leaf inclination, df, days to 50 % flowering, ph, plant height (cm), pb, number of primary branch, SPAD, SPAD chlorophyll meter, lrwc, leaf relative water content (%), sla, specific leaf area (cm2/g), pod, pod yield (g plant-1 ), tbm, total biomass (g plant-1 ), HSW, hundred seed weight (g), SH, shelling percentage, HI, harvest index (%). Figure 8. Total water extracted, total dry weight and transpiration efficiency of 12 peanut genotypes under water stress condition. • Transpiration efficiency (TE) of peanut genotypes under water-deficit stress was assessed at ICRISAT-Patancheru in Lysimeters. (Figure 8. Total water extracted, total dry weight and transpiration efficiency of 12 groundnut genotypes under water stress or well- watered condition. Key results • Leaf area, plant height, biomass obtained from the field experiment are correlated with the same traits obtained from LeasyScan, suggesting that the LeasyScan, a high- throughput phenotyping platform could be used for assessing LSPH and Biomass. Table 1. Mean values of canopy related traits. Serial No. Genotype Digital Biomass Plant height Leaf angle Leaf area Leaf area Index Projected leaf area Leaf inclination Light penetration depth 1 ICGV 06175 2952666 69.769 41.4455 38661 0.1316 25384 1.51303 51.1 2 ICGV 10373 2343736 62.443 42.11 35279 0.12494 23436 1.49233 43.096 3 ICGV 15083 1596220 52.516 41.072 28824 0.10338 18648 1.5232 36.454 4 ICGV 10178 3616617 85.215 41.2519 40670 0.14436 26685 1.5184 57.805 5 ICGV 03042 1060003 50.238 42.2792 20325 0.07285 13844 1.48943 35.201 6 ICGV 07220 2375561 70.953 42.0091 32153 0.1149 21055 1.49507 49.304 7 ICGV 98412 2344447 67.833 41.5779 31405 0.11274 20271 1.50963 50.462 8 ICGV 96174 2644829 68.974 43.077 34832 0.12242 23403 1.46673 50.562 9 ICGV 11396 1294927 48.954 41.5735 24617 0.08275 16132 1.50903 34.312 10 ICGV 15094 1234461 71.817 41.96 16122 0.05425 10124 1.49725 53.932 LSD 1140000 12.88 1.23 12327 0.04 8159 0.036 11.296 Significance 0.05 0.001 ns 0.05 0.05 0.05 ns 0.05 Heritability 82 87 78 77 78 82 References FAOSTAT, 2019. “Food and Agriculture Organization of the United Nations Database of Agricultural Production.” FAO Statistical Databases, Accessed 16 Feb 2020. http://www. fao.org/faostat Seltene Abady, Hussein Shimelis Pasupuleti Janila (2019): Farmers’ perceived constraints to groundnut production, their variety choice and preferred traits in eastern Ethiopia: implications for drought-tolerance breeding, Journal of Crop Improvement, DOI: 10.1080/ 15427528.2019.1625836 Vincent Vadez, Jana Kholová, Grégoire Hummel, Uladzimir Zhokhavets, S.K. Gupta and C. Tom Hash, 2015. LeasyScan: a novel concept combining 3D imaging and lysimetry for high throughput phenotyping of traits controlling plant water budget. Journal of Experimental Botany, Vol. 66, No. 18 pp. 5581–5593, 2015doi:10.1093/jxb/erv251