Recommended

Recommended
More Related Content
Similar to Murphy Ro - TRB 2024 - FPSM Modeling of LCFS Targets.pptx
Similar to Murphy Ro - TRB 2024 - FPSM Modeling of LCFS Targets.pptx (20)
More from UC Davis Policy Institute & UC Davis Institute of Transportation Studies
More from UC Davis Policy Institute & UC Davis Institute of Transportation Studies (6)
Recently uploaded
Recently uploaded (20)
Murphy Ro - TRB 2024 - FPSM Modeling of LCFS Targets.pptx
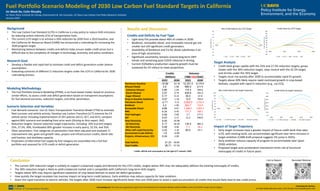
- 1. Target Analysis • Credit bank grows rapidly with the 25% and 27.5% reduction targets, grows slower with the 30% reduction target, stays neutral with the 32.5% target, and shrinks under the 35% target. • Targets must rise quickly after 2030 to accommodate rapid EV growth. • Targets above 30% likely require rapid continued growth in crop-based biofuels, coupled with rapid CI reduction (e.g., via CCS). Impact of Target Trajectory • Early target increases have a greater impact of future credit bank than later. • LCFS, with existing bank, can accommodate significant near-term increase in target ambition (CARB draft proposal suggests 5% jump in 2025). • Early ambition reduces capacity of program to accommodate later (post- 2030) ambition. • Proposed target auto-acceleration mechanism limits risk of structural oversupply of credits in future years. Fuel Portfolio Scenario Modeling of 2030 Low Carbon Fuel Standard Targets in California Jin Wook Ro, Colin Murphy UC Davis Policy Institute for Energy, Environment & the Economy; UC Davis Low Carbon Fuel Policy Research Initiative January 2024 Contacting the Authors: Jin Wook Ro(jwro@ucdavis.edu), Colin Murphy (cwmurphy@ucdavis.edu) Background • The Low Carbon Fuel Standard (LCFS) in California is a key policy to reduce GHG emissions by reducing carbon intensity (CIs) of transportation fuels. • The current LCFS target is to achieve a 20% reduction by 2030 from a 2010 baseline, and the California Air Resources Board (CARB) has announced a rulemaking for increasing the 2030 program target. • Maintaining balance between credits and deficits helps ensure stable credit prices but is difficult due to the complexity of changes in technology, economy, and policy conditions. Research Goal • Develop a flexible and rapid tool to estimate credit and deficit generation under diverse assumptions. • Evaluating scenarios of different CI reduction targets under the LCFS in California for 2030 rulemaking process. Modeling Methodology • The Fuel Portfolio Scenario Modeling (FPSM), is an Excel-based model, based on previous similar efforts, to assess credit and deficit generation based on transparent assumptions for fuel demand scenarios, reduction targets, and other parameters. Scenario Selection and Variables • Fuel demand scenarios: Use UC Davis Transportation Transition Model (TTM) to estimate fleet turnover and vehicle activity. Develop Low Carbon Transition (LCT) scenario for CA vehicle sector including implementation of ZEV policies (ACC2, ACT, and ACF); compare against BAU scenario and modeling from prior work (Driving to Zero report, DtZ). • Reduction targets: Several reduction target trajectories, including: 20% (current target), 25%, 27.5%, 30%, frontloaded 30% (greater increase in early years), 32.5%, and 35%. • Other parameters: Five categories of parameters have been adjusted and analyzed: CI improvement rate, goals and growth rates, project and infrastructure credits, blend rate and fraction, and distillates capacity. • Projections of alternative fuel supply by fuel category are assembled into a full fuel portfolio and assessed for LCFS credit or deficit generation. Conclusion • The current 20% reduction target is unlikely to support a balanced supply and demand for the LCFS credits, targets below 30% may not adequately address the existing oversupply of credits. • The 30% reduction target is likely to yield a balanced market and is compatible with California’s long-term GHG targets. • Targets above 30% may require significant expansion of crop-based biofuels to avoid net deficit generation. • How quickly the target escalates has massive impact on long-term credit balance. Early ambition may reduce capacity for later ambition. • Given the rapid transition to electric vehicles, the targets after 2030 must increase significantly faster than pre-2030 pace to avoid a rapid accumulation of credits that would likely lead to low credit prices. -20 -15 -10 -5 0 5 10 15 20 2020 2025 2030 2035 Credits (MMT CO 2 e) Net Credit Balance by LCFS Target 25% 27.5% 30% 32.5% 35% -40 -20 0 20 40 60 80 100 120 140 160 2020 2025 2030 2035 Credit bank (MMT CO 2 e) Credit Bank by LCFS Target 25% 27.5% 30% 32.5% 35% -8.0 -6.0 -4.0 -2.0 0.0 2.0 4.0 6.0 8.0 10.0 2023 2026 2029 2032 2035 Credits (MMT CO 2 e) Net credit balance by target trajectory LCT 30% LCT 30% Frontload DtZ 30% DtZ 30% Frontload 0.0 10.0 20.0 30.0 40.0 50.0 60.0 70.0 2023 2026 2029 2032 2035 Credit bank (MMT CO 2 e) Credit bank by target trajectory LCT 30% LCT 30% Frontload DtZ 30% DtZ 30% Frontload Credits, deficits and consumption by fuel type (LCT scenario, 30%) Credits (Million) Volumes (‘000 DGE/GGE) 2022 2030 2022 2030 Petroleum Gasoline -16.68 -32.76 12,331.0 8,779.9 Ethanol (Total) 3.6 1.98 990.5 677.9 Cellulosic Ethanol 0.86 1.04 114.4 204.6 Starch Ethanol 2.57 0.79 839.6 435.4 Sugar Ethanol 0.17 0.15 36.5 37.9 Drop-in Gasoline Substitute 0.07 1.18 12.0 256.0 Petroleum Diesel -2.71 -7.11 2,005.0 1,755.4 Biodiesel 2.2 1.09 263.7 172.9 Renewable Diesel 9.66 4.97 1,344.1 1,097.1 RNG 4.34 6.45 171.7 169.1 Total Hydrogen 0.06 2.68 2.7 177.1 SAF 0.07 2.17 12.3 540.0 Total Electricity 6.45 24.98 LD Electricity 4.17 18.34 130.5 685.3 HD Electricity 0.06 4.46 1.1 95.2 Other (off-road) Electricity 2.22 2.18 80.0 97.7 Incremental Crude Deficits -1.6 -0.98 Projects, Infrastructure, CCS 0.24 2.00 Total Deficits 21.23 40.85 Total Credits 26.71 47.50 Results and Discussion Credits and Deficits by Fuel Type • Light-duty EVs provide about 40% of credits in 2030. • Biodiesel, renewable diesel, and renewable natural gas are smaller but still significant credit generators. • Availability of feedstock and CIs for diesel substitutes is an area of high uncertainty. • Significant uncertainty remains around long term VMT trends and remaining post-COVID rebound in driving. • Current EV/battery production capacity growth must be sustained for EV rollout to meet projections. Link to Report: Recorded Webinar: Acknowledgment: This work was supported by a grant from the CA Resilient and Innovative Mobility Initiative (RIMI) as well as the STEPS+ Energy Futures Program.