SlideShare a Scribd company logo
1 of 34
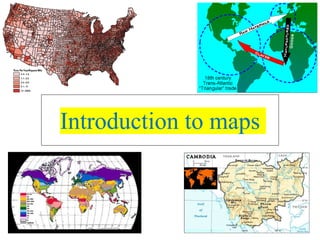
Introduction to maps
What is a map?
• A generalized view of an area, usually some
portion of Earth’s surface, as seen from
above at a greatly reduced size
• Any geographical image of the environment
• A two-dimensional representation of the
spatial distribution of selected phenomena
Why make maps?
• To represent a larger area than we can see
• To show a phenomenon or process we can’t
see with our eyes
• To present information concisely
• To show spatial relationships
Represent a larger area
Show
what
we
can’t
see
Present info concisely
Show spatial
relationships
How do we read maps?
• Maps are selective views of reality
• Size of the map relative to reality (scale)
• What’s on the map (symbolization)
• Shape of the map (projection)
Map scale
• Ratio of the distance on the map to the
distance on the ground
• Scale is a fraction
• Larger area covered means larger
denominator
• Larger denominator means smaller fraction
• So a large-scale map covers a small area
Large-scale
Small-scale
Map scale
• Ratio of the distance on the map to the
distance on the ground
1. Graphic:
• Stays the same when photocopied
• Might not be right for the whole map
Map scale
2. Verbal:
1 inch equals 10 miles
• Easy to understand
• Can change if photocopied
Map scale
3. Representative fraction or ratio:
1:24,000
• Units don’t matter
• Can change if photocopied
Map symbolization
• Symbols are a code instead of text
• Three kinds: point, line, area
• Consider shape, size, orientation, pattern,
color, value
Point symbols
• Every symbol counts as one occurrence
• Qualitative points
– Indicate location
– Can also describe that location
• Quantitative points
– Show a distribution
– Indicate a value (graduated symbols)
Area symbols
• Each territory or region has one value
• Differences in kind
• Differences in value
– Choropleth maps
– Usually, darker indicates more
• Cartograms distort area to show value
Differences in kind
Differences in kind
Differences in value
(Choropleth)
Cartogram
Topographic maps
• Also called quadrangles
• Nearly 54,000 for the U.S.
• Done by the US Geological Survey
(USGS) since 1897
• Map out the entire country in a standard
fashion
Topographic maps
• Till the 1940s, you climbed to the highest
point and plotted what you could see from
there
• Aerial photography after WWII
• Two overlapping photos are put in a
stereoscope
• 10 photos for each 7.5 minute map
Topographic maps
• Show 2D features, point, line and area;
also show 3D via contour lines
• Common symbols are in the appendix of
the text
• Note the contour interval at the bottom of
the map
Map-reading exercise

More Related Content

Similar to Introduction to geological maps and geomorpholgy

GEOG101 Chapt02 lecture
GEOG101 Chapt02 lectureGEOG101 Chapt02 lecture
GEOG101 Chapt02 lectureRichard Smith
 
1605005768-topograph (1).pdf
1605005768-topograph (1).pdf1605005768-topograph (1).pdf
1605005768-topograph (1).pdfshucaybcabdi
 
MAP PROJECTION
MAP PROJECTIONMAP PROJECTION
MAP PROJECTIONHadi tt
 
Chapter 3 gateway 123
Chapter 3 gateway 123Chapter 3 gateway 123
Chapter 3 gateway 123MissST
 
Distribution maps
Distribution mapsDistribution maps
Distribution mapsivisdude82
 
Combined gis 2(GEOGRAPHIC INFORMATION SYSTEM)
Combined gis 2(GEOGRAPHIC INFORMATION SYSTEM)Combined gis 2(GEOGRAPHIC INFORMATION SYSTEM)
Combined gis 2(GEOGRAPHIC INFORMATION SYSTEM)musadoto
 
Cartography lec #4
Cartography lec #4Cartography lec #4
Cartography lec #4Nazir Ahmed
 
BOLTSS - Mapping Geography
BOLTSS - Mapping GeographyBOLTSS - Mapping Geography
BOLTSS - Mapping GeographyYaryalitsa
 
Map projections and its types explanation and examples.pptx
Map projections and its types explanation and examples.pptxMap projections and its types explanation and examples.pptx
Map projections and its types explanation and examples.pptxChShakeelAhmedMayo
 
Surveying II ajith sir class 1
Surveying II ajith sir class 1Surveying II ajith sir class 1
Surveying II ajith sir class 1SHAMJITH KM
 
Interpreting maps
Interpreting mapsInterpreting maps
Interpreting mapsrrodri37
 
ch5-georeferencing.ppt
ch5-georeferencing.pptch5-georeferencing.ppt
ch5-georeferencing.pptNaglaaFathy42
 

Similar to Introduction to geological maps and geomorpholgy (20)

GEOG101 Chapt02 lecture
GEOG101 Chapt02 lectureGEOG101 Chapt02 lecture
GEOG101 Chapt02 lecture
 
GEOG101 Chapter 2 Lecture
GEOG101 Chapter 2 LectureGEOG101 Chapter 2 Lecture
GEOG101 Chapter 2 Lecture
 
1605005768-topograph (1).pdf
1605005768-topograph (1).pdf1605005768-topograph (1).pdf
1605005768-topograph (1).pdf
 
Orienteering
Orienteering Orienteering
Orienteering
 
Parts of a map
Parts of a mapParts of a map
Parts of a map
 
MAP PROJECTION
MAP PROJECTIONMAP PROJECTION
MAP PROJECTION
 
Chapter 3 gateway 123
Chapter 3 gateway 123Chapter 3 gateway 123
Chapter 3 gateway 123
 
Distribution maps
Distribution mapsDistribution maps
Distribution maps
 
Combined gis 2(GEOGRAPHIC INFORMATION SYSTEM)
Combined gis 2(GEOGRAPHIC INFORMATION SYSTEM)Combined gis 2(GEOGRAPHIC INFORMATION SYSTEM)
Combined gis 2(GEOGRAPHIC INFORMATION SYSTEM)
 
Mapping space around us
Mapping space around usMapping space around us
Mapping space around us
 
Cartography lec #4
Cartography lec #4Cartography lec #4
Cartography lec #4
 
Mapping concepts unit II
Mapping concepts unit IIMapping concepts unit II
Mapping concepts unit II
 
BOLTSS - Mapping Geography
BOLTSS - Mapping GeographyBOLTSS - Mapping Geography
BOLTSS - Mapping Geography
 
Maps
Maps Maps
Maps
 
What is Map.pptx
What is Map.pptxWhat is Map.pptx
What is Map.pptx
 
What is Map.pptx
What is Map.pptxWhat is Map.pptx
What is Map.pptx
 
Map projections and its types explanation and examples.pptx
Map projections and its types explanation and examples.pptxMap projections and its types explanation and examples.pptx
Map projections and its types explanation and examples.pptx
 
Surveying II ajith sir class 1
Surveying II ajith sir class 1Surveying II ajith sir class 1
Surveying II ajith sir class 1
 
Interpreting maps
Interpreting mapsInterpreting maps
Interpreting maps
 
ch5-georeferencing.ppt
ch5-georeferencing.pptch5-georeferencing.ppt
ch5-georeferencing.ppt
 

Recently uploaded

Organic Name Reactions for the students and aspirants of Chemistry12th.pptx
Organic Name Reactions  for the students and aspirants of Chemistry12th.pptxOrganic Name Reactions  for the students and aspirants of Chemistry12th.pptx
Organic Name Reactions for the students and aspirants of Chemistry12th.pptxVS Mahajan Coaching Centre
 
Paris 2024 Olympic Geographies - an activity
Paris 2024 Olympic Geographies - an activityParis 2024 Olympic Geographies - an activity
Paris 2024 Olympic Geographies - an activityGeoBlogs
 
The Most Excellent Way | 1 Corinthians 13
The Most Excellent Way | 1 Corinthians 13The Most Excellent Way | 1 Corinthians 13
The Most Excellent Way | 1 Corinthians 13Steve Thomason
 
Kisan Call Centre - To harness potential of ICT in Agriculture by answer farm...
Kisan Call Centre - To harness potential of ICT in Agriculture by answer farm...Kisan Call Centre - To harness potential of ICT in Agriculture by answer farm...
Kisan Call Centre - To harness potential of ICT in Agriculture by answer farm...Krashi Coaching
 
mini mental status format.docx
mini    mental       status     format.docxmini    mental       status     format.docx
mini mental status format.docxPoojaSen20
 
Measures of Central Tendency: Mean, Median and Mode
Measures of Central Tendency: Mean, Median and ModeMeasures of Central Tendency: Mean, Median and Mode
Measures of Central Tendency: Mean, Median and ModeThiyagu K
 
POINT- BIOCHEMISTRY SEM 2 ENZYMES UNIT 5.pptx
POINT- BIOCHEMISTRY SEM 2 ENZYMES UNIT 5.pptxPOINT- BIOCHEMISTRY SEM 2 ENZYMES UNIT 5.pptx
POINT- BIOCHEMISTRY SEM 2 ENZYMES UNIT 5.pptxSayali Powar
 
Introduction to AI in Higher Education_draft.pptx
Introduction to AI in Higher Education_draft.pptxIntroduction to AI in Higher Education_draft.pptx
Introduction to AI in Higher Education_draft.pptxpboyjonauth
 
Software Engineering Methodologies (overview)
Software Engineering Methodologies (overview)Software Engineering Methodologies (overview)
Software Engineering Methodologies (overview)eniolaolutunde
 
Mastering the Unannounced Regulatory Inspection
Mastering the Unannounced Regulatory InspectionMastering the Unannounced Regulatory Inspection
Mastering the Unannounced Regulatory InspectionSafetyChain Software
 
18-04-UA_REPORT_MEDIALITERAСY_INDEX-DM_23-1-final-eng.pdf
18-04-UA_REPORT_MEDIALITERAСY_INDEX-DM_23-1-final-eng.pdf18-04-UA_REPORT_MEDIALITERAСY_INDEX-DM_23-1-final-eng.pdf
18-04-UA_REPORT_MEDIALITERAСY_INDEX-DM_23-1-final-eng.pdfssuser54595a
 
A Critique of the Proposed National Education Policy Reform
A Critique of the Proposed National Education Policy ReformA Critique of the Proposed National Education Policy Reform
A Critique of the Proposed National Education Policy ReformChameera Dedduwage
 
Grant Readiness 101 TechSoup and Remy Consulting
Grant Readiness 101 TechSoup and Remy ConsultingGrant Readiness 101 TechSoup and Remy Consulting
Grant Readiness 101 TechSoup and Remy ConsultingTechSoup
 
Contemporary philippine arts from the regions_PPT_Module_12 [Autosaved] (1).pptx
Contemporary philippine arts from the regions_PPT_Module_12 [Autosaved] (1).pptxContemporary philippine arts from the regions_PPT_Module_12 [Autosaved] (1).pptx
Contemporary philippine arts from the regions_PPT_Module_12 [Autosaved] (1).pptxRoyAbrique
 
Hybridoma Technology ( Production , Purification , and Application )
Hybridoma Technology  ( Production , Purification , and Application  ) Hybridoma Technology  ( Production , Purification , and Application  )
Hybridoma Technology ( Production , Purification , and Application ) Sakshi Ghasle
 
Accessible design: Minimum effort, maximum impact
Accessible design: Minimum effort, maximum impactAccessible design: Minimum effort, maximum impact
Accessible design: Minimum effort, maximum impactdawncurless
 
Q4-W6-Restating Informational Text Grade 3
Q4-W6-Restating Informational Text Grade 3Q4-W6-Restating Informational Text Grade 3
Q4-W6-Restating Informational Text Grade 3JemimahLaneBuaron
 
Interactive Powerpoint_How to Master effective communication
Interactive Powerpoint_How to Master effective communicationInteractive Powerpoint_How to Master effective communication
Interactive Powerpoint_How to Master effective communicationnomboosow
 

Recently uploaded (20)

INDIA QUIZ 2024 RLAC DELHI UNIVERSITY.pptx
INDIA QUIZ 2024 RLAC DELHI UNIVERSITY.pptxINDIA QUIZ 2024 RLAC DELHI UNIVERSITY.pptx
INDIA QUIZ 2024 RLAC DELHI UNIVERSITY.pptx
 
Organic Name Reactions for the students and aspirants of Chemistry12th.pptx
Organic Name Reactions  for the students and aspirants of Chemistry12th.pptxOrganic Name Reactions  for the students and aspirants of Chemistry12th.pptx
Organic Name Reactions for the students and aspirants of Chemistry12th.pptx
 
Paris 2024 Olympic Geographies - an activity
Paris 2024 Olympic Geographies - an activityParis 2024 Olympic Geographies - an activity
Paris 2024 Olympic Geographies - an activity
 
The Most Excellent Way | 1 Corinthians 13
The Most Excellent Way | 1 Corinthians 13The Most Excellent Way | 1 Corinthians 13
The Most Excellent Way | 1 Corinthians 13
 
Kisan Call Centre - To harness potential of ICT in Agriculture by answer farm...
Kisan Call Centre - To harness potential of ICT in Agriculture by answer farm...Kisan Call Centre - To harness potential of ICT in Agriculture by answer farm...
Kisan Call Centre - To harness potential of ICT in Agriculture by answer farm...
 
mini mental status format.docx
mini    mental       status     format.docxmini    mental       status     format.docx
mini mental status format.docx
 
Measures of Central Tendency: Mean, Median and Mode
Measures of Central Tendency: Mean, Median and ModeMeasures of Central Tendency: Mean, Median and Mode
Measures of Central Tendency: Mean, Median and Mode
 
POINT- BIOCHEMISTRY SEM 2 ENZYMES UNIT 5.pptx
POINT- BIOCHEMISTRY SEM 2 ENZYMES UNIT 5.pptxPOINT- BIOCHEMISTRY SEM 2 ENZYMES UNIT 5.pptx
POINT- BIOCHEMISTRY SEM 2 ENZYMES UNIT 5.pptx
 
Introduction to AI in Higher Education_draft.pptx
Introduction to AI in Higher Education_draft.pptxIntroduction to AI in Higher Education_draft.pptx
Introduction to AI in Higher Education_draft.pptx
 
Software Engineering Methodologies (overview)
Software Engineering Methodologies (overview)Software Engineering Methodologies (overview)
Software Engineering Methodologies (overview)
 
Mastering the Unannounced Regulatory Inspection
Mastering the Unannounced Regulatory InspectionMastering the Unannounced Regulatory Inspection
Mastering the Unannounced Regulatory Inspection
 
Staff of Color (SOC) Retention Efforts DDSD
Staff of Color (SOC) Retention Efforts DDSDStaff of Color (SOC) Retention Efforts DDSD
Staff of Color (SOC) Retention Efforts DDSD
 
18-04-UA_REPORT_MEDIALITERAСY_INDEX-DM_23-1-final-eng.pdf
18-04-UA_REPORT_MEDIALITERAСY_INDEX-DM_23-1-final-eng.pdf18-04-UA_REPORT_MEDIALITERAСY_INDEX-DM_23-1-final-eng.pdf
18-04-UA_REPORT_MEDIALITERAСY_INDEX-DM_23-1-final-eng.pdf
 
A Critique of the Proposed National Education Policy Reform
A Critique of the Proposed National Education Policy ReformA Critique of the Proposed National Education Policy Reform
A Critique of the Proposed National Education Policy Reform
 
Grant Readiness 101 TechSoup and Remy Consulting
Grant Readiness 101 TechSoup and Remy ConsultingGrant Readiness 101 TechSoup and Remy Consulting
Grant Readiness 101 TechSoup and Remy Consulting
 
Contemporary philippine arts from the regions_PPT_Module_12 [Autosaved] (1).pptx
Contemporary philippine arts from the regions_PPT_Module_12 [Autosaved] (1).pptxContemporary philippine arts from the regions_PPT_Module_12 [Autosaved] (1).pptx
Contemporary philippine arts from the regions_PPT_Module_12 [Autosaved] (1).pptx
 
Hybridoma Technology ( Production , Purification , and Application )
Hybridoma Technology  ( Production , Purification , and Application  ) Hybridoma Technology  ( Production , Purification , and Application  )
Hybridoma Technology ( Production , Purification , and Application )
 
Accessible design: Minimum effort, maximum impact
Accessible design: Minimum effort, maximum impactAccessible design: Minimum effort, maximum impact
Accessible design: Minimum effort, maximum impact
 
Q4-W6-Restating Informational Text Grade 3
Q4-W6-Restating Informational Text Grade 3Q4-W6-Restating Informational Text Grade 3
Q4-W6-Restating Informational Text Grade 3
 
Interactive Powerpoint_How to Master effective communication
Interactive Powerpoint_How to Master effective communicationInteractive Powerpoint_How to Master effective communication
Interactive Powerpoint_How to Master effective communication
 

Introduction to geological maps and geomorpholgy

  • 2. What is a map? • A generalized view of an area, usually some portion of Earth’s surface, as seen from above at a greatly reduced size • Any geographical image of the environment • A two-dimensional representation of the spatial distribution of selected phenomena
  • 3. Why make maps? • To represent a larger area than we can see • To show a phenomenon or process we can’t see with our eyes • To present information concisely • To show spatial relationships
  • 8. How do we read maps? • Maps are selective views of reality • Size of the map relative to reality (scale) • What’s on the map (symbolization) • Shape of the map (projection)
  • 9. Map scale • Ratio of the distance on the map to the distance on the ground • Scale is a fraction • Larger area covered means larger denominator • Larger denominator means smaller fraction • So a large-scale map covers a small area
  • 10.
  • 12. Map scale • Ratio of the distance on the map to the distance on the ground 1. Graphic: • Stays the same when photocopied • Might not be right for the whole map
  • 13. Map scale 2. Verbal: 1 inch equals 10 miles • Easy to understand • Can change if photocopied
  • 14. Map scale 3. Representative fraction or ratio: 1:24,000 • Units don’t matter • Can change if photocopied
  • 15. Map symbolization • Symbols are a code instead of text • Three kinds: point, line, area • Consider shape, size, orientation, pattern, color, value
  • 16. Point symbols • Every symbol counts as one occurrence • Qualitative points – Indicate location – Can also describe that location • Quantitative points – Show a distribution – Indicate a value (graduated symbols)
  • 17.
  • 18.
  • 19.
  • 20.
  • 21.
  • 22.
  • 23.
  • 24.
  • 25. Area symbols • Each territory or region has one value • Differences in kind • Differences in value – Choropleth maps – Usually, darker indicates more • Cartograms distort area to show value
  • 30. Topographic maps • Also called quadrangles • Nearly 54,000 for the U.S. • Done by the US Geological Survey (USGS) since 1897 • Map out the entire country in a standard fashion
  • 31. Topographic maps • Till the 1940s, you climbed to the highest point and plotted what you could see from there • Aerial photography after WWII • Two overlapping photos are put in a stereoscope • 10 photos for each 7.5 minute map
  • 32. Topographic maps • Show 2D features, point, line and area; also show 3D via contour lines • Common symbols are in the appendix of the text • Note the contour interval at the bottom of the map
  • 33.