EMBODO LP Grade 12 Mean and Variance of the Sampling Distribution of the Sample Means.docx
•Download as DOCX, PDF•
0 likes•37 views

This is a detailed lesson plan on Mean and Variance of the sampling distribution of the sample means using 3Is Method.

Recommended
Recommended
More Related Content
Similar to EMBODO LP Grade 12 Mean and Variance of the Sampling Distribution of the Sample Means.docx
Similar to EMBODO LP Grade 12 Mean and Variance of the Sampling Distribution of the Sample Means.docx (20)
More from Elton John Embodo
More from Elton John Embodo (20)
Recently uploaded
Recently uploaded (20)
EMBODO LP Grade 12 Mean and Variance of the Sampling Distribution of the Sample Means.docx
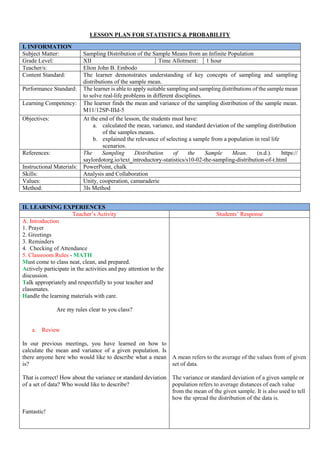
- 1. LESSON PLAN FOR STATISTICS & PROBABILITY I. INFORMATION Subject Matter: Sampling Distribution of the Sample Means from an Infinite Population Grade Level: XII Time Allotment: 1 hour Teacher/s: Elton John B. Embodo Content Standard: The learner demonstrates understanding of key concepts of sampling and sampling distributions of the sample mean. Performance Standard: The learner is able to apply suitable sampling and sampling distributions of the sample mean to solve real-life problems in different disciplines. Learning Competency: The learner finds the mean and variance of the sampling distribution of the sample mean. M11/12SP-IIId-5 Objectives: At the end of the lesson, the students must have: a. calculated the mean, variance, and standard deviation of the sampling distribution of the samples means. b. explained the relevance of selecting a sample from a population in real life scenarios. References: The Sampling Distribution of the Sample Mean. (n.d.). https:// saylordotorg.io/text_introductory-statistics/s10-02-the-sampling-distribution-of-t.html Instructional Materials: PowerPoint, chalk Skills: Analysis and Collaboration Values: Unity, cooperation, camaraderie Method: 3Is Method II. LEARNING EXPERIENCES Teacher’s Activity Students’ Response A. Introduction 1. Prayer 2. Greetings 3. Reminders 4. Checking of Attendance 5. Classroom Rules - MATH Must come to class neat, clean, and prepared. Actively participate in the activities and pay attention to the discussion. Talk appropriately and respectfully to your teacher and classmates. Handle the learning materials with care. Are my rules clear to you class? a. Review In our previous meetings, you have learned on how to calculate the mean and variance of a given population. Is there anyone here who would like to describe what a mean is? That is correct! How about the variance or standard deviation of a set of data? Who would like to describe? Fantastic! A mean refers to the average of the values from of given set of data. The variance or standard deviation of a given sample or population refers to average distances of each value from the mean of the given sample. It is also used to tell how the spread the distribution of the data is.
- 2. b. motivation You have also learned class that from the given population, we can derive several sample means based on a certain condition through following some indicated steps. But how about if the given population is infinite? How do you derive the sample means? And how do we calculate the mean, variance, and standard deviation of the sampling distribution of sample means from an infinite population? B. Interaction To answer my questions, be with me this morning as I discuss to you the sampling distribution of the sample means from an infinite population. Everybody read! Statement of the Aim Listen attentively since you are expected to achieve these objectives. Can somebody read? In determining the number of samples from an infinite population, we can repeat selecting the same values. This is since with replacement is allowed. For us to be guided, here are the formulas and steps in finding the mean, variance, and standard deviation of the sampling distribution of the sample means Formulas Sampling Distribution of The Sample Means from An Infinite Population. Objectives: a. calculate the mean, variance, and standard deviation of the sampling distribution of the samples means. b. explain the relevance of selecting a sample from a population in real life scenarios. 1. n N - number of samples with replacement (infinite population) 2. ( ) x x P x - mean of the sampling distribution of the sample means 3. 2 2 ( ) ( ) x x P x x - variance of the sampling distribution of the sample means
- 3. Steps Giving of Examples Example 1 Since the population is infinite, we can repeat or replace a value with itself. So, what is the first step to follow? What is then the number of samples using the formula n N ? Based on the next step, what shall we do? Determine the number of samples using the formula n N . 2 3 9 n N There are 9 possible number of samples with size 2 from the given population. 1. List all the possible samples and their corresponding means. 1. Determine the number of samples using the formula n N . 2. List all the possible samples and their corresponding means. 3. Construct the sampling distribution of the means. 4. Compute the mean of the sampling distribution of the sample means. a. Multiple the sample mean by the corresponding probability b. Add the results 5. Compute the variance of the sampling distribution of the sample means. a. Subtract the sample means x from each sample X. Label this as x X . b. Square the difference x X c. Multiply the results by the corresponding probability. Label this as 2 ( ) ( ) x P x x . d. Add the results 1. A population consists of three numbers (2, 4, 6). Consider all possible samples of size 2 which can be drawn with replacement from the population.
- 4. The next step to take is to construct a sampling distribution of the means. The first column must be the list of distinct means, the second column should be the frequency and the third column is the probability of each mean. After obtaining the sampling distribution of the sample means, what is the next thing to do? Very good! Since we have already obtained the mean of the sampling distribution of the sample means, what is then the next step to take? Samples Means (2,2) 2 (2,4) 3 (2,6) 4 (4,4) 4 (4,2) 3 (4,6) 5 (6,6) 6 (6,2) 4 (6,4) 5 Mean: Add the elements of the sample and divide by their number. Sample Mean X Frequency Probability P(X) 2 1 1/9 3 2 2/9 4 3 3/9 5 2 2/9 6 1 1/9 Total 9 1 Probability: Divide the frequency of the each mean by the total amount of frequency. We will compute the mean of the sampling distribution of the sample means using the formula ( ) x x P x Where x is the sample mean and P(x) is its corresponding probability. Sample Mean X Probability P(X) X ∙ P(X) 2 1/9 0.22 3 2/9 0.67 4 3/9 1.33 5 2/9 1.11 6 1/9 0.67 Total 4 ( ) x x P x = 4 Compute the variance of the sampling distribution of the sample means using the formula which is 2 2 ( ) ( ) x x P x x
- 5. Collaborative Activities Here are the mechanics for the group the activity. Everybody read! For next example, I am going to group you into two groups. Here is the mechanics, everybody read! Group Activity Example 2 a. Subtract the sample means x from each sample X. Label this as x X . b. Square the difference x X c. Multiply the results by the corresponding probability. Label tis as 2 ( ) ( ) x P x x . d. Add the results. X P(X) X-Mx (X-Mx)2 P(X) ∙ (X-Mx)2 2 1/9 -2 4 0.44 3 2/9 -1 1 0.22 4 3/9 0 0 0 5 2/9 1 1 0.22 6 1/9 2 4 0.44 Total 1.32 2 2 ( ) ( ) x x P x x = 1.32 Thus, the standard deviation is 2 x = 1.15 1. The class will be divided into two groups. 2. Each group will be given with different problems to be solved in 10 minutes. 3. The group which can finish solving the problem first with correct solutions and answers will be declared as the winner. 4. Each group must select one representative to explain the output in front. 2. A population consists of four numbers (18, 20, 22, 24). Consider all possible samples of size 2 which can be drawn with replacement from the population.
- 6. Presentation of Group Activity Group 1 and Group 2’s expected output 1. Number of samples with replacement is 42 = 16. Samples Means (18,18) 18 (18,20) 19 (18,22) 20 (18,24) 21 (20,18) 19 (20,20) 20 (20,22) 21 (20,24) 22 (22,18) 20 (22,20) 21 (22,22) 22 (22,24) 23 (24,18) 21 (24,20) 22 (24,22) 23 (24,24) 24 Sample Mean X Frequency Probability P(X) 18 1 1/16 19 2 2/16 20 3 3/16 21 4 4/16 22 3 3/16 23 2 2/16 24 1 1/16 Total 16 1 Sample Mean X Probability P(X) X ∙ P(X) 18 1/16 1.125 19 2/16 2.375 20 3/16 3.75 21 4/16 5.25 22 3/16 4.125 23 2/16 2.875 24 1/16 1.5 Total 21 ( ) x x P x = 21 X P(X) X-Mx (X-Mx)2 P(X) ∙ (X-Mx)2 18 1/16 -3 9 0.5625 19 2/16 -2 4 0.5 20 3/16 -1 1 0.1875 21 4/16 0 0 0 22 3/16 1 1 0.1875 23 2/16 2 4 0.5 24 1/16 3 9 0.5625 Total 2.5
- 7. Prepared: ELTON JOHN B. EMBODO Teacher 1 Applicant C. Integration Values Integration A while ago class, we discussed the sampling distribution of the sample mean from an infinite population. Class, how you ever wondered why do we take a sample from a population when we study or analyze a set of data? Why is there a need to use samples, rather than the population itself? You are all correct. Taking a sample from a population is a wise thing to do because treating or analyzing a sample is easier, more practical, cost-effective, convenient, and manageable. It just like conducting research, if the population of the respondents is quite huge, then taking a sample from it will be helpful for the researcher to gather richer amount of information. It will be easier, faster, and more manageable to analyze. 2 2 ( ) ( ) x x P x x = 2.5 Thus, the standard deviation is 2 x = 1.58 (Students’ responses) III. EVALUATION Directions: In a one whole sheet of paper, calculate the mean, variance, and standard deviation of the sampling distribution of the sample means from an infinite population indicated in the given problem. Problem: Consider a population consisting of 1, 2, 3, 4, & 5. Suppose samples of size 2 are drawn from this population with replacement. What is the mean, variance, and standard deviation of the sampling distribution of sample means? Answers: ( ) x x P x = 3 2 2 ( ) ( ) x x P x x = 1 2 x = 1 IV. ASSIGNMENT Directions: Research other ways of finding the mean, variance, and standard deviation of the sampling distribution of the sample mean from an infinite population. Compare the ways that you have found out to the one that we have employed in the class. Present it through a PowerPoint presentation which is to be submitted next week.