SlideShare a Scribd company logo
1 of 13
Download to read offline
Office: (832) 326-5787
Courtney@CourtneyFoster.com
www.ReferredRealtyMT.com
Courtney Foster
Referred Realty Group
Each data point is one month of activity. Data is from September 17, 2018.
All data from Big Sky Country MLS, a subsidiary of the Gallatin Association of REALTORS®. InfoSparks © 2018 ShowingTime.
August Homes for Sale
Bozeman & Belgrade & Three Forks & Big Sky
0
100
200
300
400
500
600
2016 2017 2018
463
447 439
-3.5% -1.8%
98 89
120
-9.2% +34.8%
25
43 49
+72.0% +14.0%
245
194
132
-20.8% -32.0%
Bozeman Belgrade Three Forks Big Sky
Office: (832) 326-5787
Courtney@CourtneyFoster.com
www.ReferredRealtyMT.com
Courtney Foster
Referred Realty Group
Each data point is one month of activity. Data is from September 17, 2018.
All data from Big Sky Country MLS, a subsidiary of the Gallatin Association of REALTORS®. InfoSparks © 2018 ShowingTime.
August New Listings
Bozeman & Belgrade & Three Forks & Big Sky
0
50
100
150
200
250
2016 2017 2018
151
169
191
+11.9% +13.0%
57
79
57
+38.6% -27.8%
7
11 15
+57.1% +36.4%
43
24
16
-44.2% -33.3%
Bozeman Belgrade Three Forks Big Sky
Office: (832) 326-5787
Courtney@CourtneyFoster.com
www.ReferredRealtyMT.com
Courtney Foster
Referred Realty Group
Each data point is one month of activity. Data is from September 17, 2018.
All data from Big Sky Country MLS, a subsidiary of the Gallatin Association of REALTORS®. InfoSparks © 2018 ShowingTime.
August Pending Sales
Bozeman & Belgrade & Three Forks & Big Sky
0
25
50
75
100
125
150
175
2016 2017 2018
146
134
150
-8.2% +11.9%
36
51
45
+41.7% -11.8%
11 9 9
-18.2% 0.0%
39
27
23
-30.8% -14.8%
Bozeman Belgrade Three Forks Big Sky
Office: (832) 326-5787
Courtney@CourtneyFoster.com
www.ReferredRealtyMT.com
Courtney Foster
Referred Realty Group
Each data point is one month of activity. Data is from September 17, 2018.
All data from Big Sky Country MLS, a subsidiary of the Gallatin Association of REALTORS®. InfoSparks © 2018 ShowingTime.
August Closed Sales
Bozeman & Belgrade & Three Forks & Big Sky
0
50
100
150
200
2016 2017 2018
166
159
169
-4.2% +6.3%
55
44
54
-20.0% +22.7%
8 11 10
+37.5% -9.1%
20
28 31
+40.0% +10.7%
Bozeman Belgrade Three Forks Big Sky
Office: (832) 326-5787
Courtney@CourtneyFoster.com
www.ReferredRealtyMT.com
Courtney Foster
Referred Realty Group
Each data point is activity year to date. Data is from September 17, 2018.
All data from Big Sky Country MLS, a subsidiary of the Gallatin Association of REALTORS®. InfoSparks © 2018 ShowingTime.
August Closed Sales
Bozeman & Belgrade & Three Forks & Big Sky
0
200
400
600
800
1,000
1,200
2016 2017 2018
1,079
1,010
1,045
-6.4% +3.5%
294
318 321
+8.2% +0.9%
49 41
59
-16.3% +43.9%
139
171
197
+23.0% +15.2%
Bozeman Belgrade Three Forks Big Sky
Office: (832) 326-5787
Courtney@CourtneyFoster.com
www.ReferredRealtyMT.com
Courtney Foster
Referred Realty Group
Each data point is one month of activity. Data is from September 17, 2018.
All data from Big Sky Country MLS, a subsidiary of the Gallatin Association of REALTORS®. InfoSparks © 2018 ShowingTime.
August Average Sales Price
Bozeman & Belgrade & Three Forks & Big Sky
$0
$0.2M
$0.4M
$0.6M
$0.8M
$1.0M
$1.2M
2016 2017 2018
$368,324
$454,903
$505,934
+23.5% +11.2%
$256,957
$274,015
$311,944
+6.6% +13.8%
$242,293 $238,679
$252,310
-1.5% +5.7%
$561,900
$666,857
$914,484
+18.7% +37.1%
Bozeman Belgrade Three Forks Big Sky
Office: (832) 326-5787
Courtney@CourtneyFoster.com
www.ReferredRealtyMT.com
Courtney Foster
Referred Realty Group
Each data point is one month of activity. Data is from September 17, 2018.
All data from Big Sky Country MLS, a subsidiary of the Gallatin Association of REALTORS®. InfoSparks © 2018 ShowingTime.
August Months Supply of Homes for Sale
Bozeman & Belgrade & Three Forks & Big Sky
0.0
2.0
4.0
6.0
8.0
10.0
12.0
14.0
2016 2017 2018
3.4
3.6 3.5
+5.9% -2.8%
2.8
2.2
3.1
-21.4% +40.9%
3.8
7.8
6.3
+105.3% -19.2%
12.1
8.5
5.6
-29.8% -34.1%
Bozeman Belgrade Three Forks Big Sky
Office: (832) 326-5787
Courtney@CourtneyFoster.com
www.ReferredRealtyMT.com
Courtney Foster
Referred Realty Group
Each data point is one month of activity. Data is from September 17, 2018.
All data from Big Sky Country MLS, a subsidiary of the Gallatin Association of REALTORS®. InfoSparks © 2018 ShowingTime.
August Median Days on Market
Bozeman & Belgrade & Three Forks & Big Sky
0
25
50
75
100
125
150
2016 2017 2018
18 19
15
+5.6% -21.1%
10 8 8
-20.0% 0.0%
31
14
20
-54.8% +42.9%
132
39
25
-70.5% -35.9%
Bozeman Belgrade Three Forks Big Sky
Office: (832) 326-5787
Courtney@CourtneyFoster.com
www.ReferredRealtyMT.com
Courtney Foster
Referred Realty Group
Each data point is one month of activity. Data is from September 17, 2018.
All data from Big Sky Country MLS, a subsidiary of the Gallatin Association of REALTORS®. InfoSparks © 2018 ShowingTime.
August Average Price Per Square Foot
Bozeman & Belgrade & Three Forks & Big Sky
$0
$100
$200
$300
$400
$500
2016 2017 2018
$178
$215
$223
+20.8% +3.7%
$145
$163
$178
+12.4% +9.2%
$127
$110
$140
-13.4% +27.3%
$259
$304
$374
+17.4% +23.0%
Bozeman Belgrade Three Forks Big Sky
Local Market Update – August 2018
This is a research tool provided by the Big Sky Country MLS
Bozeman City Limits
Single Family August Year to Date
Key Metrics 2017 2018 % Change Thru 8-2017 Thru 8-2018 % Change
New Listings 71 71 0.0% 510 538 + 5.5%
Pending Sales 51 59 + 15.7% 413 431 + 4.4%
Closed Sales 50 74 + 48.0% 383 419 + 9.4%
Days on Market Until Sale 50 34 - 32.0% 59 46 - 22.0%
Median Sales Price* $394,430 $452,500 + 14.7% $379,000 $425,000 + 12.1%
Average Sales Price* $435,643 $512,213 + 17.6% $415,642 $471,445 + 13.4%
Percent of List Price Received* 98.9% 98.5% - 0.4% 99.4% 99.2% - 0.2%
Inventory of Homes for Sale 148 158 + 6.8% –– –– ––
Months Supply of Inventory 3.2 3.2 0.0% –– –– ––
Condo/Townhouse August Year to Date
Key Metrics 2017 2018 % Change Thru 8-2017 Thru 8-2018 % Change
New Listings 34 58 + 70.6% 411 357 - 13.1%
Pending Sales 32 41 + 28.1% 337 320 - 5.0%
Closed Sales 49 44 - 10.2% 287 301 + 4.9%
Days on Market Until Sale 51 20 - 60.8% 72 55 - 23.6%
Median Sales Price* $285,000 $304,700 + 6.9% $272,000 $300,000 + 10.3%
Average Sales Price* $315,387 $313,530 - 0.6% $313,874 $341,628 + 8.8%
Percent of List Price Received* 99.8% 99.3% - 0.5% 99.8% 99.4% - 0.4%
Inventory of Homes for Sale 97 102 + 5.2% –– –– ––
Months Supply of Inventory 2.7 2.9 + 7.4% –– –– ––
* Does not account for sale concessions and/or downpayment assistance. | Percent changes are calculated using rounded figures and can sometimes look extreme due to small sample size.
A rolling 12-month calculation represents the current month and the 11 months prior in a single data point. If no activity occurred during a month, the line extends to the next available data point.
Median Sales Price - Single Family
Rolling 12-Month Calculation Gallatin County
Bozeman City Limits
1-2003 1-2005 1-2007 1-2009 1-2011 1-2013 1-2015 1-2017
$150,000
$200,000
$250,000
$300,000
$350,000
$400,000
$450,000
Median Sales Price - Condo
Rolling 12-Month Calculation Gallatin County
Bozeman City Limits
1-2003 1-2005 1-2007 1-2009 1-2011 1-2013 1-2015 1-2017
$100,000
$150,000
$200,000
$250,000
$300,000
Current as of September 10, 2018. All data from Big Sky Country Multiple Listing Service®. Report © 2018 ShowingTime.
Local Market Update – August 2018
This is a research tool provided by the Big Sky Country MLS
Belgrade
Single Family August Year to Date
Key Metrics 2017 2018 % Change Thru 8-2017 Thru 8-2018 % Change
New Listings 61 41 - 32.8% 319 300 - 6.0%
Pending Sales 38 28 - 26.3% 263 233 - 11.4%
Closed Sales 34 35 + 2.9% 238 229 - 3.8%
Days on Market Until Sale 15 23 + 53.3% 41 37 - 9.8%
Median Sales Price* $309,440 $315,000 + 1.8% $285,000 $315,900 + 10.8%
Average Sales Price* $305,895 $335,191 + 9.6% $324,158 $343,941 + 6.1%
Percent of List Price Received* 99.4% 99.0% - 0.4% 99.1% 99.0% - 0.1%
Inventory of Homes for Sale 76 87 + 14.5% –– –– ––
Months Supply of Inventory 2.6 3.2 + 23.1% –– –– ––
Condo/Townhouse August Year to Date
Key Metrics 2017 2018 % Change Thru 8-2017 Thru 8-2018 % Change
New Listings 12 14 + 16.7% 68 102 + 50.0%
Pending Sales 8 14 + 75.0% 67 83 + 23.9%
Closed Sales 7 12 + 71.4% 58 66 + 13.8%
Days on Market Until Sale 15 36 + 140.0% 33 22 - 33.3%
Median Sales Price* $220,000 $270,450 + 22.9% $184,250 $215,500 + 17.0%
Average Sales Price* $203,321 $251,608 + 23.7% $183,946 $223,118 + 21.3%
Percent of List Price Received* 100.1% 99.5% - 0.6% 99.4% 99.7% + 0.3%
Inventory of Homes for Sale 4 23 + 475.0% –– –– ––
Months Supply of Inventory 0.5 2.8 + 460.0% –– –– ––
* Does not account for sale concessions and/or downpayment assistance. | Percent changes are calculated using rounded figures and can sometimes look extreme due to small sample size.
A rolling 12-month calculation represents the current month and the 11 months prior in a single data point. If no activity occurred during a month, the line extends to the next available data point.
Median Sales Price - Single Family
Rolling 12-Month Calculation Gallatin County
Belgrade
1-2003 1-2005 1-2007 1-2009 1-2011 1-2013 1-2015 1-2017
$100,000
$150,000
$200,000
$250,000
$300,000
$350,000
$400,000
$450,000
Median Sales Price - Condo
Rolling 12-Month Calculation Gallatin County
Belgrade
1-2003 1-2005 1-2007 1-2009 1-2011 1-2013 1-2015 1-2017
$50,000
$100,000
$150,000
$200,000
$250,000
$300,000
Current as of September 10, 2018. All data from Big Sky Country Multiple Listing Service®. Report © 2018 ShowingTime.
Local Market Update – August 2018
This is a research tool provided by the Big Sky Country MLS
Greater Big Sky
Single Family August Year to Date
Key Metrics 2017 2018 % Change Thru 8-2017 Thru 8-2018 % Change
New Listings 5 9 + 80.0% 86 86 0.0%
Pending Sales 6 11 + 83.3% 58 79 + 36.2%
Closed Sales 11 10 - 9.1% 47 60 + 27.7%
Days on Market Until Sale 177 94 - 46.9% 236 136 - 42.4%
Median Sales Price* $1,097,500 $1,549,500 + 41.2% $1,237,500 $1,518,000 + 22.7%
Average Sales Price* $1,076,700 $1,890,650 + 75.6% $1,401,832 $1,687,035 + 20.3%
Percent of List Price Received* 93.7% 97.3% + 3.8% 94.5% 96.7% + 2.3%
Inventory of Homes for Sale 81 56 - 30.9% –– –– ––
Months Supply of Inventory 11.9 6.8 - 42.9% –– –– ––
Condo/Townhouse August Year to Date
Key Metrics 2017 2018 % Change Thru 8-2017 Thru 8-2018 % Change
New Listings 16 6 - 62.5% 140 109 - 22.1%
Pending Sales 20 12 - 40.0% 129 134 + 3.9%
Closed Sales 16 19 + 18.8% 113 127 + 12.4%
Days on Market Until Sale 115 90 - 21.7% 143 112 - 21.7%
Median Sales Price* $352,500 $409,000 + 16.0% $365,000 $405,000 + 11.0%
Average Sales Price* $450,602 $441,368 - 2.0% $459,378 $514,767 + 12.1%
Percent of List Price Received* 94.5% 96.0% + 1.6% 96.3% 96.4% + 0.1%
Inventory of Homes for Sale 102 69 - 32.4% –– –– ––
Months Supply of Inventory 6.8 4.7 - 30.9% –– –– ––
* Does not account for sale concessions and/or downpayment assistance. | Percent changes are calculated using rounded figures and can sometimes look extreme due to small sample size.
A rolling 12-month calculation represents the current month and the 11 months prior in a single data point. If no activity occurred during a month, the line extends to the next available data point.
Median Sales Price - Single Family
Rolling 12-Month Calculation Gallatin County
Greater Big Sky
1-2003 1-2005 1-2007 1-2009 1-2011 1-2013 1-2015 1-2017
$0
$500,000
$1,000,000
$1,500,000
$2,000,000
Median Sales Price - Condo
Rolling 12-Month Calculation Gallatin County
Greater Big Sky
1-2003 1-2005 1-2007 1-2009 1-2011 1-2013 1-2015 1-2017
$0
$100,000
$200,000
$300,000
$400,000
$500,000
$600,000
Current as of September 10, 2018. All data from Big Sky Country Multiple Listing Service®. Report © 2018 ShowingTime.
Local Market Update – August 2018
This is a research tool provided by the Big Sky Country MLS
Livingston City Limits
Single Family August Year to Date
Key Metrics 2017 2018 % Change Thru 8-2017 Thru 8-2018 % Change
New Listings 21 10 - 52.4% 123 122 - 0.8%
Pending Sales 14 14 0.0% 123 97 - 21.1%
Closed Sales 21 15 - 28.6% 108 94 - 13.0%
Days on Market Until Sale 30 40 + 33.3% 55 53 - 3.6%
Median Sales Price* $179,000 $270,000 + 50.8% $221,000 $270,000 + 22.2%
Average Sales Price* $205,729 $286,077 + 39.1% $227,490 $278,272 + 22.3%
Percent of List Price Received* 97.9% 98.3% + 0.4% 97.3% 97.7% + 0.4%
Inventory of Homes for Sale 28 36 + 28.6% –– –– ––
Months Supply of Inventory 2.2 3.3 + 50.0% –– –– ––
Condo/Townhouse August Year to Date
Key Metrics 2017 2018 % Change Thru 8-2017 Thru 8-2018 % Change
New Listings 5 2 - 60.0% 21 30 + 42.9%
Pending Sales 3 0 - 100.0% 15 25 + 66.7%
Closed Sales 2 3 + 50.0% 10 22 + 120.0%
Days on Market Until Sale 18 30 + 66.7% 28 52 + 85.7%
Median Sales Price* $137,950 $261,000 + 89.2% $142,450 $217,500 + 52.7%
Average Sales Price* $137,950 $256,333 + 85.8% $152,379 $206,377 + 35.4%
Percent of List Price Received* 98.6% 95.8% - 2.8% 95.6% 97.8% + 2.3%
Inventory of Homes for Sale 7 11 + 57.1% –– –– ––
Months Supply of Inventory 3.1 2.5 - 19.4% –– –– ––
* Does not account for sale concessions and/or downpayment assistance. | Percent changes are calculated using rounded figures and can sometimes look extreme due to small sample size.
A rolling 12-month calculation represents the current month and the 11 months prior in a single data point. If no activity occurred during a month, the line extends to the next available data point.
Median Sales Price - Single Family
Rolling 12-Month Calculation Gallatin County
Livingston City Limits
1-2003 1-2005 1-2007 1-2009 1-2011 1-2013 1-2015 1-2017
$0
$100,000
$200,000
$300,000
$400,000
$500,000
Median Sales Price - Condo
Rolling 12-Month Calculation Gallatin County
Livingston City Limits
1-2003 1-2005 1-2007 1-2009 1-2011 1-2013 1-2015 1-2017
$50,000
$100,000
$150,000
$200,000
$250,000
$300,000
Current as of September 10, 2018. All data from Big Sky Country Multiple Listing Service®. Report © 2018 ShowingTime.

More Related Content

What's hot

What's hot (20)

Jan 2018 Gallatin Valley market reports
Jan 2018 Gallatin Valley market reportsJan 2018 Gallatin Valley market reports
Jan 2018 Gallatin Valley market reports
 
August 2019 Market Reports for Bozeman
August 2019 Market Reports for BozemanAugust 2019 Market Reports for Bozeman
August 2019 Market Reports for Bozeman
 
March 2019 Market Report
March 2019 Market ReportMarch 2019 Market Report
March 2019 Market Report
 
Feb 2019 Market Reports for the Bozeman Area
Feb 2019 Market Reports for the Bozeman AreaFeb 2019 Market Reports for the Bozeman Area
Feb 2019 Market Reports for the Bozeman Area
 
Oct 2019 Market Reports
Oct 2019 Market ReportsOct 2019 Market Reports
Oct 2019 Market Reports
 
May 2019 Gallatin Valley Market Reports
May 2019 Gallatin Valley Market ReportsMay 2019 Gallatin Valley Market Reports
May 2019 Gallatin Valley Market Reports
 
April 2019 Market Reports for the Gallatin Valley
April 2019 Market Reports for the Gallatin ValleyApril 2019 Market Reports for the Gallatin Valley
April 2019 Market Reports for the Gallatin Valley
 
#HomeSalesShow Nov 2017 Market Reports
#HomeSalesShow Nov 2017 Market Reports#HomeSalesShow Nov 2017 Market Reports
#HomeSalesShow Nov 2017 Market Reports
 
Bozeman and Surrounding Communities June 2019 Market Report
Bozeman and Surrounding Communities June 2019 Market ReportBozeman and Surrounding Communities June 2019 Market Report
Bozeman and Surrounding Communities June 2019 Market Report
 
July 2019 Gallatin Valley Market Reports
July 2019 Gallatin Valley Market ReportsJuly 2019 Gallatin Valley Market Reports
July 2019 Gallatin Valley Market Reports
 
Jan 2019 Gallatin Valley Market Reports
Jan 2019 Gallatin Valley Market ReportsJan 2019 Gallatin Valley Market Reports
Jan 2019 Gallatin Valley Market Reports
 
Massachusetts statewide closed sales for condos and single family homes
Massachusetts statewide closed sales for condos and single family homesMassachusetts statewide closed sales for condos and single family homes
Massachusetts statewide closed sales for condos and single family homes
 
#HomeSalesShow Oct 2017 market reports
#HomeSalesShow Oct 2017 market reports#HomeSalesShow Oct 2017 market reports
#HomeSalesShow Oct 2017 market reports
 
September 2019 Market Reports
September 2019 Market ReportsSeptember 2019 Market Reports
September 2019 Market Reports
 
San Francisco Market Focus Report September 2018
San Francisco Market Focus Report September 2018San Francisco Market Focus Report September 2018
San Francisco Market Focus Report September 2018
 
San Francisco Market Focus Report Aug 2018
San Francisco Market Focus Report Aug 2018San Francisco Market Focus Report Aug 2018
San Francisco Market Focus Report Aug 2018
 
Georgia Housing Market Snapshot For September 2018
Georgia Housing Market Snapshot For September 2018Georgia Housing Market Snapshot For September 2018
Georgia Housing Market Snapshot For September 2018
 
San Francisco Market Focus Report November 2018
San Francisco Market Focus Report November 2018San Francisco Market Focus Report November 2018
San Francisco Market Focus Report November 2018
 
San Francisco Market Focus April 2018
San Francisco Market Focus April 2018San Francisco Market Focus April 2018
San Francisco Market Focus April 2018
 
San Francisco Market Focus Report October 2018
San Francisco Market Focus Report October 2018San Francisco Market Focus Report October 2018
San Francisco Market Focus Report October 2018
 

Similar to August 2018 Bozeman Home Sales Market Data

Similar to August 2018 Bozeman Home Sales Market Data (12)

March 2020 Market Data
March 2020 Market DataMarch 2020 Market Data
March 2020 Market Data
 
Georgia Housing Market Snapshot For October 2018
Georgia Housing Market Snapshot For October 2018Georgia Housing Market Snapshot For October 2018
Georgia Housing Market Snapshot For October 2018
 
December and Year End 2018 Sales Data
December and Year End 2018 Sales DataDecember and Year End 2018 Sales Data
December and Year End 2018 Sales Data
 
Georgia Housing Market Snapshot For November 2018
Georgia Housing Market Snapshot For November 2018Georgia Housing Market Snapshot For November 2018
Georgia Housing Market Snapshot For November 2018
 
San Francisco November 2023 Market Report
San Francisco November 2023 Market ReportSan Francisco November 2023 Market Report
San Francisco November 2023 Market Report
 
San Francisco Market Focus Report May
San Francisco Market Focus Report MaySan Francisco Market Focus Report May
San Francisco Market Focus Report May
 
San Francisco Market Report March 2023.pdf
San Francisco Market Report March 2023.pdfSan Francisco Market Report March 2023.pdf
San Francisco Market Report March 2023.pdf
 
San Francisco Market Report October 2022.pdf
San Francisco Market Report October 2022.pdfSan Francisco Market Report October 2022.pdf
San Francisco Market Report October 2022.pdf
 
San Francisco Market Report July 2023.pdf
San Francisco Market Report July 2023.pdfSan Francisco Market Report July 2023.pdf
San Francisco Market Report July 2023.pdf
 
Charlotte region -monthly indicators - feb 2018
Charlotte region -monthly indicators - feb 2018Charlotte region -monthly indicators - feb 2018
Charlotte region -monthly indicators - feb 2018
 
San Francisco Market Report January 2023.pdf
San Francisco Market Report January 2023.pdfSan Francisco Market Report January 2023.pdf
San Francisco Market Report January 2023.pdf
 
San Francisco Market Report February 2023
San Francisco Market Report February 2023San Francisco Market Report February 2023
San Francisco Market Report February 2023
 

More from Referred Realty Group

More from Referred Realty Group (11)

Apr 22 Market Reports
Apr 22 Market ReportsApr 22 Market Reports
Apr 22 Market Reports
 
Bozeman March 2022 Real Estate Market Report
Bozeman March 2022 Real Estate Market ReportBozeman March 2022 Real Estate Market Report
Bozeman March 2022 Real Estate Market Report
 
Feb 2022 Market Report for Bozeman, MT
Feb 2022 Market Report for Bozeman, MTFeb 2022 Market Report for Bozeman, MT
Feb 2022 Market Report for Bozeman, MT
 
January 2022 Bozeman real estate stats
January 2022 Bozeman real estate statsJanuary 2022 Bozeman real estate stats
January 2022 Bozeman real estate stats
 
November 2018 Real Estate Update, The Woodlands, TX
November 2018 Real Estate Update, The Woodlands, TXNovember 2018 Real Estate Update, The Woodlands, TX
November 2018 Real Estate Update, The Woodlands, TX
 
October 2018 Real Estate Update for The Woodlands, Texas
October 2018 Real Estate Update for The Woodlands, TexasOctober 2018 Real Estate Update for The Woodlands, Texas
October 2018 Real Estate Update for The Woodlands, Texas
 
September 2018 Real Estate Update, The Woodlands, Texas
September 2018 Real Estate Update, The Woodlands, TexasSeptember 2018 Real Estate Update, The Woodlands, Texas
September 2018 Real Estate Update, The Woodlands, Texas
 
August 2018 Real Estate Update for The Woodlands, Texas
August 2018 Real Estate Update for The Woodlands, TexasAugust 2018 Real Estate Update for The Woodlands, Texas
August 2018 Real Estate Update for The Woodlands, Texas
 
July 2018 Real Estate Update for The Woodlands, Texas
July 2018 Real Estate Update for The Woodlands, TexasJuly 2018 Real Estate Update for The Woodlands, Texas
July 2018 Real Estate Update for The Woodlands, Texas
 
May 2018 Real Estate Update for The Woodlands, Texas
May 2018 Real Estate Update for The Woodlands, TexasMay 2018 Real Estate Update for The Woodlands, Texas
May 2018 Real Estate Update for The Woodlands, Texas
 
April 2018 Real Estate Update
April 2018 Real Estate UpdateApril 2018 Real Estate Update
April 2018 Real Estate Update
 

Recently uploaded

Land as a Resource for urban finanace- 24-1-23.ppt
Land as a Resource  for urban finanace- 24-1-23.pptLand as a Resource  for urban finanace- 24-1-23.ppt
Land as a Resource for urban finanace- 24-1-23.ppt
JIT KUMAR GUPTA
 

Recently uploaded (20)

Explore Dual Citizenship in Africa | Citizenship Benefits & Requirements
Explore Dual Citizenship in Africa | Citizenship Benefits & RequirementsExplore Dual Citizenship in Africa | Citizenship Benefits & Requirements
Explore Dual Citizenship in Africa | Citizenship Benefits & Requirements
 
The Wall Street Journal Weekend_Febrero 2024
The Wall Street Journal Weekend_Febrero 2024The Wall Street Journal Weekend_Febrero 2024
The Wall Street Journal Weekend_Febrero 2024
 
Rohan Harita Tathawade Pune Brochure.pdf
Rohan Harita Tathawade Pune Brochure.pdfRohan Harita Tathawade Pune Brochure.pdf
Rohan Harita Tathawade Pune Brochure.pdf
 
Bridge & Elliot Ladner Floor Plans May 2024.pdf
Bridge & Elliot Ladner Floor Plans May 2024.pdfBridge & Elliot Ladner Floor Plans May 2024.pdf
Bridge & Elliot Ladner Floor Plans May 2024.pdf
 
Yashwin Enchante Uppar Kharadi Pune E-Brochue.pdf
Yashwin Enchante Uppar Kharadi Pune  E-Brochue.pdfYashwin Enchante Uppar Kharadi Pune  E-Brochue.pdf
Yashwin Enchante Uppar Kharadi Pune E-Brochue.pdf
 
Nyati Elite NIBM Road Pune E Brochure.pdf
Nyati Elite NIBM Road Pune E Brochure.pdfNyati Elite NIBM Road Pune E Brochure.pdf
Nyati Elite NIBM Road Pune E Brochure.pdf
 
Best Interior Design Services in Haldwani
Best Interior Design Services in HaldwaniBest Interior Design Services in Haldwani
Best Interior Design Services in Haldwani
 
SVN Live 5.13.24 Weekly Property Broadcast
SVN Live 5.13.24 Weekly Property BroadcastSVN Live 5.13.24 Weekly Property Broadcast
SVN Live 5.13.24 Weekly Property Broadcast
 
Unveiling the Veil: The Top Challenges with Estate Agents?
Unveiling the Veil: The Top Challenges with Estate Agents?Unveiling the Veil: The Top Challenges with Estate Agents?
Unveiling the Veil: The Top Challenges with Estate Agents?
 
M3M Sector 72 Noida E-Brochure.pdf NEW.
M3M Sector 72 Noida  E-Brochure.pdf NEW.M3M Sector 72 Noida  E-Brochure.pdf NEW.
M3M Sector 72 Noida E-Brochure.pdf NEW.
 
Dynamic Grandeur Undri Pune | A Space For You To Find Your Space
Dynamic Grandeur Undri Pune | A Space For You To Find Your SpaceDynamic Grandeur Undri Pune | A Space For You To Find Your Space
Dynamic Grandeur Undri Pune | A Space For You To Find Your Space
 
Ganga Platinum Kharadi Pune brochure.pdf
Ganga Platinum Kharadi Pune brochure.pdfGanga Platinum Kharadi Pune brochure.pdf
Ganga Platinum Kharadi Pune brochure.pdf
 
San Francisco Market Update -February 2024
San Francisco Market Update -February 2024San Francisco Market Update -February 2024
San Francisco Market Update -February 2024
 
Unique NIBM Flat In Pune E-Brochure.pdf
Unique NIBM Flat In Pune  E-Brochure.pdfUnique NIBM Flat In Pune  E-Brochure.pdf
Unique NIBM Flat In Pune E-Brochure.pdf
 
Land as a Resource for urban finanace- 24-1-23.ppt
Land as a Resource  for urban finanace- 24-1-23.pptLand as a Resource  for urban finanace- 24-1-23.ppt
Land as a Resource for urban finanace- 24-1-23.ppt
 
construction material procurement in India
construction material procurement in Indiaconstruction material procurement in India
construction material procurement in India
 
Retail Space for Lease - 1221 W. Main St., Sun Prairie, WI
Retail Space for Lease - 1221 W. Main St., Sun Prairie, WIRetail Space for Lease - 1221 W. Main St., Sun Prairie, WI
Retail Space for Lease - 1221 W. Main St., Sun Prairie, WI
 
Improvise, Adapt, Overcome - Sales Meeting, May '24
Improvise, Adapt, Overcome - Sales Meeting, May '24Improvise, Adapt, Overcome - Sales Meeting, May '24
Improvise, Adapt, Overcome - Sales Meeting, May '24
 
Kohinoor Greentastic At Kharadi, Pune - PDF.pdf
Kohinoor Greentastic At Kharadi, Pune - PDF.pdfKohinoor Greentastic At Kharadi, Pune - PDF.pdf
Kohinoor Greentastic At Kharadi, Pune - PDF.pdf
 
VTP Dhanori Pune Residential Apartment Brochure.pdf
VTP Dhanori Pune Residential Apartment Brochure.pdfVTP Dhanori Pune Residential Apartment Brochure.pdf
VTP Dhanori Pune Residential Apartment Brochure.pdf
 

August 2018 Bozeman Home Sales Market Data

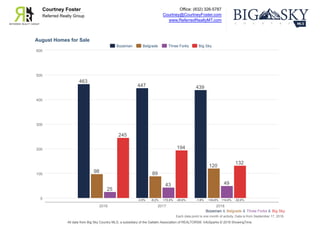
  • 1. Office: (832) 326-5787 Courtney@CourtneyFoster.com www.ReferredRealtyMT.com Courtney Foster Referred Realty Group Each data point is one month of activity. Data is from September 17, 2018. All data from Big Sky Country MLS, a subsidiary of the Gallatin Association of REALTORS®. InfoSparks © 2018 ShowingTime. August Homes for Sale Bozeman & Belgrade & Three Forks & Big Sky 0 100 200 300 400 500 600 2016 2017 2018 463 447 439 -3.5% -1.8% 98 89 120 -9.2% +34.8% 25 43 49 +72.0% +14.0% 245 194 132 -20.8% -32.0% Bozeman Belgrade Three Forks Big Sky
  • 2. Office: (832) 326-5787 Courtney@CourtneyFoster.com www.ReferredRealtyMT.com Courtney Foster Referred Realty Group Each data point is one month of activity. Data is from September 17, 2018. All data from Big Sky Country MLS, a subsidiary of the Gallatin Association of REALTORS®. InfoSparks © 2018 ShowingTime. August New Listings Bozeman & Belgrade & Three Forks & Big Sky 0 50 100 150 200 250 2016 2017 2018 151 169 191 +11.9% +13.0% 57 79 57 +38.6% -27.8% 7 11 15 +57.1% +36.4% 43 24 16 -44.2% -33.3% Bozeman Belgrade Three Forks Big Sky
  • 3. Office: (832) 326-5787 Courtney@CourtneyFoster.com www.ReferredRealtyMT.com Courtney Foster Referred Realty Group Each data point is one month of activity. Data is from September 17, 2018. All data from Big Sky Country MLS, a subsidiary of the Gallatin Association of REALTORS®. InfoSparks © 2018 ShowingTime. August Pending Sales Bozeman & Belgrade & Three Forks & Big Sky 0 25 50 75 100 125 150 175 2016 2017 2018 146 134 150 -8.2% +11.9% 36 51 45 +41.7% -11.8% 11 9 9 -18.2% 0.0% 39 27 23 -30.8% -14.8% Bozeman Belgrade Three Forks Big Sky
  • 4. Office: (832) 326-5787 Courtney@CourtneyFoster.com www.ReferredRealtyMT.com Courtney Foster Referred Realty Group Each data point is one month of activity. Data is from September 17, 2018. All data from Big Sky Country MLS, a subsidiary of the Gallatin Association of REALTORS®. InfoSparks © 2018 ShowingTime. August Closed Sales Bozeman & Belgrade & Three Forks & Big Sky 0 50 100 150 200 2016 2017 2018 166 159 169 -4.2% +6.3% 55 44 54 -20.0% +22.7% 8 11 10 +37.5% -9.1% 20 28 31 +40.0% +10.7% Bozeman Belgrade Three Forks Big Sky
  • 5. Office: (832) 326-5787 Courtney@CourtneyFoster.com www.ReferredRealtyMT.com Courtney Foster Referred Realty Group Each data point is activity year to date. Data is from September 17, 2018. All data from Big Sky Country MLS, a subsidiary of the Gallatin Association of REALTORS®. InfoSparks © 2018 ShowingTime. August Closed Sales Bozeman & Belgrade & Three Forks & Big Sky 0 200 400 600 800 1,000 1,200 2016 2017 2018 1,079 1,010 1,045 -6.4% +3.5% 294 318 321 +8.2% +0.9% 49 41 59 -16.3% +43.9% 139 171 197 +23.0% +15.2% Bozeman Belgrade Three Forks Big Sky
  • 6. Office: (832) 326-5787 Courtney@CourtneyFoster.com www.ReferredRealtyMT.com Courtney Foster Referred Realty Group Each data point is one month of activity. Data is from September 17, 2018. All data from Big Sky Country MLS, a subsidiary of the Gallatin Association of REALTORS®. InfoSparks © 2018 ShowingTime. August Average Sales Price Bozeman & Belgrade & Three Forks & Big Sky $0 $0.2M $0.4M $0.6M $0.8M $1.0M $1.2M 2016 2017 2018 $368,324 $454,903 $505,934 +23.5% +11.2% $256,957 $274,015 $311,944 +6.6% +13.8% $242,293 $238,679 $252,310 -1.5% +5.7% $561,900 $666,857 $914,484 +18.7% +37.1% Bozeman Belgrade Three Forks Big Sky
  • 7. Office: (832) 326-5787 Courtney@CourtneyFoster.com www.ReferredRealtyMT.com Courtney Foster Referred Realty Group Each data point is one month of activity. Data is from September 17, 2018. All data from Big Sky Country MLS, a subsidiary of the Gallatin Association of REALTORS®. InfoSparks © 2018 ShowingTime. August Months Supply of Homes for Sale Bozeman & Belgrade & Three Forks & Big Sky 0.0 2.0 4.0 6.0 8.0 10.0 12.0 14.0 2016 2017 2018 3.4 3.6 3.5 +5.9% -2.8% 2.8 2.2 3.1 -21.4% +40.9% 3.8 7.8 6.3 +105.3% -19.2% 12.1 8.5 5.6 -29.8% -34.1% Bozeman Belgrade Three Forks Big Sky
  • 8. Office: (832) 326-5787 Courtney@CourtneyFoster.com www.ReferredRealtyMT.com Courtney Foster Referred Realty Group Each data point is one month of activity. Data is from September 17, 2018. All data from Big Sky Country MLS, a subsidiary of the Gallatin Association of REALTORS®. InfoSparks © 2018 ShowingTime. August Median Days on Market Bozeman & Belgrade & Three Forks & Big Sky 0 25 50 75 100 125 150 2016 2017 2018 18 19 15 +5.6% -21.1% 10 8 8 -20.0% 0.0% 31 14 20 -54.8% +42.9% 132 39 25 -70.5% -35.9% Bozeman Belgrade Three Forks Big Sky
  • 9. Office: (832) 326-5787 Courtney@CourtneyFoster.com www.ReferredRealtyMT.com Courtney Foster Referred Realty Group Each data point is one month of activity. Data is from September 17, 2018. All data from Big Sky Country MLS, a subsidiary of the Gallatin Association of REALTORS®. InfoSparks © 2018 ShowingTime. August Average Price Per Square Foot Bozeman & Belgrade & Three Forks & Big Sky $0 $100 $200 $300 $400 $500 2016 2017 2018 $178 $215 $223 +20.8% +3.7% $145 $163 $178 +12.4% +9.2% $127 $110 $140 -13.4% +27.3% $259 $304 $374 +17.4% +23.0% Bozeman Belgrade Three Forks Big Sky
  • 10. Local Market Update – August 2018 This is a research tool provided by the Big Sky Country MLS Bozeman City Limits Single Family August Year to Date Key Metrics 2017 2018 % Change Thru 8-2017 Thru 8-2018 % Change New Listings 71 71 0.0% 510 538 + 5.5% Pending Sales 51 59 + 15.7% 413 431 + 4.4% Closed Sales 50 74 + 48.0% 383 419 + 9.4% Days on Market Until Sale 50 34 - 32.0% 59 46 - 22.0% Median Sales Price* $394,430 $452,500 + 14.7% $379,000 $425,000 + 12.1% Average Sales Price* $435,643 $512,213 + 17.6% $415,642 $471,445 + 13.4% Percent of List Price Received* 98.9% 98.5% - 0.4% 99.4% 99.2% - 0.2% Inventory of Homes for Sale 148 158 + 6.8% –– –– –– Months Supply of Inventory 3.2 3.2 0.0% –– –– –– Condo/Townhouse August Year to Date Key Metrics 2017 2018 % Change Thru 8-2017 Thru 8-2018 % Change New Listings 34 58 + 70.6% 411 357 - 13.1% Pending Sales 32 41 + 28.1% 337 320 - 5.0% Closed Sales 49 44 - 10.2% 287 301 + 4.9% Days on Market Until Sale 51 20 - 60.8% 72 55 - 23.6% Median Sales Price* $285,000 $304,700 + 6.9% $272,000 $300,000 + 10.3% Average Sales Price* $315,387 $313,530 - 0.6% $313,874 $341,628 + 8.8% Percent of List Price Received* 99.8% 99.3% - 0.5% 99.8% 99.4% - 0.4% Inventory of Homes for Sale 97 102 + 5.2% –– –– –– Months Supply of Inventory 2.7 2.9 + 7.4% –– –– –– * Does not account for sale concessions and/or downpayment assistance. | Percent changes are calculated using rounded figures and can sometimes look extreme due to small sample size. A rolling 12-month calculation represents the current month and the 11 months prior in a single data point. If no activity occurred during a month, the line extends to the next available data point. Median Sales Price - Single Family Rolling 12-Month Calculation Gallatin County Bozeman City Limits 1-2003 1-2005 1-2007 1-2009 1-2011 1-2013 1-2015 1-2017 $150,000 $200,000 $250,000 $300,000 $350,000 $400,000 $450,000 Median Sales Price - Condo Rolling 12-Month Calculation Gallatin County Bozeman City Limits 1-2003 1-2005 1-2007 1-2009 1-2011 1-2013 1-2015 1-2017 $100,000 $150,000 $200,000 $250,000 $300,000 Current as of September 10, 2018. All data from Big Sky Country Multiple Listing Service®. Report © 2018 ShowingTime.
  • 11. Local Market Update – August 2018 This is a research tool provided by the Big Sky Country MLS Belgrade Single Family August Year to Date Key Metrics 2017 2018 % Change Thru 8-2017 Thru 8-2018 % Change New Listings 61 41 - 32.8% 319 300 - 6.0% Pending Sales 38 28 - 26.3% 263 233 - 11.4% Closed Sales 34 35 + 2.9% 238 229 - 3.8% Days on Market Until Sale 15 23 + 53.3% 41 37 - 9.8% Median Sales Price* $309,440 $315,000 + 1.8% $285,000 $315,900 + 10.8% Average Sales Price* $305,895 $335,191 + 9.6% $324,158 $343,941 + 6.1% Percent of List Price Received* 99.4% 99.0% - 0.4% 99.1% 99.0% - 0.1% Inventory of Homes for Sale 76 87 + 14.5% –– –– –– Months Supply of Inventory 2.6 3.2 + 23.1% –– –– –– Condo/Townhouse August Year to Date Key Metrics 2017 2018 % Change Thru 8-2017 Thru 8-2018 % Change New Listings 12 14 + 16.7% 68 102 + 50.0% Pending Sales 8 14 + 75.0% 67 83 + 23.9% Closed Sales 7 12 + 71.4% 58 66 + 13.8% Days on Market Until Sale 15 36 + 140.0% 33 22 - 33.3% Median Sales Price* $220,000 $270,450 + 22.9% $184,250 $215,500 + 17.0% Average Sales Price* $203,321 $251,608 + 23.7% $183,946 $223,118 + 21.3% Percent of List Price Received* 100.1% 99.5% - 0.6% 99.4% 99.7% + 0.3% Inventory of Homes for Sale 4 23 + 475.0% –– –– –– Months Supply of Inventory 0.5 2.8 + 460.0% –– –– –– * Does not account for sale concessions and/or downpayment assistance. | Percent changes are calculated using rounded figures and can sometimes look extreme due to small sample size. A rolling 12-month calculation represents the current month and the 11 months prior in a single data point. If no activity occurred during a month, the line extends to the next available data point. Median Sales Price - Single Family Rolling 12-Month Calculation Gallatin County Belgrade 1-2003 1-2005 1-2007 1-2009 1-2011 1-2013 1-2015 1-2017 $100,000 $150,000 $200,000 $250,000 $300,000 $350,000 $400,000 $450,000 Median Sales Price - Condo Rolling 12-Month Calculation Gallatin County Belgrade 1-2003 1-2005 1-2007 1-2009 1-2011 1-2013 1-2015 1-2017 $50,000 $100,000 $150,000 $200,000 $250,000 $300,000 Current as of September 10, 2018. All data from Big Sky Country Multiple Listing Service®. Report © 2018 ShowingTime.
  • 12. Local Market Update – August 2018 This is a research tool provided by the Big Sky Country MLS Greater Big Sky Single Family August Year to Date Key Metrics 2017 2018 % Change Thru 8-2017 Thru 8-2018 % Change New Listings 5 9 + 80.0% 86 86 0.0% Pending Sales 6 11 + 83.3% 58 79 + 36.2% Closed Sales 11 10 - 9.1% 47 60 + 27.7% Days on Market Until Sale 177 94 - 46.9% 236 136 - 42.4% Median Sales Price* $1,097,500 $1,549,500 + 41.2% $1,237,500 $1,518,000 + 22.7% Average Sales Price* $1,076,700 $1,890,650 + 75.6% $1,401,832 $1,687,035 + 20.3% Percent of List Price Received* 93.7% 97.3% + 3.8% 94.5% 96.7% + 2.3% Inventory of Homes for Sale 81 56 - 30.9% –– –– –– Months Supply of Inventory 11.9 6.8 - 42.9% –– –– –– Condo/Townhouse August Year to Date Key Metrics 2017 2018 % Change Thru 8-2017 Thru 8-2018 % Change New Listings 16 6 - 62.5% 140 109 - 22.1% Pending Sales 20 12 - 40.0% 129 134 + 3.9% Closed Sales 16 19 + 18.8% 113 127 + 12.4% Days on Market Until Sale 115 90 - 21.7% 143 112 - 21.7% Median Sales Price* $352,500 $409,000 + 16.0% $365,000 $405,000 + 11.0% Average Sales Price* $450,602 $441,368 - 2.0% $459,378 $514,767 + 12.1% Percent of List Price Received* 94.5% 96.0% + 1.6% 96.3% 96.4% + 0.1% Inventory of Homes for Sale 102 69 - 32.4% –– –– –– Months Supply of Inventory 6.8 4.7 - 30.9% –– –– –– * Does not account for sale concessions and/or downpayment assistance. | Percent changes are calculated using rounded figures and can sometimes look extreme due to small sample size. A rolling 12-month calculation represents the current month and the 11 months prior in a single data point. If no activity occurred during a month, the line extends to the next available data point. Median Sales Price - Single Family Rolling 12-Month Calculation Gallatin County Greater Big Sky 1-2003 1-2005 1-2007 1-2009 1-2011 1-2013 1-2015 1-2017 $0 $500,000 $1,000,000 $1,500,000 $2,000,000 Median Sales Price - Condo Rolling 12-Month Calculation Gallatin County Greater Big Sky 1-2003 1-2005 1-2007 1-2009 1-2011 1-2013 1-2015 1-2017 $0 $100,000 $200,000 $300,000 $400,000 $500,000 $600,000 Current as of September 10, 2018. All data from Big Sky Country Multiple Listing Service®. Report © 2018 ShowingTime.
  • 13. Local Market Update – August 2018 This is a research tool provided by the Big Sky Country MLS Livingston City Limits Single Family August Year to Date Key Metrics 2017 2018 % Change Thru 8-2017 Thru 8-2018 % Change New Listings 21 10 - 52.4% 123 122 - 0.8% Pending Sales 14 14 0.0% 123 97 - 21.1% Closed Sales 21 15 - 28.6% 108 94 - 13.0% Days on Market Until Sale 30 40 + 33.3% 55 53 - 3.6% Median Sales Price* $179,000 $270,000 + 50.8% $221,000 $270,000 + 22.2% Average Sales Price* $205,729 $286,077 + 39.1% $227,490 $278,272 + 22.3% Percent of List Price Received* 97.9% 98.3% + 0.4% 97.3% 97.7% + 0.4% Inventory of Homes for Sale 28 36 + 28.6% –– –– –– Months Supply of Inventory 2.2 3.3 + 50.0% –– –– –– Condo/Townhouse August Year to Date Key Metrics 2017 2018 % Change Thru 8-2017 Thru 8-2018 % Change New Listings 5 2 - 60.0% 21 30 + 42.9% Pending Sales 3 0 - 100.0% 15 25 + 66.7% Closed Sales 2 3 + 50.0% 10 22 + 120.0% Days on Market Until Sale 18 30 + 66.7% 28 52 + 85.7% Median Sales Price* $137,950 $261,000 + 89.2% $142,450 $217,500 + 52.7% Average Sales Price* $137,950 $256,333 + 85.8% $152,379 $206,377 + 35.4% Percent of List Price Received* 98.6% 95.8% - 2.8% 95.6% 97.8% + 2.3% Inventory of Homes for Sale 7 11 + 57.1% –– –– –– Months Supply of Inventory 3.1 2.5 - 19.4% –– –– –– * Does not account for sale concessions and/or downpayment assistance. | Percent changes are calculated using rounded figures and can sometimes look extreme due to small sample size. A rolling 12-month calculation represents the current month and the 11 months prior in a single data point. If no activity occurred during a month, the line extends to the next available data point. Median Sales Price - Single Family Rolling 12-Month Calculation Gallatin County Livingston City Limits 1-2003 1-2005 1-2007 1-2009 1-2011 1-2013 1-2015 1-2017 $0 $100,000 $200,000 $300,000 $400,000 $500,000 Median Sales Price - Condo Rolling 12-Month Calculation Gallatin County Livingston City Limits 1-2003 1-2005 1-2007 1-2009 1-2011 1-2013 1-2015 1-2017 $50,000 $100,000 $150,000 $200,000 $250,000 $300,000 Current as of September 10, 2018. All data from Big Sky Country Multiple Listing Service®. Report © 2018 ShowingTime.