8) Tornado Start Location Frequency Relative To RFD Boundary Position For 208 Cases.pdf
•
0 likes•6 views
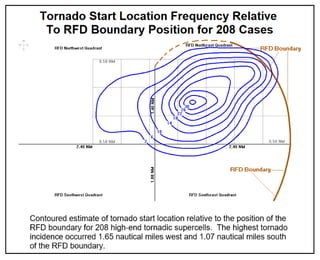
Contoured estimate of tornado start location relative to the position of the RFD boundary for 208 high-end tornadic supercells. The highest tornado incidence occurred 1.65 nautical miles west and 1.07 nautical miles south of the RFD boundary.
Report
Share
Report
Share
Download to read offline
Recommended
Supercell Schematic with Violent Tornado over Farmland Including Tornadogenes...
This is the first supplementary graphic that came from work done for the Tornadogenesis papers of Part 1, Part 2 and Part 3. This hypothetical schematic shows a violent tornado, along with the different features of a supercell including the rear flank downdraft, forward flank downdraft, RFD boundary, FFD boundary, inflow, inflow channel, descending reflectivity core, occlusion downdraft, streamwise vorticity current, overshooting top and back anvil.
Supercell Schematic with Violent Tornado Near Trees and Lakes Including Torna...
This is the second supplementary graphic that came from work done for the Tornadogenesis papers of Part 1, Part 2 and Part 3. This hypothetical schematic shows a violent tornado, along with the different features of a supercell including the rear flank downdraft, forward flank downdraft, RFD boundary, FFD boundary, inflow, inflow channel, descending reflectivity core, occlusion downdraft, streamwise vorticity current, overshooting top and back anvil.
1) Tornadogenesis In High-end Tornadic Supercells (Part 1) - The RFD Surge, R...
This is the title slide for paper 1, "Tornadogenesis In High-end Tornadic Supercells (Part 1) - The RFD Surge, RFD Occlusion and Cell Mergers".
2) Project Goal, Database Collection and RFD Occlusion Identification Method ...
In order to put together the puzzle pieces of high-end tornadogenesis, we determined that a relatively large sample of supercells with high-end tornadoes would be needed. High-resolution radar would be analyzed for measuring as many characteristics of these supercells as possible. An archive
of WSR-88D high-resolution radar, at the Storm Prediction
Center, would be used to satisfy most requirements for data collection. Other data, including surface observations and soundings, would be used to analyze environmental information. It was determined that about a decade of radar data would be sufficient for the needs of this project. The period in the archive from May 22, 2008 to December 31, 2019 was examined. Before a tornado event was added to the study, seven criteria must be met. They are listed in this graphic.
3) Four Examples - Inflow Restriction into the Low-level Mesocyclone.pdf
The pre-tornadic RFD occlusion signature, which commonly occurred about five minutes prior to the tornado start time. This signature is an indication that the RFD occlusion has matured and occurs about two-thirds of the way through tornadogenesis.
4) Data Gathered For Seven Key Elements of Tornadogenesis.pdf
After analyzing the RFD occlusion, each storm was examined in detail to identify as many characteristics as possible for the 208 high-end tornadic supercells.
By the end of the project, the total amount of time to analyze the 208 supercells was about 1,500 hours. The following seven categories were considered the most important for each supercell, although much more data was collected.
5) Schematic of Supercell at Violent Tornado Stage (Adapted From Lemon 1979).pdf
Schematic of a supercell at the violent tornado stage (adapted from Lemon and Doswell 1979). The rear flank downdraft is red, forward flank downdraft is blue, updraft is brown and tornado is purple. The inflow channel is the narrow corridor (brown) north and west of the tornado. The inflection point (blue to red) is located north of the inflow channel. Streamlines are at 300 meters above ground level.
6) Salyersville, KY Tornadic Supercell on March 2, 2012 - FFD, RFD, Tornado, ...
The supercell that produced the EF3 at Salyersville, Kentucky on March 2, 2012. The RFD boundary is purple and occlusion downdraft is encircled in maroon just southeast of the tornado. The nose of the occlusion downdraft is circled in blue just east-northeast of the tornado. Davies-Jones 2006, Markowski 2002, Lee et al. 2011, 2012 explain more about the occlusion downdraft.
6a) RFD-FFD Boundary Locations For Six Well-organized HIgh-end Supercells.pdf
Estimated locations for the RFD boundary (blue) and FFD boundary (purple) for six notable high-end tornadic supercells. These supercells were at peak organization with the inflection point washed out.
6b) Reflectivity Boundary Position Estimate.pdf
Estimate of RFD boundary position (black) using the reflectivity image for Moore, Oklahoma on May 10, 2010. For every RFD boundary estimate, both reflectivity and base velocity were used together, but one was chosen as primary.
6c) Schematic of a Classic Rear Flank Downdraft.pdf
A schematic showing the rear flank downdraft of a tornadic supercell. The RFD occlusion or tornado is at the center of rotational convergence within the RFD. The curved dashed line is the outline of the hook echo. The white area is inflow to the updraft. Gray indicates relatively warm downdraft outflow. An unstable RFD is favorable for tornadogenesis. A couple hundred meters above the surface, winds generally turn south-southwest or southwesterly in the area south of the hook. Graphic obtained from Markowski et al. 2002.
6d) Base Velocity Estimate Overlaid on Reflectivity Base Velocity RFD Boundar...
An example showing the location of the RFD occlusion associated with the Moore, Oklahoma EF5 tornado on May 20, 2013. Base velocity (right) was used as primary to draw the RFD boundary. This location in black was super-imposed onto reflectivity (left). Even though base velocity was the primary indicator for the estimate, reflectivity also shows the RFD boundary well.
7) Estimated Tornado Start Location Relative To RFD Boundary Location For 208...
The distribution of tornadoes relative to the RFD boundary near the tornado start time. 201 of the 208 tornado start locations (96.6%) were more than a quarter nautical mile to the west of the RFD boundary. Seven of the 208 cases (3.4%) were located near the RFD boundary, with three of the seven (1.4%) located on the RFD boundary itself.
8a) Tornado Start Location Frequency Relative To RFD Boundary Position For 20...
Estimated tornado start locations relative to the RFD boundary for the first and second half of the dataset (left), and east and west of the Mississippi River (middle). The distribution of points is shown for the reflectivity and base velocity scans (right), depending upon which one was used as the primary indicator.
9) EF5 Tornado Frequency Relative To RFD Boundary and EF4-EF5 Tornado Frequen...
Frequency of EF4-EF5 tornadoes (left) and EF5 tornadoes (right), relative to the position of the RFD boundary.
10) Hypothesis - Critical Role of the RFD Surge, Schematic Created and Modifi...
A schematic showing the process of tornadogenesis involving an RFD surge beginning just over 13 minutes before the tornado start time. The RFD surge creates the inflow channel, as the RFD surge impinges on the inflow sector. This likely induces a pressure drop due to the Bernoulli Effect, which strengthens the RFD occlusion. The tornado forms after the RFD occlusion matures beneath the low-level mesocyclone, most often in the RFD’s northeast quadrant.
10a) Schematic of RFD Surging Beneath Mesocyclone with Rapid Intensification ...
RFD boundary surges northeastward toward the forward flank. As the RFD boundary impinges on the supercell’s inflow sector, an inflow channel is created. This induces a pressure drop due to the Bernoulli Effect, which strengthens the RFD occlusion. Also, restriction within the inflow channel causes the RFD occlusion to rapidly deepen as air is evacuated upward through the mesocyclone at a faster rate than can be replaced below. The tornado forms after the RFD occlusion matures beneath the low-level meso, most often in the RFD’s northeast quadrant. The descending reflectivity core (DRC) is in dark gray, which wraps around the RFD occlusion near the tornado start time (see Part 2).
11) RFD Surge Identification Method.pdf
An RFD surge was found for all 208 cases. The following method was used to identify the start and end points of the RFD surge, and to measure the RFD surge’s speed relative to the supercell’s speed.
First, the case was loaded and studied for about 15 minutes. The tornado start location was marked. Then, the RFD boundary location was estimated at high confidence times before and after the tornado start time. The examination paid close attention to the movement of precipitation behind the RFD boundary. Four questions listed below, were asked in order to determine when the RFD surge started and ended.
1) When did the precipitation gradient, just behind the RFD boundary, begin to accelerate relative to the storm’s movement?
2) When did the precipitation gradient, just behind the RFD boundary, obtain a bowed or curved appearance?
3) When did the precipitation gradient, just behind the RFD boundary, reach the forward flank?
4) When did the precipitation gradient, just behind the RFD boundary, decelerate relative to the storm’s movement?
Reflectivity data were used exclusively to determine when the RFD surge began and ended. The RFD surge was considered a time period when the leading edge of precipitation, just behind the RFD boundary, moved at a speed faster than the supercell’s speed. This involved an acceleration and then deceleration of the leading edge of precipitation.
11a) RFD Surge Analysis - Sibley, Iowa EF4 Tornado on June 25, 2010.pdf
RFD surge analysis for the Sibley, Iowa EF4 tornado on June 25, 2010. A cell merger ongoing in panel 1, instigates the RFD surge. The RFD surge starting point (panel 2) and ending point (panel 6), are marked. During the RFD surge, the reflectivity structure bulges and rapidly expands (panel 3 and 4). A bowing shape develops in panel 5. The RFD surge ends when it reaches the forward flank (panel 6).
12) Average RFD Surge Times Relative To Tornado Start Time For All 208 Superc...
Sorted distribution of RFD surge storm relative speed for all 208 supercells. The average RFD surge storm relative speed ranged from just under two knots to just over 20 knots. The RFD’s primary role during tornadogenesis is to move the RFD boundary toward the FFD boundary, in order to create an inflow channel. A fast storm relative speed is not necessary to accomplish this task.
13) RFD Surge Type 1 (66.3 Percent) Rozel, KS EF4 - 5-19-2013.pdf
Type 1 RFD surge (at right), in which the low-level mesocyclone is initially above the RFD. During the RFD surge, the RFD boundary moves toward the supercell’s forward flank. The RFD occlusion develops and matures, which is followed by tornado formation in the RFD occlusion. The tornado most often forms in the northeast quadrant of the RFD.
For the Rozel, Kansas EF4 tornado on May 19, 2013 (at right), a prominent cell merger started the RFD surge. The mesocyclone was located to the west of the RFD boundary (panel 1). The cell merger caused an enhanced downdraft to move southeast, creating a long pendant (panel 2). The RFD occlusion developed at the pendant’s southeast end. The tornado formed as the RFD boundary surged northeastward toward the forward flank. This created a narrow inflow channel (panel 3 and 4). 300 meter ground-relative flow is estimated based on cell movement and outflow.
14) RFD Surge Type (30.3 Percent) Fackler, AL EF4 - 4-27-2011.pdf
Type 2 RFD surge (at right), in which the RFD surge is initially ahead of the RFD boundary. The RFD boundary moves underneath the low-level mesocyclone and then away toward the forward flank. The RFD occlusion develops and matures after the low-level mesocyclone has been undercut. This is followed by tornado formation within the RFD occlusion.
For the Fackler, Alabama EF4 tornado on April 27, 2011 (to right), the RFD surge was instigated by cell mergers to the southwest of the RFD boundary. The RFD surge was very strong, with a 117 knot max outbound noted in panel two. The inflow channel became narrow as the RFD boundary pushed toward the forward flank (panel 3). Reflectors quickly disappear around the new tornado (panel 4), likely due to absorption by the rapidly strengthening tornado. 300 meter ground-relative flow is estimated based on cell movement and outflow.
15) RFD Surge Type (3.4 Percent) Ravanna, KS EF3 - 5-24-2016.pdf
Type 3 RFD surge (at right), in which the low-level mesocyclone is initially ahead of the RFD boundary. The RFD boundary surges toward the supercell’s forward flank, and to the center of the low-level mesocyclone. An RFD occlusion forms on the RFD boundary, underneath the low-level mesocyclone. The tornado develops within the RFD occlusion, on the RFD boundary, eventually moving southwestward into the RFD.
For the Ravanna, Kansas EF3 tornado on May 24, 2016 (at right), the mesocyclone was initially to the east of the RFD boundary. The RFD surge was instigated by outflow associated with cell mergers west of the boundary (panel 2). As the RFD surged toward the forward flank, the RFD occlusion developed on the RFD boundary (panel 2 and 3). Then, the tornado formed in the RFD occlusion (panel 4). 300 meter ground-relative flow is estimated based on cell movement and outflow.
16) Northward-moving Wave Disrupts RFD and EF4 Tornado near Goldsby, OK on Ma...
An example showing the Goldsby, Oklahoma EF4 tornado on May 24, 2011, in which the RFD was disrupted by a northward-moving wave. First, a left-moving supercell from north Texas approached the Goldsby supercell at near 65 nautical miles per hour. Outflow associated with the cell merger enhances vertical vorticity, causing the tornado to strengthen and reach peak intensity (panel 2). After the cell merger, a northward-moving wave associated with the left-mover, hit the Goldsby supercell’s RFD. The back edge of the RFD retreated northward (panels 4, 5 and 6), and eventually the backed flow associated with the northward-moving wave pushed the flanking line precipitation away from the mesocyclone (panels 7 and 8). This disrupted the RFD causing the tornado to dissipate.
17) EF3 Forms After 2nd RFD Surge Undercuts Low-level Meso at Hillsboro, ND o...
An example showing the Hillsboro, North Dakota EF3 tornadic supercell on August 27, 2016, in which there were two RFD surges. The first RFD surge did not produce a tornado, while the second did. The first RFD surge pushed southward and did not undercut the low-level mesocyclone. Veered flow at 700 mb and a lack of cell mergers were limiting factors, keeping the first RFD surge to the west of the low-level meso. The second RFD surge pushed eastward, undercutting the low-level meso. The second RFD surge was aided by cell outflow and cell mergers during the 15 minutes preceding the tornado. Veered low to mid-level flow, associated with northwest flow aloft, can contribute to a problem in which a supercell’s RFD surge takes place too far west. When this happens, it can be difficult for the RFD to undercut the low-level mesocyclone. This problem makes tornadogenesis more unlikely in summer.
18) Times of Cell Mergers Associated with Tornadogenesis Relative To Tornado ...
During the cell merger analysis, all 208 cases were examined twice. The first examination pass identified cell mergers that occurred closer to the tornado start time. Within this first pass, clustering within the distribution was found at two time periods. The first was found to occur just a few minutes prior to the tornado start time. A second was found further out in time, generally between five and ten minutes prior to the tornado. During the first examination, it was observed that another cell merger was commonly occurring more than 10 minutes prior to the tornado start time. And this cell merger was often happening just before the start of the RFD surge. As a result, a second pass through the 208 cases was completed to identify cell mergers further out before the tornado start time. The cell merger that was identified during the second pass was called cell merger one, while the two cell mergers that were identified during the first pass were called cell merger two and three. After all the analysis was done, a cell merger two was found in more cases than a cell merger one. This is because a cell merger midway through the tornadogenesis process was slightly more common than a cell merger near the beginning of the tornadogenesis process. The first and second examinations were completely independent of each other, which revealed more detail concerning the distribution.
Using the three periods of cell merger clustering, average times prior to the tornado start time were computed. The 208 case average of those times are listed below, with the number of cases identified for each time, and the percent of occurrence listed in Table 1.
19) Location of 77 Cell Mergers That Instigated RFD Surges Relative To Pendan...
The locations of cell merger one for 77 cell mergers relative to the pendant, that likely instigated RFD surges prior to high-end tornadogenesis from June 5, 2010 to March 15, 2012.
19a) Cell Merger Instigating RFD Surge for Canton, Oklahoma EF3 on May 24, 20...
The cell merger that instigated the RFD surge prior to the EF3 tornado at Canton, OK on May 24, 2011. In this case, the merging cell was less than 20 DBZ (upper left and upper middle). But the cell rapidly intensified just before the merger. We found some cases where a weak cell (<= 35 DBZ) was involved with a cell merger likely important to tornadogenesis.
Structures and textures of metamorphic rocks
It is useful for the Under Graduating students for easy understanding and it's useful for the exam preparations.
Multi-source connectivity as the driver of solar wind variability in the heli...
The ambient solar wind that flls the heliosphere originates from multiple
sources in the solar corona and is highly structured. It is often described
as high-speed, relatively homogeneous, plasma streams from coronal
holes and slow-speed, highly variable, streams whose source regions are
under debate. A key goal of ESA/NASA’s Solar Orbiter mission is to identify
solar wind sources and understand what drives the complexity seen in the
heliosphere. By combining magnetic feld modelling and spectroscopic
techniques with high-resolution observations and measurements, we show
that the solar wind variability detected in situ by Solar Orbiter in March
2022 is driven by spatio-temporal changes in the magnetic connectivity to
multiple sources in the solar atmosphere. The magnetic feld footpoints
connected to the spacecraft moved from the boundaries of a coronal hole
to one active region (12961) and then across to another region (12957). This
is refected in the in situ measurements, which show the transition from fast
to highly Alfvénic then to slow solar wind that is disrupted by the arrival of
a coronal mass ejection. Our results describe solar wind variability at 0.5 au
but are applicable to near-Earth observatories.
More Related Content
More from JohnChrisBroyles
6a) RFD-FFD Boundary Locations For Six Well-organized HIgh-end Supercells.pdf
Estimated locations for the RFD boundary (blue) and FFD boundary (purple) for six notable high-end tornadic supercells. These supercells were at peak organization with the inflection point washed out.
6b) Reflectivity Boundary Position Estimate.pdf
Estimate of RFD boundary position (black) using the reflectivity image for Moore, Oklahoma on May 10, 2010. For every RFD boundary estimate, both reflectivity and base velocity were used together, but one was chosen as primary.
6c) Schematic of a Classic Rear Flank Downdraft.pdf
A schematic showing the rear flank downdraft of a tornadic supercell. The RFD occlusion or tornado is at the center of rotational convergence within the RFD. The curved dashed line is the outline of the hook echo. The white area is inflow to the updraft. Gray indicates relatively warm downdraft outflow. An unstable RFD is favorable for tornadogenesis. A couple hundred meters above the surface, winds generally turn south-southwest or southwesterly in the area south of the hook. Graphic obtained from Markowski et al. 2002.
6d) Base Velocity Estimate Overlaid on Reflectivity Base Velocity RFD Boundar...
An example showing the location of the RFD occlusion associated with the Moore, Oklahoma EF5 tornado on May 20, 2013. Base velocity (right) was used as primary to draw the RFD boundary. This location in black was super-imposed onto reflectivity (left). Even though base velocity was the primary indicator for the estimate, reflectivity also shows the RFD boundary well.
7) Estimated Tornado Start Location Relative To RFD Boundary Location For 208...
The distribution of tornadoes relative to the RFD boundary near the tornado start time. 201 of the 208 tornado start locations (96.6%) were more than a quarter nautical mile to the west of the RFD boundary. Seven of the 208 cases (3.4%) were located near the RFD boundary, with three of the seven (1.4%) located on the RFD boundary itself.
8a) Tornado Start Location Frequency Relative To RFD Boundary Position For 20...
Estimated tornado start locations relative to the RFD boundary for the first and second half of the dataset (left), and east and west of the Mississippi River (middle). The distribution of points is shown for the reflectivity and base velocity scans (right), depending upon which one was used as the primary indicator.
9) EF5 Tornado Frequency Relative To RFD Boundary and EF4-EF5 Tornado Frequen...
Frequency of EF4-EF5 tornadoes (left) and EF5 tornadoes (right), relative to the position of the RFD boundary.
10) Hypothesis - Critical Role of the RFD Surge, Schematic Created and Modifi...
A schematic showing the process of tornadogenesis involving an RFD surge beginning just over 13 minutes before the tornado start time. The RFD surge creates the inflow channel, as the RFD surge impinges on the inflow sector. This likely induces a pressure drop due to the Bernoulli Effect, which strengthens the RFD occlusion. The tornado forms after the RFD occlusion matures beneath the low-level mesocyclone, most often in the RFD’s northeast quadrant.
10a) Schematic of RFD Surging Beneath Mesocyclone with Rapid Intensification ...
RFD boundary surges northeastward toward the forward flank. As the RFD boundary impinges on the supercell’s inflow sector, an inflow channel is created. This induces a pressure drop due to the Bernoulli Effect, which strengthens the RFD occlusion. Also, restriction within the inflow channel causes the RFD occlusion to rapidly deepen as air is evacuated upward through the mesocyclone at a faster rate than can be replaced below. The tornado forms after the RFD occlusion matures beneath the low-level meso, most often in the RFD’s northeast quadrant. The descending reflectivity core (DRC) is in dark gray, which wraps around the RFD occlusion near the tornado start time (see Part 2).
11) RFD Surge Identification Method.pdf
An RFD surge was found for all 208 cases. The following method was used to identify the start and end points of the RFD surge, and to measure the RFD surge’s speed relative to the supercell’s speed.
First, the case was loaded and studied for about 15 minutes. The tornado start location was marked. Then, the RFD boundary location was estimated at high confidence times before and after the tornado start time. The examination paid close attention to the movement of precipitation behind the RFD boundary. Four questions listed below, were asked in order to determine when the RFD surge started and ended.
1) When did the precipitation gradient, just behind the RFD boundary, begin to accelerate relative to the storm’s movement?
2) When did the precipitation gradient, just behind the RFD boundary, obtain a bowed or curved appearance?
3) When did the precipitation gradient, just behind the RFD boundary, reach the forward flank?
4) When did the precipitation gradient, just behind the RFD boundary, decelerate relative to the storm’s movement?
Reflectivity data were used exclusively to determine when the RFD surge began and ended. The RFD surge was considered a time period when the leading edge of precipitation, just behind the RFD boundary, moved at a speed faster than the supercell’s speed. This involved an acceleration and then deceleration of the leading edge of precipitation.
11a) RFD Surge Analysis - Sibley, Iowa EF4 Tornado on June 25, 2010.pdf
RFD surge analysis for the Sibley, Iowa EF4 tornado on June 25, 2010. A cell merger ongoing in panel 1, instigates the RFD surge. The RFD surge starting point (panel 2) and ending point (panel 6), are marked. During the RFD surge, the reflectivity structure bulges and rapidly expands (panel 3 and 4). A bowing shape develops in panel 5. The RFD surge ends when it reaches the forward flank (panel 6).
12) Average RFD Surge Times Relative To Tornado Start Time For All 208 Superc...
Sorted distribution of RFD surge storm relative speed for all 208 supercells. The average RFD surge storm relative speed ranged from just under two knots to just over 20 knots. The RFD’s primary role during tornadogenesis is to move the RFD boundary toward the FFD boundary, in order to create an inflow channel. A fast storm relative speed is not necessary to accomplish this task.
13) RFD Surge Type 1 (66.3 Percent) Rozel, KS EF4 - 5-19-2013.pdf
Type 1 RFD surge (at right), in which the low-level mesocyclone is initially above the RFD. During the RFD surge, the RFD boundary moves toward the supercell’s forward flank. The RFD occlusion develops and matures, which is followed by tornado formation in the RFD occlusion. The tornado most often forms in the northeast quadrant of the RFD.
For the Rozel, Kansas EF4 tornado on May 19, 2013 (at right), a prominent cell merger started the RFD surge. The mesocyclone was located to the west of the RFD boundary (panel 1). The cell merger caused an enhanced downdraft to move southeast, creating a long pendant (panel 2). The RFD occlusion developed at the pendant’s southeast end. The tornado formed as the RFD boundary surged northeastward toward the forward flank. This created a narrow inflow channel (panel 3 and 4). 300 meter ground-relative flow is estimated based on cell movement and outflow.
14) RFD Surge Type (30.3 Percent) Fackler, AL EF4 - 4-27-2011.pdf
Type 2 RFD surge (at right), in which the RFD surge is initially ahead of the RFD boundary. The RFD boundary moves underneath the low-level mesocyclone and then away toward the forward flank. The RFD occlusion develops and matures after the low-level mesocyclone has been undercut. This is followed by tornado formation within the RFD occlusion.
For the Fackler, Alabama EF4 tornado on April 27, 2011 (to right), the RFD surge was instigated by cell mergers to the southwest of the RFD boundary. The RFD surge was very strong, with a 117 knot max outbound noted in panel two. The inflow channel became narrow as the RFD boundary pushed toward the forward flank (panel 3). Reflectors quickly disappear around the new tornado (panel 4), likely due to absorption by the rapidly strengthening tornado. 300 meter ground-relative flow is estimated based on cell movement and outflow.
15) RFD Surge Type (3.4 Percent) Ravanna, KS EF3 - 5-24-2016.pdf
Type 3 RFD surge (at right), in which the low-level mesocyclone is initially ahead of the RFD boundary. The RFD boundary surges toward the supercell’s forward flank, and to the center of the low-level mesocyclone. An RFD occlusion forms on the RFD boundary, underneath the low-level mesocyclone. The tornado develops within the RFD occlusion, on the RFD boundary, eventually moving southwestward into the RFD.
For the Ravanna, Kansas EF3 tornado on May 24, 2016 (at right), the mesocyclone was initially to the east of the RFD boundary. The RFD surge was instigated by outflow associated with cell mergers west of the boundary (panel 2). As the RFD surged toward the forward flank, the RFD occlusion developed on the RFD boundary (panel 2 and 3). Then, the tornado formed in the RFD occlusion (panel 4). 300 meter ground-relative flow is estimated based on cell movement and outflow.
16) Northward-moving Wave Disrupts RFD and EF4 Tornado near Goldsby, OK on Ma...
An example showing the Goldsby, Oklahoma EF4 tornado on May 24, 2011, in which the RFD was disrupted by a northward-moving wave. First, a left-moving supercell from north Texas approached the Goldsby supercell at near 65 nautical miles per hour. Outflow associated with the cell merger enhances vertical vorticity, causing the tornado to strengthen and reach peak intensity (panel 2). After the cell merger, a northward-moving wave associated with the left-mover, hit the Goldsby supercell’s RFD. The back edge of the RFD retreated northward (panels 4, 5 and 6), and eventually the backed flow associated with the northward-moving wave pushed the flanking line precipitation away from the mesocyclone (panels 7 and 8). This disrupted the RFD causing the tornado to dissipate.
17) EF3 Forms After 2nd RFD Surge Undercuts Low-level Meso at Hillsboro, ND o...
An example showing the Hillsboro, North Dakota EF3 tornadic supercell on August 27, 2016, in which there were two RFD surges. The first RFD surge did not produce a tornado, while the second did. The first RFD surge pushed southward and did not undercut the low-level mesocyclone. Veered flow at 700 mb and a lack of cell mergers were limiting factors, keeping the first RFD surge to the west of the low-level meso. The second RFD surge pushed eastward, undercutting the low-level meso. The second RFD surge was aided by cell outflow and cell mergers during the 15 minutes preceding the tornado. Veered low to mid-level flow, associated with northwest flow aloft, can contribute to a problem in which a supercell’s RFD surge takes place too far west. When this happens, it can be difficult for the RFD to undercut the low-level mesocyclone. This problem makes tornadogenesis more unlikely in summer.
18) Times of Cell Mergers Associated with Tornadogenesis Relative To Tornado ...
During the cell merger analysis, all 208 cases were examined twice. The first examination pass identified cell mergers that occurred closer to the tornado start time. Within this first pass, clustering within the distribution was found at two time periods. The first was found to occur just a few minutes prior to the tornado start time. A second was found further out in time, generally between five and ten minutes prior to the tornado. During the first examination, it was observed that another cell merger was commonly occurring more than 10 minutes prior to the tornado start time. And this cell merger was often happening just before the start of the RFD surge. As a result, a second pass through the 208 cases was completed to identify cell mergers further out before the tornado start time. The cell merger that was identified during the second pass was called cell merger one, while the two cell mergers that were identified during the first pass were called cell merger two and three. After all the analysis was done, a cell merger two was found in more cases than a cell merger one. This is because a cell merger midway through the tornadogenesis process was slightly more common than a cell merger near the beginning of the tornadogenesis process. The first and second examinations were completely independent of each other, which revealed more detail concerning the distribution.
Using the three periods of cell merger clustering, average times prior to the tornado start time were computed. The 208 case average of those times are listed below, with the number of cases identified for each time, and the percent of occurrence listed in Table 1.
19) Location of 77 Cell Mergers That Instigated RFD Surges Relative To Pendan...
The locations of cell merger one for 77 cell mergers relative to the pendant, that likely instigated RFD surges prior to high-end tornadogenesis from June 5, 2010 to March 15, 2012.
19a) Cell Merger Instigating RFD Surge for Canton, Oklahoma EF3 on May 24, 20...
The cell merger that instigated the RFD surge prior to the EF3 tornado at Canton, OK on May 24, 2011. In this case, the merging cell was less than 20 DBZ (upper left and upper middle). But the cell rapidly intensified just before the merger. We found some cases where a weak cell (<= 35 DBZ) was involved with a cell merger likely important to tornadogenesis.
More from JohnChrisBroyles (20)
6a) RFD-FFD Boundary Locations For Six Well-organized HIgh-end Supercells.pdf
6a) RFD-FFD Boundary Locations For Six Well-organized HIgh-end Supercells.pdf
6c) Schematic of a Classic Rear Flank Downdraft.pdf
6c) Schematic of a Classic Rear Flank Downdraft.pdf
6d) Base Velocity Estimate Overlaid on Reflectivity Base Velocity RFD Boundar...
6d) Base Velocity Estimate Overlaid on Reflectivity Base Velocity RFD Boundar...
7) Estimated Tornado Start Location Relative To RFD Boundary Location For 208...
7) Estimated Tornado Start Location Relative To RFD Boundary Location For 208...
8a) Tornado Start Location Frequency Relative To RFD Boundary Position For 20...
8a) Tornado Start Location Frequency Relative To RFD Boundary Position For 20...
9) EF5 Tornado Frequency Relative To RFD Boundary and EF4-EF5 Tornado Frequen...
9) EF5 Tornado Frequency Relative To RFD Boundary and EF4-EF5 Tornado Frequen...
10) Hypothesis - Critical Role of the RFD Surge, Schematic Created and Modifi...
10) Hypothesis - Critical Role of the RFD Surge, Schematic Created and Modifi...
10a) Schematic of RFD Surging Beneath Mesocyclone with Rapid Intensification ...
10a) Schematic of RFD Surging Beneath Mesocyclone with Rapid Intensification ...
11a) RFD Surge Analysis - Sibley, Iowa EF4 Tornado on June 25, 2010.pdf
11a) RFD Surge Analysis - Sibley, Iowa EF4 Tornado on June 25, 2010.pdf
12) Average RFD Surge Times Relative To Tornado Start Time For All 208 Superc...
12) Average RFD Surge Times Relative To Tornado Start Time For All 208 Superc...
13) RFD Surge Type 1 (66.3 Percent) Rozel, KS EF4 - 5-19-2013.pdf
13) RFD Surge Type 1 (66.3 Percent) Rozel, KS EF4 - 5-19-2013.pdf
14) RFD Surge Type (30.3 Percent) Fackler, AL EF4 - 4-27-2011.pdf
14) RFD Surge Type (30.3 Percent) Fackler, AL EF4 - 4-27-2011.pdf
15) RFD Surge Type (3.4 Percent) Ravanna, KS EF3 - 5-24-2016.pdf
15) RFD Surge Type (3.4 Percent) Ravanna, KS EF3 - 5-24-2016.pdf
16) Northward-moving Wave Disrupts RFD and EF4 Tornado near Goldsby, OK on Ma...
16) Northward-moving Wave Disrupts RFD and EF4 Tornado near Goldsby, OK on Ma...
17) EF3 Forms After 2nd RFD Surge Undercuts Low-level Meso at Hillsboro, ND o...
17) EF3 Forms After 2nd RFD Surge Undercuts Low-level Meso at Hillsboro, ND o...
18) Times of Cell Mergers Associated with Tornadogenesis Relative To Tornado ...
18) Times of Cell Mergers Associated with Tornadogenesis Relative To Tornado ...
19) Location of 77 Cell Mergers That Instigated RFD Surges Relative To Pendan...
19) Location of 77 Cell Mergers That Instigated RFD Surges Relative To Pendan...
19a) Cell Merger Instigating RFD Surge for Canton, Oklahoma EF3 on May 24, 20...
19a) Cell Merger Instigating RFD Surge for Canton, Oklahoma EF3 on May 24, 20...
Recently uploaded
Structures and textures of metamorphic rocks
It is useful for the Under Graduating students for easy understanding and it's useful for the exam preparations.
Multi-source connectivity as the driver of solar wind variability in the heli...
The ambient solar wind that flls the heliosphere originates from multiple
sources in the solar corona and is highly structured. It is often described
as high-speed, relatively homogeneous, plasma streams from coronal
holes and slow-speed, highly variable, streams whose source regions are
under debate. A key goal of ESA/NASA’s Solar Orbiter mission is to identify
solar wind sources and understand what drives the complexity seen in the
heliosphere. By combining magnetic feld modelling and spectroscopic
techniques with high-resolution observations and measurements, we show
that the solar wind variability detected in situ by Solar Orbiter in March
2022 is driven by spatio-temporal changes in the magnetic connectivity to
multiple sources in the solar atmosphere. The magnetic feld footpoints
connected to the spacecraft moved from the boundaries of a coronal hole
to one active region (12961) and then across to another region (12957). This
is refected in the in situ measurements, which show the transition from fast
to highly Alfvénic then to slow solar wind that is disrupted by the arrival of
a coronal mass ejection. Our results describe solar wind variability at 0.5 au
but are applicable to near-Earth observatories.
Cancer cell metabolism: special Reference to Lactate Pathway
Normal Cell Metabolism:
Cellular respiration describes the series of steps that cells use to break down sugar and other chemicals to get the energy we need to function.
Energy is stored in the bonds of glucose and when glucose is broken down, much of that energy is released.
Cell utilize energy in the form of ATP.
The first step of respiration is called glycolysis. In a series of steps, glycolysis breaks glucose into two smaller molecules - a chemical called pyruvate. A small amount of ATP is formed during this process.
Most healthy cells continue the breakdown in a second process, called the Kreb's cycle. The Kreb's cycle allows cells to “burn” the pyruvates made in glycolysis to get more ATP.
The last step in the breakdown of glucose is called oxidative phosphorylation (Ox-Phos).
It takes place in specialized cell structures called mitochondria. This process produces a large amount of ATP. Importantly, cells need oxygen to complete oxidative phosphorylation.
If a cell completes only glycolysis, only 2 molecules of ATP are made per glucose. However, if the cell completes the entire respiration process (glycolysis - Kreb's - oxidative phosphorylation), about 36 molecules of ATP are created, giving it much more energy to use.
IN CANCER CELL:
Unlike healthy cells that "burn" the entire molecule of sugar to capture a large amount of energy as ATP, cancer cells are wasteful.
Cancer cells only partially break down sugar molecules. They overuse the first step of respiration, glycolysis. They frequently do not complete the second step, oxidative phosphorylation.
This results in only 2 molecules of ATP per each glucose molecule instead of the 36 or so ATPs healthy cells gain. As a result, cancer cells need to use a lot more sugar molecules to get enough energy to survive.
introduction to WARBERG PHENOMENA:
WARBURG EFFECT Usually, cancer cells are highly glycolytic (glucose addiction) and take up more glucose than do normal cells from outside.
Otto Heinrich Warburg (; 8 October 1883 – 1 August 1970) In 1931 was awarded the Nobel Prize in Physiology for his "discovery of the nature and mode of action of the respiratory enzyme.
WARNBURG EFFECT : cancer cells under aerobic (well-oxygenated) conditions to metabolize glucose to lactate (aerobic glycolysis) is known as the Warburg effect. Warburg made the observation that tumor slices consume glucose and secrete lactate at a higher rate than normal tissues.
SCHIZOPHRENIA Disorder/ Brain Disorder.pdf
This pdf is about the Schizophrenia.
For more details visit on YouTube; @SELF-EXPLANATORY;
https://www.youtube.com/channel/UCAiarMZDNhe1A3Rnpr_WkzA/videos
Thanks...!
RNA INTERFERENCE: UNRAVELING GENETIC SILENCING
Introduction:
RNA interference (RNAi) or Post-Transcriptional Gene Silencing (PTGS) is an important biological process for modulating eukaryotic gene expression.
It is highly conserved process of posttranscriptional gene silencing by which double stranded RNA (dsRNA) causes sequence-specific degradation of mRNA sequences.
dsRNA-induced gene silencing (RNAi) is reported in a wide range of eukaryotes ranging from worms, insects, mammals and plants.
This process mediates resistance to both endogenous parasitic and exogenous pathogenic nucleic acids, and regulates the expression of protein-coding genes.
What are small ncRNAs?
micro RNA (miRNA)
short interfering RNA (siRNA)
Properties of small non-coding RNA:
Involved in silencing mRNA transcripts.
Called “small” because they are usually only about 21-24 nucleotides long.
Synthesized by first cutting up longer precursor sequences (like the 61nt one that Lee discovered).
Silence an mRNA by base pairing with some sequence on the mRNA.
Discovery of siRNA?
The first small RNA:
In 1993 Rosalind Lee (Victor Ambros lab) was studying a non- coding gene in C. elegans, lin-4, that was involved in silencing of another gene, lin-14, at the appropriate time in the
development of the worm C. elegans.
Two small transcripts of lin-4 (22nt and 61nt) were found to be complementary to a sequence in the 3' UTR of lin-14.
Because lin-4 encoded no protein, she deduced that it must be these transcripts that are causing the silencing by RNA-RNA interactions.
Types of RNAi ( non coding RNA)
MiRNA
Length (23-25 nt)
Trans acting
Binds with target MRNA in mismatch
Translation inhibition
Si RNA
Length 21 nt.
Cis acting
Bind with target Mrna in perfect complementary sequence
Piwi-RNA
Length ; 25 to 36 nt.
Expressed in Germ Cells
Regulates trnasposomes activity
MECHANISM OF RNAI:
First the double-stranded RNA teams up with a protein complex named Dicer, which cuts the long RNA into short pieces.
Then another protein complex called RISC (RNA-induced silencing complex) discards one of the two RNA strands.
The RISC-docked, single-stranded RNA then pairs with the homologous mRNA and destroys it.
THE RISC COMPLEX:
RISC is large(>500kD) RNA multi- protein Binding complex which triggers MRNA degradation in response to MRNA
Unwinding of double stranded Si RNA by ATP independent Helicase
Active component of RISC is Ago proteins( ENDONUCLEASE) which cleave target MRNA.
DICER: endonuclease (RNase Family III)
Argonaute: Central Component of the RNA-Induced Silencing Complex (RISC)
One strand of the dsRNA produced by Dicer is retained in the RISC complex in association with Argonaute
ARGONAUTE PROTEIN :
1.PAZ(PIWI/Argonaute/ Zwille)- Recognition of target MRNA
2.PIWI (p-element induced wimpy Testis)- breaks Phosphodiester bond of mRNA.)RNAse H activity.
MiRNA:
The Double-stranded RNAs are naturally produced in eukaryotic cells during development, and they have a key role in regulating gene expression .
insect taxonomy importance systematics and classification
documents provide information about insect classification and taxonomy of insect
insect morphology and physiology of insect
the documents provide complete information of insect morphology and their structure
Unveiling the Energy Potential of Marshmallow Deposits.pdf
Unveiling the Energy Potential of Marshmallow Deposits: A Revolutionary
Breakthrough in Sustainable Energy Science
filosofia boliviana introducción jsjdjd.pptx
La filosofía boliviana y la búsqueda por construir pensamientos propios
Citrus Greening Disease and its Management
Citrus Greening was one of the major causes of decline in the citrus production. So, effective management cultural practices should be incorporated
Richard's aventures in two entangled wonderlands
Since the loophole-free Bell experiments of 2020 and the Nobel prizes in physics of 2022, critics of Bell's work have retreated to the fortress of super-determinism. Now, super-determinism is a derogatory word - it just means "determinism". Palmer, Hance and Hossenfelder argue that quantum mechanics and determinism are not incompatible, using a sophisticated mathematical construction based on a subtle thinning of allowed states and measurements in quantum mechanics, such that what is left appears to make Bell's argument fail, without altering the empirical predictions of quantum mechanics. I think however that it is a smoke screen, and the slogan "lost in math" comes to my mind. I will discuss some other recent disproofs of Bell's theorem using the language of causality based on causal graphs. Causal thinking is also central to law and justice. I will mention surprising connections to my work on serial killer nurse cases, in particular the Dutch case of Lucia de Berk and the current UK case of Lucy Letby.
Recently uploaded (20)
Multi-source connectivity as the driver of solar wind variability in the heli...
Multi-source connectivity as the driver of solar wind variability in the heli...
Cancer cell metabolism: special Reference to Lactate Pathway
Cancer cell metabolism: special Reference to Lactate Pathway
insect taxonomy importance systematics and classification
insect taxonomy importance systematics and classification
Unveiling the Energy Potential of Marshmallow Deposits.pdf
Unveiling the Energy Potential of Marshmallow Deposits.pdf
Mammalian Pineal Body Structure and Also Functions
Mammalian Pineal Body Structure and Also Functions
Body fluids_tonicity_dehydration_hypovolemia_hypervolemia.pptx
Body fluids_tonicity_dehydration_hypovolemia_hypervolemia.pptx