Uncovering a Population of Gravitational Lens Galaxies with Magnified Standard Candle SN Zwicky
•
1 like•1,618 views

1) ZTF observations led to the discovery of a multiply imaged type Ia supernova (SN Zwicky) magnified nearly 25-fold thanks to its nature as a standard candle. 2) High-resolution imaging with Keck resolved four images of the supernova with very small angular separation, corresponding to an Einstein radius of only 0.167′′. 3) Spectroscopy determined redshift of the supernova host (z=0.3544) and lensing galaxy (z=0.2262), finding the lensing effect to be unusually small.
![Nature Astronomy
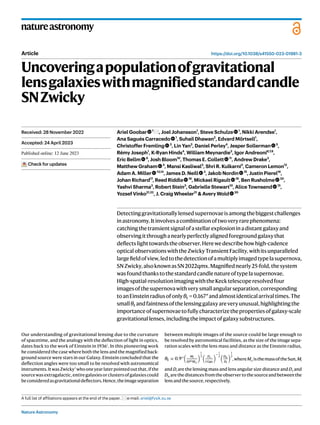
Article https://doi.org/10.1038/s41550-023-01981-3
relatively small mirror of the telescope, light pollution, non-optimal
atmospheric conditions and only having three optical filters at the
P48 telescope. Furthermore, ZTF typically obtains an image quality
(angular resolution) of 2″ full-width at half-maximum (FWHM), and
thecamerahasrelativelylarge1″pixels.Hence,inmostinstances,itis
practicallyimpossibletospatiallyresolvemultiple-imagesystemswith
ZTF. Instead, the search for lensed sources makes use of the standard
candle nature of type Ia supernovae, that is, they have nearly identi-
calpeakluminosities.Theseexplosionsareusedasaccuratedistance
estimatorsincosmology,whichledtothediscoveryoftheaccelerated
expansion of the universe (ref. 13 and references therein).
In addition to an imaging survey telescope, ZTF has access to a
low-spectral-resolutionintegral-fieldspectrograph,theSEDMachine
(SEDM)14
,ontheneighbouring1.5 mtelescopeatPalomar(P60),used
tospectroscopicallyclassifyabouttensupernovaeeverynightaspart
of the Bright Transient Survey (BTS), where transients brighter than
19 magareclassifiedwithintimescalesofafewdays,aimingtoobtain
>95% spectroscopic completeness to 18.5 mag or brighter15
. Besides
providing the classification of the transients, the SEDM spectrum is
usedtomeasuretheSNredshift.
Stronglylensedsupernovaeintheeraof
wide-fieldtime-domainsurveys
Besidesthemanyobservationsoflensedgalaxiesandquasars,thefeasi-
bilityofobservingstronggravitationallensingofexplosivetransientsin
thedistantuniversehasonlybeendemonstratedinrecentyears(refs.3–5
andreferencestherein).PS1-10afxwasthefirsthighlymagnifiedtype
Ia supernova (SN Ia) discovered. However, the lensing interpretation
wasmadethreeyearsaftertheexplosion6,7
;bythentheSNwastoofaint
to resolve multiple images. Since then, the use of wide-field optical
cameras in robotic telescopes at the Palomar Observatory has led to
notablebreakthroughs.Inref.8wereportedthediscoveryofamultiply
imaged SN Ia, iPTF16geu (SN 2016geu), by the intermediate Palomar
Transient Factory (iPTF), a time-domain survey using a 7.3°2
camera
on the P48 (1.2 m) telescope from 2013 to 2017. In 2018, a new camera
was installed9
with a field of view of 47°2
. The project, known as the
Zwicky Transient Facility (ZTF)10,11
, has been monitoring the northern
sky with a 2–3 d cadence in at least two optical filters for the past four
years12
. The very large sky coverage makes ZTF well suited to search
for rare phenomena, such as gravitational lensing of supernovae. On
theotherhand,thedistance(redshift)probedbyZTFislimitedbythe
6,000
P60/SEDM, Aug. 21.2
NOT/ALFOSC, Aug. 22.9
SN 2012cg (shifted to z = 0.354)
Keck/LRIS, Aug. 23.3
5,000
Restframe wavelength (Å)
4,000
3,000
4,000
3,700 3,800 3,900 4,000 5,800 5,900 6,000 6,600
Restframe wavelength (Å)
Host
Lens
[O II] Ca II H&K Na I D Hα [N II] [S II]
Restframe wavelength (Å)
Observed wavelength (Å)
Restframe wavelength (Å)
6,700
5,000 6,000 7,000 8,000 9,000
–14
–15
log
F
λ
+
offset
(erg
cm
−2
s
−1
Å
−1
)
Normalized
F
λ
–16
–17
Fig.1|SpectroscopicidentificationofSNZwickyasanSNIaandredshift
measurementsoftheSNhostgalaxyandtheinterveninglensinggalaxy.
TheSNspectraobtainedwiththeP60,NordicOpticalTelescope(NOT)andKeck
telescopes(blacklines)arebestfittedbyanormalSNIaspectraltemplate.The
greenlineshowsacomparisonwiththenearbytypeIaSN2012cg69
atasimilar
restframephase,redshiftedtoz = 0.354.TheSNfluxpeakedon2022August17.
Thebottompanelsshowazoomed-inviewofaVLT/MUSEspectrumfrom2022
September30,displayingnarrowabsorptionandemissionlines,fromwhich
preciseredshiftsofthelens(z = 0.2262)andhost(z = 0.3544)galaxieswere
determined.[Oii],CaiiHandK,Nai D,Hα,[Nii]and[Sii]linescanbeseenatthe
restframeofthelens(bluelines)andhost(redlines)galaxies.ALFOSC,Alhambra
FaintObjectSpectrographandCamera.](data:image/gif;base64,R0lGODlhAQABAIAAAAAAAP///yH5BAEAAAAALAAAAAABAAEAAAIBRAA7)
Recommended
Recommended
More Related Content
Similar to Uncovering a Population of Gravitational Lens Galaxies with Magnified Standard Candle SN Zwicky
Similar to Uncovering a Population of Gravitational Lens Galaxies with Magnified Standard Candle SN Zwicky (20)
More from Sérgio Sacani
More from Sérgio Sacani (20)
Recently uploaded
Recently uploaded (20)
Uncovering a Population of Gravitational Lens Galaxies with Magnified Standard Candle SN Zwicky
- 1. Nature Astronomy natureastronomy https://doi.org/10.1038/s41550-023-01981-3 Article Uncoveringapopulationofgravitational lensgalaxieswithmagnifiedstandardcandle SNZwicky Ariel Goobar 1 , Joel Johansson1 , Steve Schulze 1 , Nikki Arendse1 , Ana Sagués Carracedo 1 , Suhail Dhawan2 , Edvard Mörtsell1 , Christoffer Fremling 3 , Lin Yan3 , Daniel Perley4 , Jesper Sollerman 5 , Rémy Joseph1 , K-Ryan Hinds4 , William Meynardie3 , Igor Andreoni6,7,8 , Eric Bellm 9 , Josh Bloom10 , Thomas E. Collett 11 , Andrew Drake3 , Matthew Graham 3 , Mansi Kasliwal3 , Shri R. Kulkarni3 , Cameron Lemon12 , Adam A. Miller 13,14 , James D. Neill 3 , Jakob Nordin 15 , Justin Pierel16 , Johan Richard17 , Reed Riddle 18 , Mickael Rigault 19 , Ben Rusholme 20 , Yashvi Sharma3 , Robert Stein3 , Gabrielle Stewart10 , Alice Townsend 15 , Yozsef Vinko21,22 , J. Craig Wheeler21 & Avery Wold 20 Detectinggravitationallylensedsupernovaeisamongthebiggestchallenges inastronomy.Itinvolvesacombinationoftwoveryrarephenomena: catchingthetransientsignalofastellarexplosioninadistantgalaxyand observingitthroughanearlyperfectlyalignedforegroundgalaxythat deflectslighttowardstheobserver.Herewedescribehowhigh-cadence opticalobservationswiththeZwickyTransientFacility,withitsunparalleled largefieldofview,ledtothedetectionofamultiplyimagedtypeIasupernova, SNZwicky,alsoknownasSN2022qmx.Magnifiednearly25-fold,thesystem wasfoundthankstothestandardcandlenatureoftypeIasupernovae. High-spatial-resolutionimagingwiththeKecktelescoperesolvedfour imagesofthesupernovawithverysmallangularseparation,corresponding toanEinsteinradiusofonlyθE = 0.167″andalmostidenticalarrivaltimes.The smallθE andfaintnessofthelensinggalaxyareveryunusual,highlightingthe importanceofsupernovaetofullycharacterizethepropertiesofgalaxy-scale gravitationallenses,includingtheimpactofgalaxysubstructures. Our understanding of gravitational lensing due to the curvature of spacetime, and the analogy with the deflection of light in optics, dates back to the work of Einstein in 19361 . In this pioneering work he considered the case where both the lens and the magnified back- ground source were stars in our Galaxy. Einstein concluded that the deflection angles were too small to be resolved with astronomical instruments.ItwasZwicky2 whooneyearlaterpointedoutthat,ifthe sourcewasextragalactic,entiregalaxiesorclustersofgalaxiescould beconsideredasgravitationaldeflectors.Hence,theimageseparation between multiple images of the source could be large enough to be resolved by astronomical facilities, as the size of the image sepa- ration scales with the lens mass and distance as the Einstein radius, θE ≈ 0.9′′ ( Ml 1011M⊙ ) 1 2 ( Ds 1 Gpc ) − 1 2 ( Dls Dl ) 1 2 ,whereM⊙ isthemassoftheSun,Ml and Dl are the lensing mass and lens angular size distance and Ds and Dls are the distances from the observer to the source and between the lens and the source, respectively. Received: 28 November 2022 Accepted: 24 April 2023 Published online: xx xx xxxx Check for updates A full list of affiliations appears at the end of the paper. e-mail: ariel@fysik.su.se
- 2. Nature Astronomy Article https://doi.org/10.1038/s41550-023-01981-3 relatively small mirror of the telescope, light pollution, non-optimal atmospheric conditions and only having three optical filters at the P48 telescope. Furthermore, ZTF typically obtains an image quality (angular resolution) of 2″ full-width at half-maximum (FWHM), and thecamerahasrelativelylarge1″pixels.Hence,inmostinstances,itis practicallyimpossibletospatiallyresolvemultiple-imagesystemswith ZTF. Instead, the search for lensed sources makes use of the standard candle nature of type Ia supernovae, that is, they have nearly identi- calpeakluminosities.Theseexplosionsareusedasaccuratedistance estimatorsincosmology,whichledtothediscoveryoftheaccelerated expansion of the universe (ref. 13 and references therein). In addition to an imaging survey telescope, ZTF has access to a low-spectral-resolutionintegral-fieldspectrograph,theSEDMachine (SEDM)14 ,ontheneighbouring1.5 mtelescopeatPalomar(P60),used tospectroscopicallyclassifyabouttensupernovaeeverynightaspart of the Bright Transient Survey (BTS), where transients brighter than 19 magareclassifiedwithintimescalesofafewdays,aimingtoobtain >95% spectroscopic completeness to 18.5 mag or brighter15 . Besides providing the classification of the transients, the SEDM spectrum is usedtomeasuretheSNredshift. Stronglylensedsupernovaeintheeraof wide-fieldtime-domainsurveys Besidesthemanyobservationsoflensedgalaxiesandquasars,thefeasi- bilityofobservingstronggravitationallensingofexplosivetransientsin thedistantuniversehasonlybeendemonstratedinrecentyears(refs.3–5 andreferencestherein).PS1-10afxwasthefirsthighlymagnifiedtype Ia supernova (SN Ia) discovered. However, the lensing interpretation wasmadethreeyearsaftertheexplosion6,7 ;bythentheSNwastoofaint to resolve multiple images. Since then, the use of wide-field optical cameras in robotic telescopes at the Palomar Observatory has led to notablebreakthroughs.Inref.8wereportedthediscoveryofamultiply imaged SN Ia, iPTF16geu (SN 2016geu), by the intermediate Palomar Transient Factory (iPTF), a time-domain survey using a 7.3°2 camera on the P48 (1.2 m) telescope from 2013 to 2017. In 2018, a new camera was installed9 with a field of view of 47°2 . The project, known as the Zwicky Transient Facility (ZTF)10,11 , has been monitoring the northern sky with a 2–3 d cadence in at least two optical filters for the past four years12 . The very large sky coverage makes ZTF well suited to search for rare phenomena, such as gravitational lensing of supernovae. On theotherhand,thedistance(redshift)probedbyZTFislimitedbythe 6,000 P60/SEDM, Aug. 21.2 NOT/ALFOSC, Aug. 22.9 SN 2012cg (shifted to z = 0.354) Keck/LRIS, Aug. 23.3 5,000 Restframe wavelength (Å) 4,000 3,000 4,000 3,700 3,800 3,900 4,000 5,800 5,900 6,000 6,600 Restframe wavelength (Å) Host Lens [O II] Ca II H&K Na I D Hα [N II] [S II] Restframe wavelength (Å) Observed wavelength (Å) Restframe wavelength (Å) 6,700 5,000 6,000 7,000 8,000 9,000 –14 –15 log F λ + offset (erg cm −2 s −1 Å −1 ) Normalized F λ –16 –17 Fig.1|SpectroscopicidentificationofSNZwickyasanSNIaandredshift measurementsoftheSNhostgalaxyandtheinterveninglensinggalaxy. TheSNspectraobtainedwiththeP60,NordicOpticalTelescope(NOT)andKeck telescopes(blacklines)arebestfittedbyanormalSNIaspectraltemplate.The greenlineshowsacomparisonwiththenearbytypeIaSN2012cg69 atasimilar restframephase,redshiftedtoz = 0.354.TheSNfluxpeakedon2022August17. Thebottompanelsshowazoomed-inviewofaVLT/MUSEspectrumfrom2022 September30,displayingnarrowabsorptionandemissionlines,fromwhich preciseredshiftsofthelens(z = 0.2262)andhost(z = 0.3544)galaxieswere determined.[Oii],CaiiHandK,Nai D,Hα,[Nii]and[Sii]linescanbeseenatthe restframeofthelens(bluelines)andhost(redlines)galaxies.ALFOSC,Alhambra FaintObjectSpectrographandCamera.
- 3. Nature Astronomy Article https://doi.org/10.1038/s41550-023-01981-3 ThediscoveryofSNZwicky LensedsystemcandidatesareselectedbyZTFforfurtherspectroscopic screeningwhenanSNIaisfoundataredshiftabovez = 0.2,wherethere isessentiallynegligiblesensitivityfordetectionintheBTS,unlessthe SN is greatly magnified by an intervening deflector. This was the case forSNZwicky(alsoknownasZTF22aaylnhqandSN2022qmx),located at right ascension 17 h 35 min 44.32 s and declination 4° 49′ 56.90″ (J2000.0), where an SEDM spectrum from 2022 August 21 showed it tobeanSNIaatz = 0.35,asshowninFig.1.Atthatpointwealertedthe SN community to the discovery of a lensed SN Ia16 . SpectroscopicobservationsfollowingthetimeevolutionoftheSN werecarriedoutusingmultiplefacilities:the2.56 mNordicOpticalTel- escopeintheCanaryIslands,theKeckobservatoryinHawaii,the11 m Hobby–Eberly Telescope at the McDonald Observatory in Texas and theEuropeanSouthernObservatory(ESO)’s8 mVeryLargeTelescope (VLT)attheParanalObservatoryinChile.Inparticular,multiplenarrow emissionandabsorptionlinesoftheSNhostgalaxywerefoundwiththe LowResolutionImagingSpectrometer(LRIS)/KeckandtheMulti-Unit Spectroscopic Explorer (MUSE)/VLT, refining the source redshift to z = 0.3544, as shown in the bottom panels of Fig. 1. As the SN faded andtheforegroundgalaxyspectralenergydistributionbecamemore prominent, the Ca ii doublet λλ3,933, 3,968 was found in absorption linesredshiftedtoz = 0.22615,thelocationofthedeflectinggalaxy. Follow-upobservations ThediscoveryfromZTFwasalsofollowedupwithhigh-spatial-resolution instruments.Observationswithlaserguidestarenhancedseeingatthe VLT with the High Acuity Wide-field K-band Imager (HAWK-I) imag- ing camera in the near infrared, and optical spectrophotometry with MUSE, reduced the point spread function (PSF) width to about 0.4″. However,thiswasstillnotenoughtoresolvethesystem.On2022Sep- tember15,multipleimagesofthesystemwereresolvedatnear-infrared wavelengths at the Keck telescope, using the Laser Guide Star Aided AdaptiveOptics(LGSAO)withNear-IRCamera2(NIRC2)17 ,yieldingan imagequalityof0.09″FWHMintheJbandcentredat1.2 μm,shownin Fig. 2, where the four SN images are labelled A–D. OnSeptember21,followingourannouncementofthediscovery16 , apreviouslyapprovedprogrammeaimedtotargetlensedsupernovae by the LensWatch collaboration resolved the multiple images of SN Zwicky using the optical filters F475W, F625W and F814W (where the names correspond to the approximate location of the central wave- lengthinnanometres)ontheUVIS/WFC3cameraontheHubbleSpace Telescope (HST)18 . A detailed description of the HST observations of SNZwickyispresentedinref.19. Results Figure3showstheunresolvedphotometricground-basedobservations collected at P48 and the Liverpool Telescope in the Canary Islands between2022August1andOctober30.Thesewereusedtoestimatethe peakfluxandlightcurvepropertiesoftheSNwiththeSALT2lightcurve fitting tool20 , including corrections for lightcurve shape and colour excessgiventheSNredshift,aswellastheextinctionintheMilkyWay in the direction of the SN . Furthermore, the four resolved SN images were used to explore the possibility of additional reddening by dust inthelensinggalaxy.Unaccounted-fordimmingoflightwouldleadto an underestimation of the lensing amplification. The HST and NIRC2 observationsforeachSNimagewerecomparedwiththeSNIaspectral templatefromref.21,allowingforpossibledifferentialdustextinction in the lens following the reddening law in ref. 22. No evidence for differential extinction between the different images was found. The lightcurve fit model included the four indi- vidual SN images, described by the SALT2 model with arbitrary time delays, but otherwise sharing the same lightcurve shape and colour parameters,x1 andc.Thetimedelayswereconstrainedbyaprioronthe imagefluxratiosfromtheNIRC2observationsshowninFig.2.Wefind ΔtAB = −0.4 ± 2.9,ΔtAC = −0.1 ± 2.3andΔtAD = −0.1 ± 2.7(inunitsofdays), where the indices A–D refer to the SN images in Fig. 2. The resulting lightcurve fit is shown in Fig. 3 and compared with the SALT2 model. ThesmalltimedelaysarealsoconsistentwiththespectraofSNZwicky showninFig.1beingatasingleSNphase. The fitted SN model parameters are x1 = 1.083 ± 0.094 and c = −0.007 ± 0.007. The lack of colour excess confirms that differen- tial extinction is negligible. Since the lightcurve parameter errors do not include the model covariance, we conservatively add the SALT2 model error floor of σ(x1) = 0.1 and σ(c) = 0.027 mag (ref. 23) in quadrature to the fit errors. Using the inferred apparent magnitude and the SALT2 parameters above, we find a total magnification of Δm = −3.44 ± 0.14 mag, assuming standard cosmological parameters fromref.24andarestframeB-bandSNIapeakabsolutemagnitudeof −19.4 magfortheaverageSNIalightcurvewidthandcolour,andintrin- sicbrightnessscatterof0.1 mag.Sincetheinferredstellarmassofthe host galaxy is M★ ≲ 1010 M⊙, mass-step corrections for the SN Ia abso- lute magnitude as suggested in ref. 25 are not required. In summary, we find that, including the four images, SN Zwicky is 23.7 ± 3.2 times brighter than the observed flux of normal type Ia supernovae at the sameredshift,afterapplyingcolourandlightcurveshapecorrections. The Keck NIRC2 J-band image was used to obtain a lens model to account for the observed SN image positions, irrespective of their fluxes.Assumingasingularisothermalellipsoid26,27 forthelenspoten- tial, we report an ellipticity ϵe = 0.35 ± 0.01 and θE = 0.1670 ± 0.0006″. 20” A B C D ZTF (g/r) Keck/NIRC2 (J) VLT/MUSE+HAWK-I (g/r/J) 2” Host galaxy SN Zwicky +lens E N Host galaxy nucleus 0.3” Lens galaxy Fig.2|ImageofthefieldofSNZwickyusingpre-explosiong-andr-band imagesfromZTF.Topleft:a2′ × 2′sectionoftheZTFg-andr-bandpre-SN images(FWHM2.3″),centredonthelocationofSNZwicky.Topright:a zoomed-incompositeimageofSNZwickyusingadaptiveoptics(AO)-enhanced VLTMUSE(g/r-band)andHAWK-I(J-band)observationsonSeptember2 and4(FWHM~0.4″).Bottom:a2″ × 2″portionoftheKeck/NIRC2LGSAO J-bandimage(FWHM0.09″),resolvingthefourmultipleimagesofSNZwicky (labelledA,B,C,D).Thebluedashedellipseshowsthecriticallineofthelens, correspondingtotheinferredθE = 0.167″(0.6 kpcatz = 0.2262),enclosingthe lensM = (7.82 ± 0.06) × 109 M⊙.Thehostgalaxynucleusislocated1.4″tothe northeastofthelens,implyingthatSNZwickyexplodedataprojecteddistanceof 7 kpcfromthecentreofitshostgalaxy.
- 4. Nature Astronomy Article https://doi.org/10.1038/s41550-023-01981-3 Themassenclosedwithintheellipsewithsemi-majoraxis0.78 kpcand semi-minor axis 0.51 kpc is M = (7.82 ± 0.06) × 109 M⊙. The lens model predictionsforthetimedelaysareinexcellentagreementwiththefit- tedvaluesfromthelightcurvesinFig.3.Furtherdetailsregardingthe lensmodellingarepresentedinMethods. Interestingly, the individual image magnifications predicted for SN Zwicky by the smooth macro lens model are inconsistent with the observed flux ratios. According to the lensing model, the observed fluxesoftheSNimagesAandCarefactorsof>4and>2toolarge,respec- tively,comparedwithimagesBandD.Giventhesmalltimedelays,this discrepancy cannot be accounted by different phases between the SN images. Other explanations need to be considered: for example, excessmagnificationanddemagnificationfrommilli-andmicrolensing effectsarisingfromstarsandsubstructureinthelensgalaxy28,29 .Since microlensingeffectsarecapableofperturbingmagnificationswithout altering image locations, these were also put forward to explain the observed flux ratios of iPTF16geu30 , displaying differences between the observed and modelled image flux ratios of similar magnitudes. Probing microlensing in these central regions opens a new window to directly measure the central stellar initial mass function31 and test claims that the initial mass function may be heavier in the centres of galaxies32 . As detailed in Methods, the lack of time dependence in the imagefluxratios,oranomalousvariationintheunresolvedlightcurves, givesalowerlimitforthesubstructuremassesof0.02 M⊙,ifthediscrep- ancyfromthesmoothlensmodeliscausedbymicrolensing.Fromthe lackoffurtherimagesplittingofthefourindividualSNimages,weinfer anupperlimitforthesubstructuremassof3 × 107 M⊙. To check the impact of added macro lens model complexity, we have studied cases where the lens mass distribution is modelled with two matter components; one where the surface mass density follows the lens light distribution (with an arbitrary mass-to-light ratio, pos- sibly interpreted as a baryonic mass component), and a second one introducing a dark matter halo with additional flexibility on density profiles. In spite of the added extra complexity, the quality of the fit to the SN image positions does not improve, and induces shifts in the predicted flux ratios only below 5%, that is, very small in comparison withtheobservedfluxratioanomalies. The demonstrated ability to discover multiply imaged super- novae makes it feasible to accomplish Refsdal’s pioneering proposal 33 to use time delays for strongly lensed supernovae to measure the Hubbleconstant.Thiswillrequiresystemswithtimedelaysofseveral days,thatis,longerthanforSNZwicky.Thesmallphysicalscaleofthe lensprobedbySNZwicky,aswellasiPTF16geu8 ,makethesesupernovae uniquetracersforuncoveringapopulationofsystemsthatotherwise wouldremainundetected,asshowninFig.4,probingthemassdistribu- tion of the central, densest, regions of lensing galaxies. Both of these multiply imaged type Ia supernovae were identified without prese- lections on, for example, association with bright galaxies or clusters, emphasizing the importance of untargeted surveys for unexpected discoveries. 18 19 20 21 22 23 Apparent magnitude Days in observer frame since lightcurve peak LT-i ZTF-g LT-z LT-r ZTF-r LT-g SALT2 Unresolved Images A, C, B, D Unlensed 1σ brightness distribution 3.5 mag boost A C B D Absolute magnitude 18 19 20 21 22 23 –20 0 20 40 60 –20 0 20 40 60 –18 –19 –20 –21 –22 –23 –18 –19 –20 –21 –22 –23 Fig.3|MulticolourlightcurveofSNZwickyshowingthatthesupernovais 3.5 magbrighterthananunlensedSNatthesameredshift.Themagnitudes aremeasuredwithrespecttotimeofmaximumlight(modifiedJulianDate 59808.67,correspondingto2022August17)inZTFgandrandLiverpool Telescope(LT)g,r,i,zfilters.ThesolidlinesshowtheSALT220 modelwiththe bestfittothespatiallyunresolveddata.Thebluedashedlinesindicatethe expectedlightcurvesatz = 0.354(withoutlensing),wherethebandsrepresent thes.d.ofthebrightnessdistributionfortypeIasupernovae.Tofittheobserved lightcurves,abrightnessincreasecorrespondingto3.5 magisrequired.Also shown,asdottedlines,arethemodelledindividuallightcurvesforthefourSN imagesA–D.ThefluxratiosweremeasuredfromtheNIRC2datainFig.2.From theselightcurvesweextractthetimedelaysbetweentheimages,allinunits ofdays,ΔtAB = −0.4 ± 2.9,ΔtAC = −0.1 ± 2.3andΔtAD = −0.1 ± 2.7,asdescribedin SupplementaryInformation.Theshadedareasinthelowerpanelsindicatethe regionswithdataoutsidethephaserangewheretheSALT2modelisdefined, andthereforeexcludedfromthelightcurvefitanalysis.Theerrorbars correspondto1 s.d.
- 5. Nature Astronomy Article https://doi.org/10.1038/s41550-023-01981-3 Methods Supernova survey and follow-up The ZTF has been monitoring the transient sky at optical wave- lengths since 20189–11,34 . SN Zwicky16 was discovered under the BTS programme15 . The first detection of the SN was in a ZTF g-band image from 2022 August 1. It was saved to the BTS as an SN candidate by on-duty scanners on August 335 and subsequently assigned to the queueforspectroscopicfollow-upwithSEDMmountedonP60under standard BTS protocols. The SEDM spectrum, obtained on August 2136 ,showsanexcellentmatchtoanormalSNIaataredshiftofz = 0.35 close to maximum light. The redshift and spectral classification were confirmed with a higher-resolution spectrum obtained at the Nordic OpticalTelescopeinLaPalmaonthefollowingnight.WefollowedupSN ZwickywithP48inthegandrbands.Forouranalysisweusetheforced photometryprovidedbytheImageProcessingandAnalysisCenteras detailedinref.34.ObservationsintheSloanDigitalSkySurveyg,r,iand z filters were taken with the IO:O optical imager on the Liverpool Tel- escope37 .TheLiverpoolTelescopephotometricdataareprocessedwith custom data-reduction and image-subtraction software (K. Taggart et al., manuscript in preparation). Image subtraction is performed using the Panoramic Survey Telescope and Rapid Response System 1 (Pan-STARRS1) reference image. Images were stacked using SWarp to combine multiple exposures where required. The photometry is measured using a PSF fitting methodology relative to Pan-STARRS1 standardsandisbasedontechniquesinref.38. Lightcurvefit,magnificationandtime-delayinference We used the publicly available, Python-based software SNTD39 for inferring the restframe B-peak magnitude, the lightcurve shape and colour SN Ia SALT2 parameters23 and the time delays between the SN images. Data points with ≥3σ detections from the g and r filters from P48andtheg,r,i,zfiltersfromtheLiverpoolTelescopewereincluded inthefit.Weadoptedaniterativeprocedureintwosteps.First,allthe data were used. Next, only data points in the range where the SALT2 model is defined, that is, −20 to +50 d, were kept for the second itera- tion.Thefinallightcurvefitparameterswerederivedfromdatainthis phaserange. We estimated the time delays, that is, the relative phase between the SN images, by fitting the unresolved ground-based flux data with themodelthatincludesthefluxcontributionsfromthefoursetsofSN lightcurves,Fj (t, λ),eachonewithitsowntimeofB-bandmaximum, t j 0 . The fit is constrained by imposing a prior on the image ratios at the dateoftheKeck/NIRC2observations,reportedinSupplementaryTable 3. We allow the lightcurve fit parameters to vary within the ranges x1 = [−3.0, 3.0], c = [−0.3, 0.3], but assume them to be the same for all fourimages.Thisisanexcellentapproximationintheabsenceofappre- ciable differential reddening in the lensing galaxy, confirmed by the resultofthefit,c = −0.01 ± 0.01,consistentwithnocolourexcess. Galactic extinction was included in the model, adopting E(B − V)MW = 0.1558 mag, based on the extinction maps in ref. 40. We used the wavelength dependence from the dust from ref. 22 and the measured mean value of the total to the Galactic selection extinction ratio, RV = 3.1. From the location of the fitted restframe B-band peak luminosity in the SALT2 model for the summed fluxes we inferred the timeofmaximumforSNZwicky,t0 = 59808.67 ± 0.19,correspondingto 2022August17.Thetotallensingmagnification,μ = 24.3 ± 2.7,wascal- culatedafterstandardizingtheSNIafittedB-bandpeakmagnitudewith thestandardSALT2lightcurveshapeandcolourcorrectionparameters, (α, β) = (0.14, 3.1).ThroughouttheanalysisofSNZwicky,weadopteda flatΛcolddarkmattercosmologicalmodelwithH0 = 67.4 km s−1 Mpc−1 andΩM = 0.315(ref.24). Theuncertaintieswereportforthetimedelaysaccountforparam- eterdegeneraciesinthefit.Cornerplotswithposteriorsfortherelative time delays of B, C and D with respect to A are illustrated in Supple- mentaryFig.1.Theunresolveddatausedforthisanalysisareavailable via WISeREP at https://www.wiserep.org/object/21343. It should be emphasized that the lightcurve and time-delay fits were carried out completelyindependentlyfromthelensmodelling. Spectroscopicfollow-up The first classification spectrum of SN Zwicky was obtained with the integral field unit on the SEDM on 2022 August 21. The data were reduced using a custom integral field unit pipeline developed for the instrument41,42 . Flux calibration and correction of telluric bands were carriedoutusingastandardstartakenatasimilarairmass.Thedetails ofallspectroscopicobservationsarelistedinSupplementaryTable1. Weobtainedthreeepochsofspectroscopybetween2022August 21 and September 11 with ALFOSC on the 2.56 m Nordic Optical Tel- escope at the Observatorio del Roque de los Muchachos in La Palma (Spain) (see http://www.not.iac.es/instruments/alfosc for further information).Observationsweretakenusinggrism4,providingwave- length coverage over most of the optical spectral range (typically 3,700–9,600 Å). Reduction and calibration were performed using PypeItversion1.8.143,44 . Weobtainedthreeepochsofspectroscopybetween2022August 22andOctober19withLRISontheKeckI10 mtelescope45 .Allspectra werereducedandextractedwithLPipe46 . Adaptiveopticsobservations ObservationswiththeVLT.HAWK-Iobservationsanddatareduction. We obtained seven epochs of near infrared in YJHK between 2022 August 23 and September 30 with HAWK-I47–49 at the ESO VLT at the ParanalObservatory(Chile).Allobservations,exceptofthefirstepoch, were performed with the ground-layer adaptive optics offered by the GALACSImodule50–52 toimprovetheimagequality.Thefirstthreewere observed in YJH filters and the next four in YJHKs filters. For the first three epochs we exposed for 3 × 60 s in the Y and J bands and 6 × 60 s in the H band. For the fourth epoch we also observe for 10 × 60 s in the Ks band. To account for the brightness evolution, we exposed for 12.0 11.5 11.0 10.5 10.0 0 0.5 1.0 θE (″) log M * /M ☼ Lensed quasars BELLS lens galaxies SLACS lens galaxies SL2S lens galaxies 1.5 iPTF16geu SN Zwicky PS1-10afx 2.0 2.5 Fig.4|StellarmassversusEinsteinradiusforlensgalaxiesdiscovered ingalaxysurveys,demonstratingthatSNZwicky,iPTF16geuandthe unresolvedlensedsupernovaPS1-10afxpointtoapoorlyknownpopulation ofsmall-image-separationlensingsystems.Stronglylensedgalaxysystems arerepresentedbyyellowdiamondsfortheBOSSEmission-LineLensSurvey (BELLS)sample70 ,bluetrianglesforSloanLensACS(SLACS)lenses71 andpurple squaresforSL2Slenses72 .Thegreencirclescorrespondtolensedquasars73 ,of whichthefilledcircleshavebeendetectedopticallyandtheopencirclesthrough radioemission.Theshadedgreycontoursshowthe90%and68%confidence levelsforthefullsampleof155lensedgalaxiesand45lensedquasars.Thelensed supernovadataarepresentedasmedianvalues ± 1 s.d.Fortheunresolvedlensed supernovaPS1-10afx,onlyanupperlimitoftheEinsteinradiusisavailable7 .The stellarmassderivationforSNZwickyisdetailedinMethods.
- 6. Nature Astronomy Article https://doi.org/10.1038/s41550-023-01981-3 10 × 100 s and 6 × 60 s for epochs 5 and 6. For the final epoch we also increasedH-bandexposuretimesto10 × 60 s.FortheHAWK-Iobserva- tionsweusedoffsetsof(−115″, 115″)toplacethetargetontheoptimal detectorchip. The data used in our work have been reduced using the HAWK-I pipeline version 2.4.11 and the Reflex environment53 . The data reduc- tionincludedsubtractingbiasandflatfielding.Theworldcoordinate systemwascalibratedagainststarsfromGaia. MUSE observations and data reduction. We obtained four epochs of integral-field spectroscopy between 2022 August 24 and Septem- ber 30 with MUSE54 at the ESO VLT. Each pointing has an approxi- mately 1′ × 1′ field of view with spatial sampling of 0.2″per pixel and covers the wavelength range from 4,700 to 9,300 Å with a spectral resolution of 1,800–3,600. All observations were performed with the ground-layer adaptive optics offered by the GALACSI module50,52 to improve the image quality. The integration time of each epoch was1,800 s. ThedatausedinourworkhavebeenreducedusingtheMUSEpipe- line version 2.8.755 and the Reflex environment53 . The data reduction includedsubtractingbias,flatfielding,wavelengthcalibrationandflux calibration against spectrophotometric standard stars. Afterwards, weimprovedtheskysubtractionwiththeZurichAtmospherePurge56 module in the ESO MUSE pipeline. The world coordinate system was calibratedagainststarsfromGaia. Laser guide star adaptive optics imaging from Keck. The NIRC2 J-bandobservationsconsistofnineimagesinafive-pointditherpattern basedona2″ × 2″gridsize,tofacilitateskybackgroundsubtraction.At the first dither location we obtained two images: one co-added 600 s exposureandone200 sexposure.Atthesecondlocationweobtained one 200 s exposure. At each of the third, fourth and fifth dither loca- tions,weobtainedtwo200 sexposures.Tocorrectforflatfieldingand biasweacquiredasetoftenbiasframes(flatlampoff)andtendomeflat frames(flatlampon).Skybackgroundanddarkcurrentwereremoved as part of the sky subtraction, which utilized a different sky map for eachditherposition,createdbymediancombiningtheframesfromall otherditherpositions,excludingthecurrentditherposition.Thefinal combinedimagewascreatedbyaligningeachditherpositiontoeachof theothersusingthecentroidofthebrightestSNimage(imageA),and mediancombining.ThereductionwascarriedoutusingcustomPython scripts.TheNIRC2J-banddata(Fig.2)providesthehighest-resolution (FWHM 0.086″) image in our dataset of the system where the four SN imagesarevisible. Modellingofthelensgalaxy The Keck NIRC2 J-band image was used to model the lens galaxy in terms of its θE, semi-minor to semi-major axis ratio q (or ϵe = 1 − q) and orientationangleϕ.Themassprofileusedinouranalysisisasingular isothermalellipsoid26,27 : κ(x, y) = θE 2√qx2 + y2/q , (1) where κ corresponds to the convergence (that is the dimensionless projectedsurfacemassdensity)andthecoordinates(x, y)arecentred on the position of the lens centre and rotated anticlockwise by ϕ. The projectedmassMinsideanisodensitycontourofthesingularisother- malellipsoidisgivenby27 M = c2 4G DsDl Dls θ2 E . (2) TocalculateDl,Ds andDls,weassumedaflatΛcolddarkmattercosmol- ogywithH0 = 67.4 km s−1 Mpc−1 andΩM = 0.315(ref.24). In addition to the lens mass model, we included light models for the lens galaxy and SN host galaxy in the form of elliptical Sérsic profiles: I(R) = Ie exp {−bn [( R Re ) 1/n − 1]} , (3) whereIe istheintensityatthehalf-lightradiusRe,bn = 1.9992n − 0.3271 (ref.57)and R ≡ √x2 + y2/q2 S , (4) withqS theaxisratiooftheSérsicprofile.TheSNimagesweremodelled aspointsources.WeusedaMoffatPSFwithpowerindex2.94andFWHM 0.091″ to model the full image. We simultaneously reconstructed the lens mass model, SN images and surface brightness distributions of the lens and host galaxy. The lens mass model is constrained only by thepositionsofthelensedSNimagesandnotbytheirfluxes,sincethe lattermaybeconsiderablyaffectedbysubstructures,suchasstars,in the lensing galaxy. Our model contains 13 nonlinear free parameters: θE, ϕ, q, x, y for the lens mass model, Re, n, ϕS, qS, xS, yS for the lens light modelandxSN,ySN fortheSNpositioninthesourceplane.Ourresultsare obtainedusinglenstronomy(https://lenstronomy.readthedocs.io/en/ latest/),anopen-sourcePythonpackagethatusesforwardmodelling to reconstruct strong gravitational lenses57 . The result of the fit and comparison with the observations is shown in Supplementary Fig. 2. Asacross-check,wealsomodelledtheHSTphotometrydataandredid theanalysiswithLENSMODEL58,59 ,whichproducedconsistentresults. Theresultingbest-fitvaluesforthelensmassandlightprofilesare summarized in Supplementary Table 2. Additionally, we derived the gravitational mass within the isodensity contour given by the critical lineofthelens(withradiusθE = 0.167″,correspondingto0.628 kpc)to be M = (7.82 ± 0.06) × 109 M⊙. Supplementary Table 3 displays the observed time delays and individual fractional flux contributions from each SN image as detailed in Lightcurve fit, magnification and time-delay inference (tobs and fobs), compared with the predictions from the lens model (tmod andfmod).Here,timedelaysaregivenwithrespecttoimageA:for example, ti ≡ ti − tA. The observed fractional flux ratios are measured fromtheKeckJ-bandimageaftersubtractingthelensgalaxylight,and the model predictions, fmod, are computed from the magnifications predictedbythelensmodel,fi ≡ μi/∑jμj.Inadditiontotheuncertainties obtainedfromtheJ-bandimageanalysis,wemakeaconservativeerror estimate by also including the scatter in fobs and fmod obtained when modelling the system using data from the HST optical filters F475W, F625WandF814W,aswellastheKecknear-infraredJ-banddata.Using this approach, we also take into account possible error contributions fromuncertaintiesindustextinction,lensgalaxysubtractionandlens massmodelling. The observed individual image magnifications can be obtained from fobs by multiplying the individual fractional fluxes by the total observed SN magnification of μtot obs = 24.3 ± 2.7. The total lens model imagemagnification, μtot mod ,issensitivetothelensmassslope(whichis unconstrained by the imaging data), such that flatter halos predicts a largermagnification.Foranisothermallens, μtot mod = 14.9 ± 0.9,indicat- ing a flatter halo profile (see also ref. 8). However, the predicted flux ratios remain approximately constant, which means that to first approximationwecanmultiplythederivedfmod byanarbitrary μtot mod .In contrasttothepredictedindividualfractionalfluxcontributions,the observedfluxisdominatedbyimagesAandC.Tomatchtheobserved values,substructurelensingisneededtoadditionallymagnifyimages A and C with factors of >4 and >2, respectively, compared with any additionalsubstructure(de)magnificationsofimagesBandD. To check the impact of added macro lens model complexity, we have studied cases where the lens mass distribution is modelled with
- 7. Nature Astronomy Article https://doi.org/10.1038/s41550-023-01981-3 two matter components: one where the surface mass density follows the lens light distribution (with an arbitrary mass-to-light ratio, pos- sibly interpreted as a baryonic mass component), and a second one introducing a dark matter halo with additional flexibility on density profiles. In spite of the added extra complexity, the quality of the fit to the SN image positions does not improve, and induces shifts in the predicted flux ratios only below 5%, that is, very small in comparison withtheobservedfluxratioanomalies. Wedonotdetectanytimedependenceinthefluxratiosbetween the Keck and HST images, observed just a month after the lightcurve peak, 6 d apart, or any other anomalous variation in the unresolved ~80-d-long lightcurve shown in Fig. 3. Comparing the expected size of SN photosphere with the Einstein radii of compact objects in the lensing galaxy, we infer that if the discrepancy from the smooth lens modeliscausedbymicrolensingthedeflectorsmustexceed0.02 M⊙. Withtheaimofdistinguishingbetweenlensingeffectsbystarsor largersubstructures,weinvestigatedtheupperlimitofimagesplitting for the brightest image, A. We approximated the maximum Einstein radius of a large structure at the position of image A by putting an upper limit on the difference in the FWHM between PSFA and PSFBCD. Using equation (2), we inferred a 95% confidence upper limit on the substructure’smasswithinitsEinsteinradius.Combinedwiththelower masslimitderivedfromthelackoffluxratiovariability,thisconstrains themassofthesubstructuredeflectorinthelineofsighttoimageAto 0.02 < M/M⊙ < 3 × 10⁷ . Weconcludethat,similarlytothecaseofiPTF16geu,asmoothlens densityfailstoexplaintheindividualimagemagnitudesandadditional substructurelensingisneeded.Sincetheobservedpropertiesoflens systems to first order depend only on the integrated mass within the images and/or the surface mass density of the lens at the image posi- tionsorintheannulusbetweentheimages60 ,small-image-separation systemsprovideauniqueprobeofthecentralregionsofgravitational lensinggalaxies.Theprobabilityforlenssubstructures,suchasstars, to accommodate the needed (de)magnifications for a range of lens densityslopeswillbeinvestigatedinafuturelensmodellingpaper. Lensgalaxyphotometry We retrieved science-ready co-added images from Pan-STARRS DR161 . Using a circular aperture with a radius of 1.1″, we obtain the following apparent magnitudes of the lens galaxy: g = 22.09 ± 0.09, r = 20.71 ± 0.02,i = 20.14 ± 0.02,z = 19.84 ± 0.02andy = 19.63 ± 0.05(all errorsareofstatisticalnature).Wemodelthespectralenergydistribu- tionwiththesoftwarepackageProspectorversion1.162 .Prospectoruses theFlexibleStellarPopulationSynthesis(FSPS)code63 togeneratethe underlying physical model and Python-FSPS64 to interface with FSPS inPython.TheFSPScodealsoaccountsforthecontributionfromthe diffusegas(forexample,Hiiregions)basedontheCloudymodelsfrom ref. 65. Furthermore, we assumed a Chabrier initial mass function66 and approximated the star-formation history by a linearly increasing star-formationhistoryatearlytimesfollowedbyanexponentialdecline at late times (functional form t exp(−t/τ)). The model was attenuated withtheref.67model. The best-fit galaxy model points to a moderately massive galaxy withstellarmasslog M★/M☉ = 10.1 ± 0.3.Theotherparameters,suchas star-formation rate, attenuation and age are poorly constrained and wereporttheirvaluesonlyforthesakeofcompleteness:star-formation rate = 15+21 −15 M⊙ yr−1 , E(B − V)star = 0.6+0.1 −0.4 mag, age = 1.6+5.4 −1.2 Gyr . We acknowledge that the aperture might not encircle the entire galaxy and, therefore, we might underestimate the stellar mass of the lens. Changingtheradiusofthemeasurementapertureto4″increasesthe massby~0.3 dex.Thislargeaperturealsoincludesthecontributionof the SN host galaxy and therefore overestimates the stellar mass of the lens galaxy. Nonetheless, this upper bound does not alter our conclusionaboutthecompactnatureofthelensinggalaxy,relativeto otherlensingsystems. Hostgalaxyphotometry Numerous studies have shown that the peak absolute magnitudes of typeIasupernovaedependontheirhostgalaxymasses(see,forexam- ple, ref. 25). Although the host and the lens galaxy are well separated intheHSTimages,bothgalaxieshavediffuseemissionextendingwell beyondtheseparationofthetwogalaxies.Tofirstorder,wecanremove the contribution of the lens by subtracting the lens images predicted bylenstronomyfromtheHSTimages.Usingacircularaperturewitha 1″ radius and appropriate zero points from HST, we measure for the host 22.31 ± 0.11, 21.81 ± 0.06 and 21.13 ± 0.06 mag in F475W, F625W andF814W,respectively.Fittingthespectralenergydistributionwith Prospectorwiththesameassumptionsasintheprevioussectiongives a galaxy stellar mass of log M⋆/M⊙ = 9.6+0.4 −0.3 . A closer inspection of the subtracted HST images reveals that the 1″ aperture does not encircle the total emission of the host. Increasing the aperture radius to 1.5″ encircles almost the entire host galaxy (F475W = 21.80 ± 0.09, F652W = 21.38 ± 0.04, F814W = 20.74 ± 0.03), but it also includes non-negligible contribution from residuals of the lens galaxy. The galaxymassincreasesmarginallyto log M/M⊙ = 9.7+0.5 −0.4 butisconsistent with the previous measurement. This suggests that a mass-step cor- rectionisnotrequired.Toobtainamorerobustestimateofthegalaxy mass,near-infraredobservationsaftertheSNhasfadedarerequired. Dataavailability The reduced spectra and lightcurves used in the paper are avail- able through the WISeREP repository68 at https://www.wiserep.org/ object/21343.TherawVLTdataarealsoavailablefromtheESOScience Archive Facility, http://archive.eso.org/eso/eso_archive_main.html, programID:109.234A. Codeavailability The data were analysed using the public codes SNTD (https://sntd. readthedocs.io/en/latest/) and lenstronomy (https://lenstronomy. readthedocs.io/en/latest/). The Keck AO J-band images and analy- sis software can be requested from the first author. The Liverpool image reduction software will be made available upon publication by K-Taggartetal. References 1. Einstein, A. Lens-like action of a star by the deviation of light in the gravitational field. Science 84, 506–507 (1936). 2. Zwicky, F. On the probability of detecting nebulae which act as gravitational lenses. Phys. Rev. 51, 679–679 (1937). 3. Oguri, M. Strong gravitational lensing of explosive transients. Rep. Prog. Phys. 82, 126901 (2019). 4. Liao, K., Biesiada, M. & Zhu, Z.-H. Strongly lensed transient sources: a review. Chin. Phys. Lett. 39, 119801 (2022). 5. Suyu, S. H., Goobar, A., Collett, T., More, A. & Vernardos, G. Strong gravitational lensing and microlensing of supernovae. Preprint at https://arxiv.org/abs/2301.07729 (2023). 6. Quimby, R. M. et al. Extraordinary magnification of the ordinary type Ia supernova PS1-10afx. Astrophys. J. Lett. 768, L20 (2013). 7. Quimby, R. M. et al. Detection of the gravitational lens magnifying a type Ia supernova. Science 344, 396–399 (2014). 8. Goobar, A. et al. iPTF16geu: a multiply imaged, gravitationally lensed type Ia supernova. Science 356, 291–295 (2017). 9. Dekany, R. et al. The Zwicky Transient Facility: observing system. Publ. Astron. Soc. Pac. 132, 038001 (2020). 10. Bellm, E. C. et al. The Zwicky Transient Facility: system overview, performance, and first results. Publ. Astron. Soc. Pac. 131, 018002 (2019). 11. Graham, M. J. et al. The Zwicky Transient Facility: science objectives. Publ. Astron. Soc. Pac. 131, 078001 (2019). 12. Bellm, E. C. et al. The Zwicky Transient Facility: surveys and scheduler. Publ. Astron. Soc. Pac. 131, 068003 (2019).
- 8. Nature Astronomy Article https://doi.org/10.1038/s41550-023-01981-3 13. Goobar, A. & Leibundgut, B. Supernova cosmology: legacy and future. Annu. Rev. Nucl. Part. Sci. 61, 251–279 (2011). 14. Blagorodnova, N. et al. The SED Machine: a robotic spectrograph for fast transient classification. Publ. Astron. Soc. Pac. 130, 035003 (2018). 15. Fremling, C. et al. The Zwicky Transient Facility Bright Transient Survey. I. Spectroscopic classification and the redshift completeness of local galaxy catalogs. Astrophys. J. 895, 32 (2020). 16. Goobar, A. et al. SN Zwicky (SN2022qmx): a strongly lensed type Ia at z=0.35 discovered by ZTF. Transient Name Server AstroNote 180 (2022). 17. Fremling, C., Meynardie, W., Yan, L., Salama, M. & Jensen-Clem. Keck NIRC2+LGS imaging observations of SN 2022qmx (‘SN Zwicky’). Transient Name Server AstroNote 194 (2022). 18. Pierel, J. et al. Multiple images of SN 2022qmx (‘SN Zwicky’) resolved in HST observations. Transient Name Server AstroNote 196 (2022). 19. Pierel, J. D. R. et al. LensWatch: I. Resolved HST observations and constraints on the strongly lensed type Ia supernova 2022qmx (‘SN Zwicky’). Astrophys. J. 948, 115 (2023). 20. Guy, J. et al. SALT2: using distant supernovae to improve the use of type Ia supernovae as distance indicators. Astron. Astrophys. 466, 11–21 (2007). 21. Hsiao, E. Y. et al. K-corrections and spectral templates of type Ia supernovae. Astrophys. J. 663, 1187–1200 (2007). 22. Cardelli, J. A., Clayton, G. C. & Mathis, J. S. The relationship between infrared, optical, and ultraviolet extinction. Astrophys. J. 345, 245–256 (1989). 23. Guy, J. et al. The Supernova Legacy Survey 3-year sample: type Ia supernovae photometric distances and cosmological constraints. Astron. Astrophys. 523, A7 (2010). 24. Planck Collaboration et al. Planck 2018 results. VI. Cosmological parameters. Astron. Astrophys. 641, A6 (2020). 25. Sullivan, M. et al. The dependence of type Ia supernovae luminosities on their host galaxies. Mon. Not. R. Astron. Soc. 406, 782–802 (2010). 26. Kassiola, A. & Kovner, I. Analytic lenses with elliptic mass distributions, pseudo-isothermal and others, instead of elliptic potentials. In Proc. 31st Liege International Astrophysical Colloquium (LIAC93) (eds Surdej, J. et al.) 571 (Universite de Liege, Institut d'Astrophysique, 1993). 27. Kormann, R., Schneider, P. & Bartelmann, M. Isothermal elliptical gravitational lens models. Astron. Astrophys. 284, 285–299 (1994). 28. Kayser, R. & Refsdal, S. Detectability of gravitational microlensing in the quasar QSO2237 + 0305. Nature 338, 745–746 (1989). 29. Witt, H. J. & Mao, S. Interpretation of microlensing events in Q2237 + 0305. Astrophys. J. 429, 66–76 (1994). 30. Diego, J. M. et al. Microlensing and the type Ia supernova iPTF16geu. Astron. Astrophys. 662, A34 (2022). 31. Foxley-Marrable, M., Collett, T. E., Vernardos, G., Goldstein, D. A. & Bacon, D. The impact of microlensing on the standardization of strongly lensed type Ia supernovae. Mon. Not. R. Astron. Soc. 478, 5081–5090 (2018). 32. van Dokkum, P., Conroy, C., Villaume, A., Brodie, J. & Romanowsky, A. J. The stellar initial mass function in early-type galaxies from absorption line spectroscopy. III. Radial gradients. Astrophys. J. 841, 68 (2017). 33. Refsdal, S. On the possibility of determining Hubble’s parameter and the masses of galaxies from the gravitational lens effect. Mon. Not. R. Astron. Soc. 128, 307–310 (1964). 34. Masci, F. J. et al. The Zwicky Transient Facility: data processing, products, and archive. Publ. Astron. Soc. Pac. 131, 018003 (2019). 35. Fremling, C. ZTF Transient Discovery Report for 2022-08-03. Transient Name Server Discovery Report 2022-2198 (2022). 36. Sollerman, J. et al. ZTF Transient Classification Report for 2022- 08-25. Transient Name Server Classification Report 2022-2465 (2022). 37. Steele, I. A. et al. The Liverpool Telescope: performance and first results. Proc. SPIE 5489, 679–692 (2004). 38. Fremling, C. et al. PTF12os and iPTF13bvn. Two stripped-envelope supernovae from low-mass progenitors in NGC 5806. Astron. Astrophys. 593, A68 (2016). 39. Pierel, J. R. & Rodney, S. A. SNTD: supernova time delays. Astrophysics Source Code Library ascl:1902.001 (2019). 40. Schlafly, E. F. & Finkbeiner, D. P. Measuring reddening with Sloan Digital Sky Survey stellar spectra and recalibrating SFD. Astrophys. J. 737, 103 (2011). 41. Rigault, M. et al. Fully automated integral field spectrograph pipeline for the SEDMachine: pysedm. Astron. Astrophys. 627, A115 (2019). 42. Kim, Y. L. et al. New modules for the SEDMachine to remove contaminations from cosmic rays and non-target light: BYECR and CONTSEP. Publ. Astron. Soc. Pac. 134, 024505 (2022). 43. Prochaska, J. et al. PypeIt: the Python spectroscopic data reduction pipeline. J. Open Source Softw. 5, 2308 (2020). 44. Prochaska, J. X. et al. pypeit/PypeIt: release 1.0.0 version 1.8.1 (2020). 45. Oke, J. B. et al. The Keck Low-Resolution Imaging Spectrometer. Publ. Astron. Soc. Pac. 107, 375 (1995). 46. Perley, D. Fully automated reduction of longslit spectroscopy with the Low Resolution Imaging Spectrometer at the Keck Observatory. Publ. Astron. Soc. Pac. 131, 084503 (2019). 47. Pirard, J.-F. et al. HAWK-I: a new wide-field 1- to 2.5-μm imager for the VLT. Proc. SPIE 5492, 1763–1772 (2004). 48. Casali, M. et al. HAWK-I: the new wide-field IR imager for the VLT. Proc. SPIE 6269, 62690W (2006). 49. Kissler-Patig, M. et al. HAWK-I: the high-acuity wide-field K-band imager for the ESO Very Large Telescope. Astron. Astrophys. 491, 941–950 (2008). 50. Arsenault, R. et al. ESO adaptive optics facility. Proc. SPIE 7015, 701524 (2008). 51. Paufique, J. et al. GRAAL: a seeing enhancer for the NIR wide-field imager Hawk-I. Proc. SPIE 7736, 77361P (2010). 52. Ströbele, S. et al. GALACSI system design and analysis. Proc. SPIE 8447, 844737 (2012). 53. Freudling, W. et al. Automated data reduction workflows for astronomy. The ESO Reflex environment. Astron. Astrophys. 559, A96 (2013). 54. Bacon, R. et al. The MUSE second-generation VLT instrument. Proc. SPIE 7735, 773508 (2010). 55. Weilbacher, P. M. et al. The MUSE data reduction pipeline: status after Preliminary Acceptance Europe. In Astronomical Data Analysis Software and Systems XXIII Conference Series Vol. 485 (eds Manset, N. & Forshay, P.) 451 (Astronomical Society of the Pacific, 2014). 56. Soto, K. T., Lilly, S. J., Bacon, R., Richard, J. & Conseil, S. ZAP: Zurich Atmosphere Purge. Astrophysics Source Code Library ascl:1602.003 (2016). 57. Birrer, S. & Amara, A. lenstronomy: multi-purpose gravitational lens modelling software package. Phys. Dark Universe 22, 189–201 (2018). 58. Keeton, C. R. Computational methods for gravitational lensing. Preprint at https://arxiv.org/abs/astro-ph/0102340 (2001). 59. Keeton, C. R. A catalog of mass models for gravitational lensing. Preprint at https://arxiv.org/abs/astro-ph/0102341 (2001). 60. Kochanek, C. S. in Gravitational Lensing: Strong, Weak & Micro Saas-Fee Advanced Course 33 (eds Meylan, G. et al.) 91–268 (Springer, 2006).
- 9. Nature Astronomy Article https://doi.org/10.1038/s41550-023-01981-3 61. Chambers, K. C. et al. The Pan-STARRS1 surveys. Preprint at https://arxiv.org/abs/1612.05560 (2016). 62. Johnson, B. D., Leja, J., Conroy, C. & Speagle, J. S. Stellar population inference with Prospector. Astrophys. J. 254, 22 (2021). 63. Conroy, C., Gunn, J. E. & White, M. The propagation of uncertainties in stellar population synthesis modeling. I. The relevance of uncertain aspects of stellar evolution and the initial mass function to the derived physical properties of galaxies. Astrophys. J. 699, 486–506 (2009). 64. Foreman-Mackey, D., Sick, J. & Johnson, B. Python-FSPS: Python bindings to FSPS (V0.1.1). Zenodo, https://doi.org/10.5281/ zenodo.12157 (2014) 65. Byler, N., Dalcanton, J. J., Conroy, C. & Johnson, B. D. Nebular continuum and line emission in stellar population synthesis models. Astrophys. J. 840, 44 (2017). 66. Chabrier, G. Galactic stellar and substellar initial mass function. Publ. Astron. Soc. Pac. 115, 763 (2003). 67. Calzetti, D. et al. The dust content and opacity of actively star-forming galaxies. Astrophys. J. 533, 682–695 (2000). 68. Yaron, O. & Gal-Yam, A. WISeREP—an interactive supernova data repository. Publ. Astron. Soc. Pac. 124, 668 (2012). 69. Amanullah, R. et al. Diversity in extinction laws of type Ia supernovae measured between 0.2 and 2μm. Mon. Not. R. Astron. Soc. 453, 3300–3328 (2015). 70. Brownstein, J. R. et al. The BOSS Emission-Line Lens Survey (BELLS). I. A large spectroscopically selected sample of lens galaxies at redshift ~0.5. Astrophys. J. 744, 41 (2012). 71. Auger, M. W. et al. The Sloan Lens ACS Survey. IX. Colors, lensing, and stellar masses of early-type galaxies. Astrophys. J. 705, 1099–1115 (2009). 72. Sonnenfeld, A., Gavazzi, R., Suyu, S. H., Treu, T. & Marshall, P. J. The SL2S galaxy-scale lens sample. III. Lens models, surface photometry, and stellar masses for the final sample. Astrophys. J. 777, 97 (2013). 73. Oguri, M., Rusu, C. E. & Falco, E. E. The stellar and dark matter distributions in elliptical galaxies from the ensemble of strong gravitational lenses. Mon. Not. R. Astron. Soc. 439, 2494–2504 (2014). Acknowledgements This work is based on observations obtained with the 48in. Samuel Oschin Telescope and the 60in. telescope at the Palomar Observatory as part of the ZTF project. ZTF is supported by the National Science Foundation under grant AST-2034437 and a collaboration including Caltech, IPAC, the Weizmann Institute of Science, the Oskar Klein Center at Stockholm University, the University of Maryland, Deutsches Elektronen-Synchrotron and Humboldt University, the TANGO Consortium of Taiwan, the University of Wisconsin at Milwaukee, Trinity College Dublin, Lawrence Livermore National Laboratories, IN2P3, the University of Warwick, Ruhr University Bochum and Northwestern University. Operations are conducted by COO, IPAC and UW. SEDM is based upon work supported by the National Science Foundation under grant 1106171. This work has been supported by the research project grant ‘Understanding the Dynamic Universe’ funded by the Knut and Alice Wallenberg Foundation under Dnr KAW 2018.0067, and the G.R.E.A.T. research environment, funded by Vetenskapsrådet, the Swedish Research Council, project 2016-06012. M.R. acknowledges support from the European Research Council (ERC) under the European Union’s Horizon 2020 research and innovation programme (grant agreement 759194—USNAC). A.G. acknowledges support from the Swedish Research Council under contract 2020-03444. E.M. acknowledges support from the Swedish Research Council under contract 2020-03384. T.E.C. is funded by a Royal Society University Research Fellowship and the European Research Council (ERC) under the European Union’s Horizon 2020 research and innovation programme (LensEra: grant agreement 945536). This work is also based on observations collected at the European Organisation for Astronomical Research in the Southern Hemisphere under ESO programmes 109.234A.001 and 109.24FN, and on observations made with the Nordic Optical Telescope, owned in collaboration by the University of Turku and Aarhus University, and operated jointly by Aarhus University, the University of Turku and the University of Oslo, representing Denmark, Finland and Norway, the University of Iceland and Stockholm University at the Observatorio del Roque de los Muchachos, La Palma, Spain, of the Instituto de Astrofísica de Canarias. Some of the data presented here were obtained in part with ALFOSC, which is provided by the Instituto de Astrofísica de Andalucía (IAA) under a joint agreement with the University of Copenhagen and the Nordic Optical Telescope. Some were obtained at the W. M. Keck Observatory, which is operated as a scientific partnership among the California Institute of Technology, the University of California and the National Aeronautics and Space Administration. The observatory was made possible by the generous financial support of the W. M. Keck Foundation. The Liverpool Telescope is operated on the island of La Palma by Liverpool John Moores University in the Spanish Observatorio del Roque de los Muchachos of the Instituto de Astrofísica de Canarias with financial support from the UK Science and Technology Facilities Council. This paper is also based in part on observations with the NASA/ESA HST obtained from the Mikulski Archive for Space Telescopes at STScI; support was provided to J.P. through programme HST-GO-16264. Authorcontributions A.G., project lead, telescope proposals, main manuscript editor; J.J., S.S., N.A., A.S.C., S.D., E.M., data analysis, proposal contribution, figures, manuscript text; C.F., L.Y., W.M., Keck AO imaging; D.P., K.-R.H., Liverpool Telescope observations; J.S., Nordic Optical Telescope observations; R.J., I.A., data analysis; T.E.C., C.L., manuscript contribution; E.B., J.B., A.D., M.G., M.K., S.R.K., A.A.M., J.D.N., J.N., R.R., M.R., B.R., G.S., A.T., A.W., ZTF observations; Y.S., R.S., Keck spectroscopy; Y.V., J.C.W., follow-up observations; J.P., HST observations. J.R., Very Large Telescope observations. Funding Open access funding provided by Stockholm University. Competinginterests The authors declare no competing interests. Additionalinformation Supplementary information The online version contains supplementary material available at https://doi.org/10.1038/s41550-023-01981-3. Correspondence and requests for materialsshould be addressed to Ariel Goobar. Peer review information Nature Astronomy thanks Masamune Oguri and the other, anonymous, reviewer(s) for their contribution to the peer review of this work. Reprints and permissions informationis available at www.nature.com/reprints. Publisher’s note Springer Nature remains neutral with regard to jurisdictional claims in published maps and institutional affiliations. Open Access This article is licensed under a Creative Commons Attribution 4.0 International License, which permits use, sharing, adaptation, distribution and reproduction in any medium or format,
- 10. Nature Astronomy Article https://doi.org/10.1038/s41550-023-01981-3 as long as you give appropriate credit to the original author(s) and the source, provide a link to the Creative Commons license, and indicate if changes were made. The images or other third party material in this article are included in the article’s Creative Commons license, unless indicated otherwise in a credit line to the material. If material is not included in the article’s Creative Commons license and your intended use is not permitted by statutory regulation or exceeds the permitted use, you will need to obtain permission directly from the copyright holder. To view a copy of this license, visit http://creativecommons. org/licenses/by/4.0/. © The Author(s) 2023 1 The Oskar Klein Centre, Department of Physics, Stockholm University, AlbaNova University Center, Stockholm, Sweden. 2 Institute of Astronomy and Kavli Institute for Cosmology, University of Cambridge, Cambridge, UK. 3 Cahill Center for Astrophysics, California Institute of Technology, Pasadena, CA, USA. 4 Astrophysics Research Institute, Liverpool John Moores University, Liverpool, UK. 5 The Oskar Klein Centre, Department of Astronomy, Stockholm University, AlbaNova University Center, Stockholm, Sweden. 6 Joint Space-Science Institute, University of Maryland, College Park, MD, USA. 7 Department of Astronomy, University of Maryland, College Park, MD, USA. 8 Astrophysics Science Division, NASA Goddard Space Flight Center, Greenbelt, MD, USA. 9 DIRAC Institute, Department of Astronomy, University of Washington, Seattle, WA, USA. 10 Department of Astronomy, University of California, Berkeley, CA, USA. 11 Institute of Cosmology and Gravitation, University of Portsmouth, Portsmouth, UK. 12 Institute of Physics, Laboratoire d’Astrophysique, Ecole Polytechnique Fédérale de Lausanne (EPFL), Observatoire de Sauverny, Versoix, CH, Switzerland. 13 Department of Physics and Astronomy, Northwestern University, Evanston, IL, USA. 14 Center for Interdisciplinary Exploration and Research in Astrophysics (CIERA), Northwestern University, Evanston, IL, USA. 15 Institut fur Physik, Humboldt-Universität zu Berlin, Berlin, Germany. 16 Space Telescope Science Institute, Baltimore, MD, USA. 17 Université Lyon 1, ENS de Lyon, CNRS, Centre de Recherche Astrophysique de Lyon UMR5574, Saint-Genis-Laval, France. 18 Caltech Optical Observatories, California Institute of Technology, Pasadena, CA, USA. 19 Université de Lyon, Université Claude Bernard Lyon 1, CNRS/IN2P3, IP2I Lyon, Villeurbanne, France. 20 IPAC, California Institute of Technology, Pasadena, CA, USA. 21 Department of Astronomy, University of Texas at Austin, Austin, TX, USA. 22 CSFK, Konkoly Observatory, Budapest, Hungary. e-mail: ariel@fysik.su.se