Submit Search
Upload
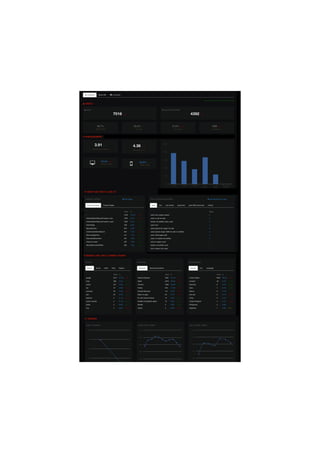
Google Analytics Dashboard Design
•
0 likes
•
356 views
Ritvvij Parrikh
Follow
Report
Share
Report
Share
1 of 1
Download now
Download to read offline
Recommended
Google Analytics, Your Online P&L Statment
Google Analytics, Your Online P&L Statment
Rich Benjamin
Google Analytics Dashboard designed as an Infographic
Google Analytics Dashboard designed as an Infographic
Ritvvij Parrikh
DiSo Dashboard Outline
DiSo Dashboard Outline
Marc Canter
SMX Israel 2012 - Dashboard in Google Analytics
SMX Israel 2012 - Dashboard in Google Analytics
UM Digital Tel-Aviv
Logicentrix Dashboards And Scorecards
Logicentrix Dashboards And Scorecards
sanolan
Google Analytics Web Report
Google Analytics Web Report
Mélanie Calabrese
Balanced Scorecard powered by Basecamp
Balanced Scorecard powered by Basecamp
Balanced Camp
IgniteNM - Google Analytics: Beyond the Dashboard
IgniteNM - Google Analytics: Beyond the Dashboard
skyhawk133
Google Analytics ( Digital Marketing ) Dashboard , Sessions, Technology
Google Analytics ( Digital Marketing ) Dashboard , Sessions, Technology
IMM Graduate School
Online dashboard using Google Analytics API Measure Camp
Online dashboard using Google Analytics API Measure Camp
Michal Brys
An Interactive Visual Analytics Dashboard for the Employment Situation Report
An Interactive Visual Analytics Dashboard for the Employment Situation Report
Benjamin Bengfort
Analytics Dashboard
Analytics Dashboard
Nadeem Khan
Creating Interactive Dashboards with Microsoft Excel
Creating Interactive Dashboards with Microsoft Excel
AACRAO
Intro to digital marketing measurement model for ama alaska analytics class
Intro to digital marketing measurement model for ama alaska analytics class
Scott Thomas
From KPIs to dashboards
From KPIs to dashboards
Ani Lopez
Design Principles of Excel Dashboards & Reports
Design Principles of Excel Dashboards & Reports
Wiley
A Quick Simple MS Excel Dashboard
A Quick Simple MS Excel Dashboard
Pranav Ghode
Introduction to Pykih's Services
Introduction to Pykih's Services
Ritvvij Parrikh
PykQuery.js
PykQuery.js
Ritvvij Parrikh
"A primer for custom data visualization" - An approach towards getting starte...
"A primer for custom data visualization" - An approach towards getting starte...
Ritvvij Parrikh
Taxonomy of charts
Taxonomy of charts
Ritvvij Parrikh
DataMeet 4: Data cleaning & census data
DataMeet 4: Data cleaning & census data
Ritvvij Parrikh
Getting comfortable with Data
Getting comfortable with Data
Ritvvij Parrikh
Visualizing Data Journalism (HasGeek Fifth Elephant)
Visualizing Data Journalism (HasGeek Fifth Elephant)
Ritvvij Parrikh
Talk at eChai, EDI, Ahmedabad
Talk at eChai, EDI, Ahmedabad
Ritvvij Parrikh
Offline Advertisements Analytics Dashboard
Offline Advertisements Analytics Dashboard
Ritvvij Parrikh
Dashboard fhub
Dashboard fhub
Ritvvij Parrikh
Company presentation
Company presentation
Ritvvij Parrikh
JARVIS:BI for FMCG Sales Managers
JARVIS:BI for FMCG Sales Managers
Ritvvij Parrikh
Payroll Giving Management with TracksGiving
Payroll Giving Management with TracksGiving
Ritvvij Parrikh
More Related Content
Viewers also liked
Google Analytics ( Digital Marketing ) Dashboard , Sessions, Technology
Google Analytics ( Digital Marketing ) Dashboard , Sessions, Technology
IMM Graduate School
Online dashboard using Google Analytics API Measure Camp
Online dashboard using Google Analytics API Measure Camp
Michal Brys
An Interactive Visual Analytics Dashboard for the Employment Situation Report
An Interactive Visual Analytics Dashboard for the Employment Situation Report
Benjamin Bengfort
Analytics Dashboard
Analytics Dashboard
Nadeem Khan
Creating Interactive Dashboards with Microsoft Excel
Creating Interactive Dashboards with Microsoft Excel
AACRAO
Intro to digital marketing measurement model for ama alaska analytics class
Intro to digital marketing measurement model for ama alaska analytics class
Scott Thomas
From KPIs to dashboards
From KPIs to dashboards
Ani Lopez
Design Principles of Excel Dashboards & Reports
Design Principles of Excel Dashboards & Reports
Wiley
A Quick Simple MS Excel Dashboard
A Quick Simple MS Excel Dashboard
Pranav Ghode
Viewers also liked
(9)
Google Analytics ( Digital Marketing ) Dashboard , Sessions, Technology
Google Analytics ( Digital Marketing ) Dashboard , Sessions, Technology
Online dashboard using Google Analytics API Measure Camp
Online dashboard using Google Analytics API Measure Camp
An Interactive Visual Analytics Dashboard for the Employment Situation Report
An Interactive Visual Analytics Dashboard for the Employment Situation Report
Analytics Dashboard
Analytics Dashboard
Creating Interactive Dashboards with Microsoft Excel
Creating Interactive Dashboards with Microsoft Excel
Intro to digital marketing measurement model for ama alaska analytics class
Intro to digital marketing measurement model for ama alaska analytics class
From KPIs to dashboards
From KPIs to dashboards
Design Principles of Excel Dashboards & Reports
Design Principles of Excel Dashboards & Reports
A Quick Simple MS Excel Dashboard
A Quick Simple MS Excel Dashboard
More from Ritvvij Parrikh
Introduction to Pykih's Services
Introduction to Pykih's Services
Ritvvij Parrikh
PykQuery.js
PykQuery.js
Ritvvij Parrikh
"A primer for custom data visualization" - An approach towards getting starte...
"A primer for custom data visualization" - An approach towards getting starte...
Ritvvij Parrikh
Taxonomy of charts
Taxonomy of charts
Ritvvij Parrikh
DataMeet 4: Data cleaning & census data
DataMeet 4: Data cleaning & census data
Ritvvij Parrikh
Getting comfortable with Data
Getting comfortable with Data
Ritvvij Parrikh
Visualizing Data Journalism (HasGeek Fifth Elephant)
Visualizing Data Journalism (HasGeek Fifth Elephant)
Ritvvij Parrikh
Talk at eChai, EDI, Ahmedabad
Talk at eChai, EDI, Ahmedabad
Ritvvij Parrikh
Offline Advertisements Analytics Dashboard
Offline Advertisements Analytics Dashboard
Ritvvij Parrikh
Dashboard fhub
Dashboard fhub
Ritvvij Parrikh
Company presentation
Company presentation
Ritvvij Parrikh
JARVIS:BI for FMCG Sales Managers
JARVIS:BI for FMCG Sales Managers
Ritvvij Parrikh
Payroll Giving Management with TracksGiving
Payroll Giving Management with TracksGiving
Ritvvij Parrikh
9 ways how cause marketing can help you achieve your marketing objectives.
9 ways how cause marketing can help you achieve your marketing objectives.
Ritvvij Parrikh
How TracksGiving can help you implement your campaigning software up quicker ...
How TracksGiving can help you implement your campaigning software up quicker ...
Ritvvij Parrikh
More from Ritvvij Parrikh
(15)
Introduction to Pykih's Services
Introduction to Pykih's Services
PykQuery.js
PykQuery.js
"A primer for custom data visualization" - An approach towards getting starte...
"A primer for custom data visualization" - An approach towards getting starte...
Taxonomy of charts
Taxonomy of charts
DataMeet 4: Data cleaning & census data
DataMeet 4: Data cleaning & census data
Getting comfortable with Data
Getting comfortable with Data
Visualizing Data Journalism (HasGeek Fifth Elephant)
Visualizing Data Journalism (HasGeek Fifth Elephant)
Talk at eChai, EDI, Ahmedabad
Talk at eChai, EDI, Ahmedabad
Offline Advertisements Analytics Dashboard
Offline Advertisements Analytics Dashboard
Dashboard fhub
Dashboard fhub
Company presentation
Company presentation
JARVIS:BI for FMCG Sales Managers
JARVIS:BI for FMCG Sales Managers
Payroll Giving Management with TracksGiving
Payroll Giving Management with TracksGiving
9 ways how cause marketing can help you achieve your marketing objectives.
9 ways how cause marketing can help you achieve your marketing objectives.
How TracksGiving can help you implement your campaigning software up quicker ...
How TracksGiving can help you implement your campaigning software up quicker ...
Download now