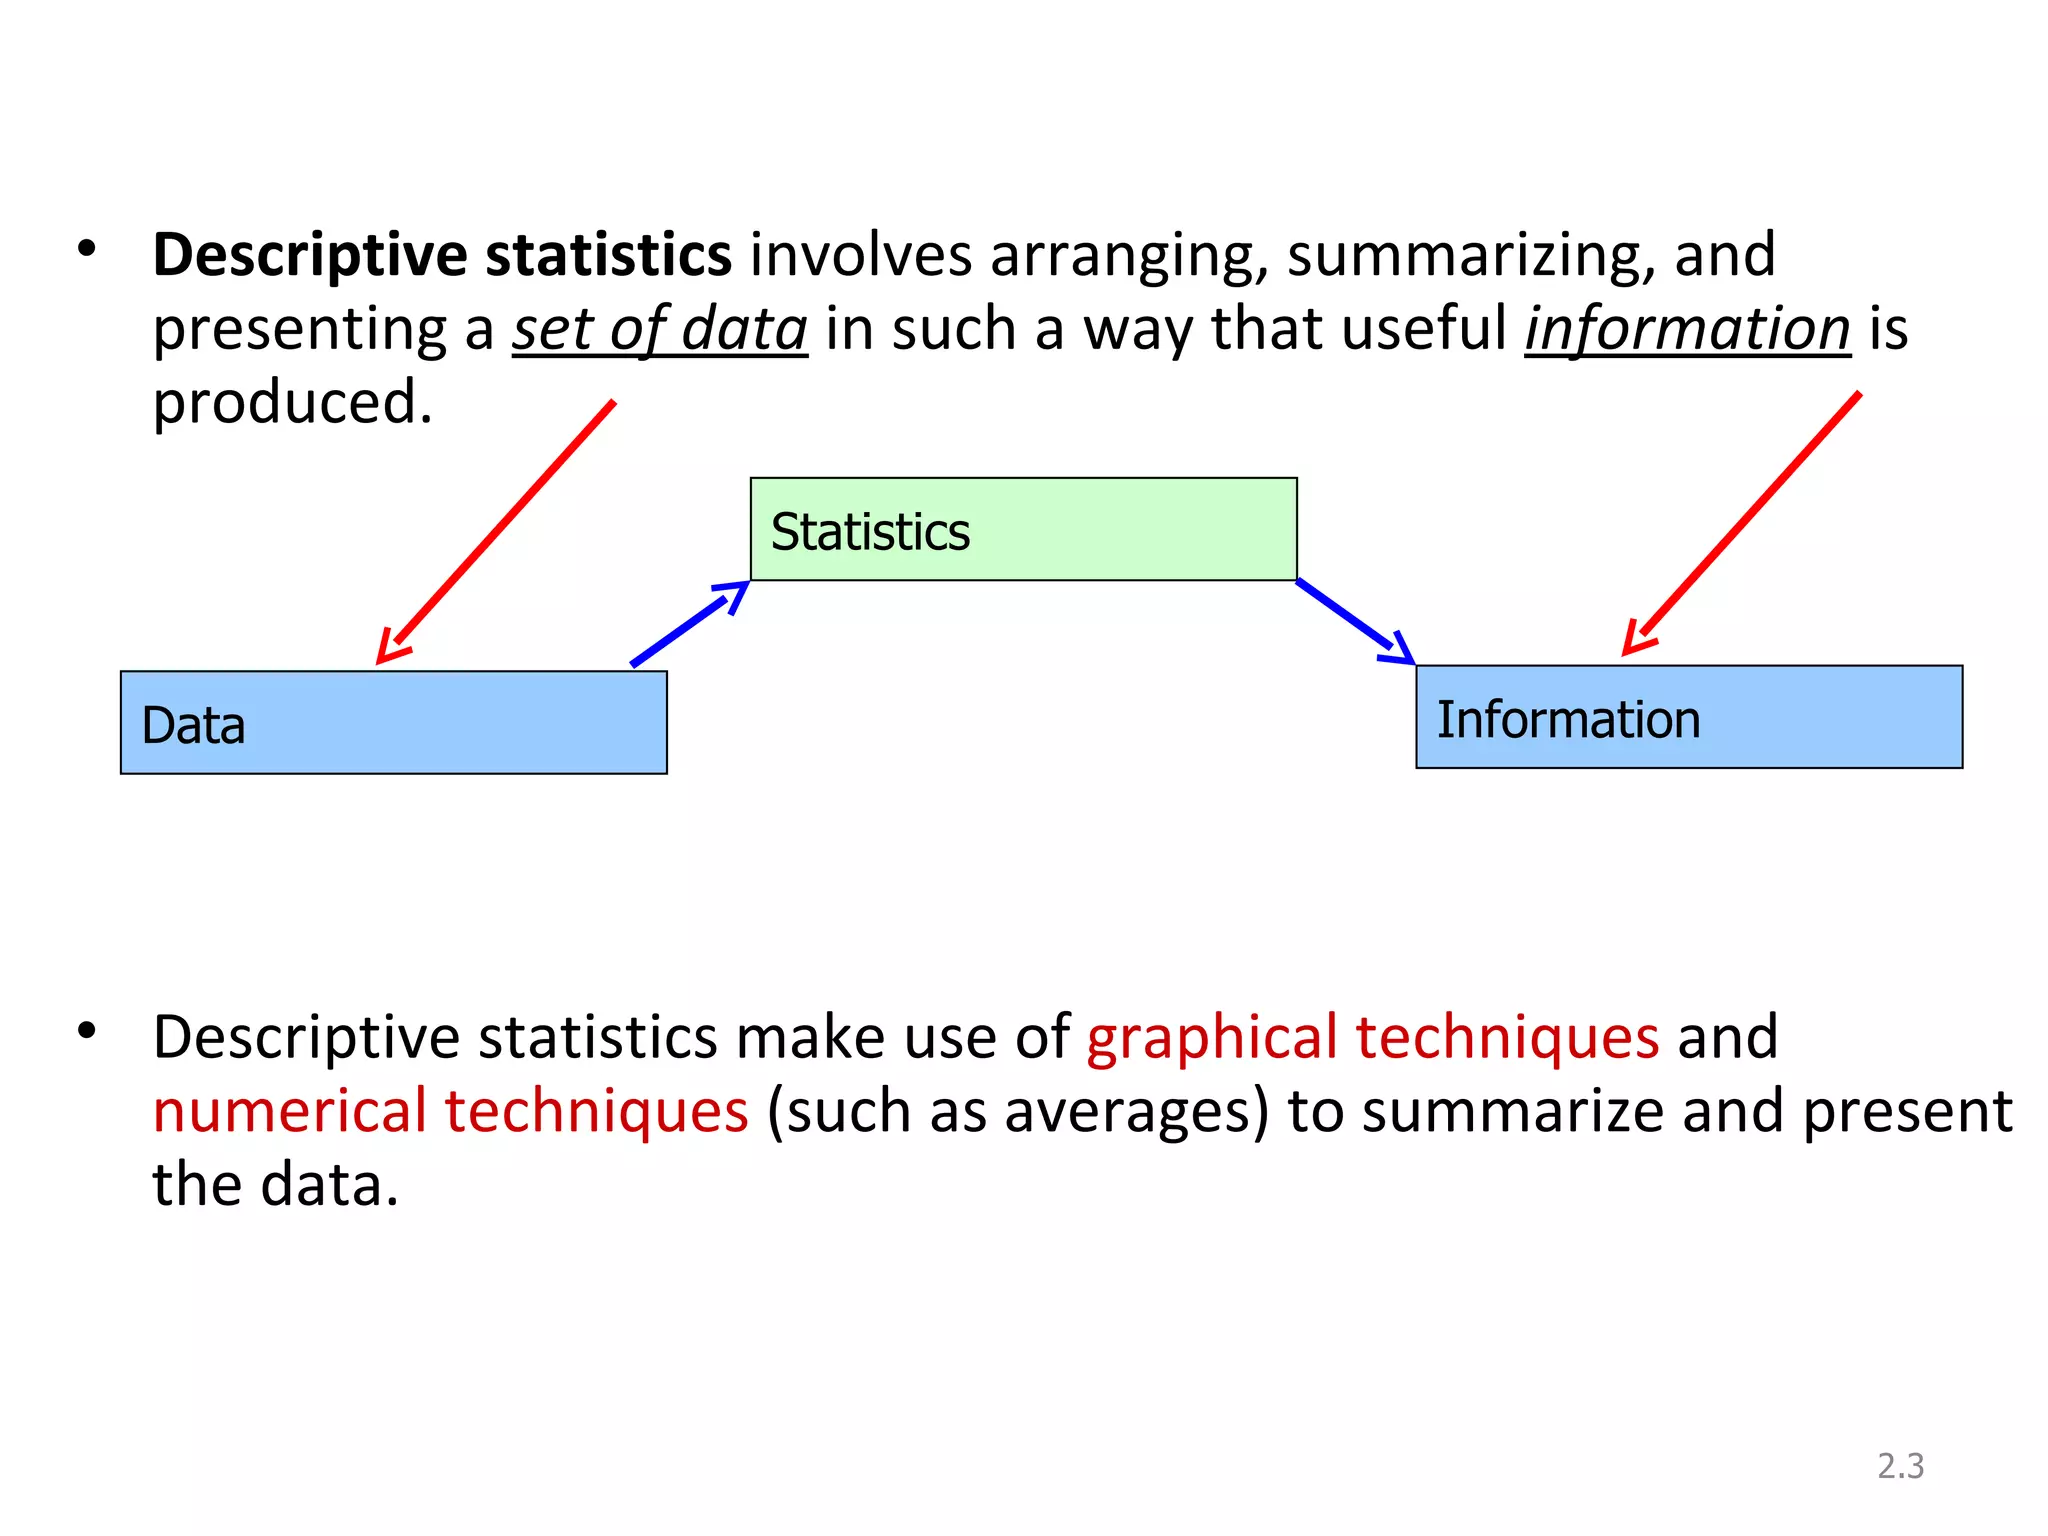
The document discusses organizing and presenting data through descriptive statistics. It covers types of data, constructing frequency distribution tables, calculating relative frequencies and percentages, and using graphical methods like bar graphs, pie charts, histograms and polygons to summarize categorical and quantitative data. Examples are provided to demonstrate how to organize data into frequency distributions and calculate relative frequencies to graph the results.
![Definitions… A variable [Typically called a “random” variable since we do not know it’s value until we observe it] is some characteristic of a population or sample. E.g. student grades, weight of a potato, # heads in 10 flips of a coin, etc. Typically denoted with a capital letter: X, Y, Z… The values of the variable are the range of possible values for a variable. E.g. student marks (0..100) Data are the observed values of a random variable. E.g. student marks: {67, 74, 71, 83, 93, 55, 48} 2.](https://image.slidesharecdn.com/graphicalpresentationofdata-120212103606-phpapp01/75/Graphical-presentation-of-data-4-2048.jpg)
![We Deal with “2” Types of Data Numerical/Quantitative Data [Real Numbers]: * height * weight * temperature Qualitative/Categorical Data [Labels rather than numbers]: * favorite color * Gender * SES 2.](https://image.slidesharecdn.com/graphicalpresentationofdata-120212103606-phpapp01/75/Graphical-presentation-of-data-5-2048.jpg)
![Quantitative/Numerical Data… Quantitative Data is further broken down into Continuous Data – Data can be any real number within a given range. Normally measurement data [weights, Age, Prices, etc] Discrete Data – Data can only be very specific values which we can list. Normally count data [# of firecrackers in a package of 100 that fail to pop, # of accidents on the UTA campus each week, etc] 2.](https://image.slidesharecdn.com/graphicalpresentationofdata-120212103606-phpapp01/75/Graphical-presentation-of-data-6-2048.jpg)
![Qualitative/Categorical Data Nominal Data [ has no natural order to the values]. E.g. responses to questions about marital status: Single = 1, Married = 2, Divorced = 3, Widowed = 4 Arithmetic operations don’t make any sense (e.g. does Widowed ÷ 2 = Married?!) Ordinal Data [values have a natural order ] : E.g. College course rating system: poor = 1, fair = 2, good = 3, very good = 4, excellent = 5 2.](https://image.slidesharecdn.com/graphicalpresentationofdata-120212103606-phpapp01/75/Graphical-presentation-of-data-7-2048.jpg)