SlideShare a Scribd company logo
1 of 13
Download to read offline
Value
Focus
© 2014 Mercer Capital // www.mercercapital.com 1
Convenience Store
Industry
Convenience Stores | Grocery Stores | QSR (Fast Food)
Second Quarter 2014
Equity Market Overview. Over the three months ending March 2014, median stock market
pricing for the convenience store and retail grocery indexes was down 5.0% and 4.7%, respectively,
underperforming the Russell 2000 index’s increase of 0.8%. The Mercer Capital fast food index
posted a 3.0% increase in the first quarter.
Valuations Drift Higher, Ranges Tighten. EBITDA multiples were up across the board.
Multiples for public c-store operators increased from 8.8x EBITDA at the end of the fourth quarter
of 2013 to 9.0x at the end of the first quarter of 2014. EBITDA multiples were at their highest levels
for the five-year period ended Q1-2014. Grocery store and fast food publics posted larger gains,
as shown in the following charts. During 2013, comparable EBITDA multiples for our c-store index
ranged from 8.0x to 8.8x EBITDA. At year-end 2012, the median c-store multiple was 7.8x EBITDA.
C-Store, Grocery Store, & QSR Stock Indices
90
100
110
120
130
140
150
160
170
Apr-13 May-13 Jun-13 Jul-13 Aug-13 Sep-13 Oct-13 Nov-13 Dec-13 Jan-14 Feb-14 Mar-14
MCM C-Store Index MCM Grocery Index MCM Food Franchise Index Russell 2000
4/1/13	
  =	
  100	
  
Data Source: Capital IQ / Bloomberg
BUSINESS VALUATION &
FINANCIAL ADVISORY SERVICES
1
	 As measured by the average of (1) end-of-quarter high EBITDA measures of all the companies in the Mercer Capital index and
(2) the end-of-quarter low EBITDA measures of all the companies in the Mercer Capital index. Travel Centers of America is
currently excluded due to underperformance.
© 2014 Mercer Capital // www.mercercapital.com 2
Mercer Capital’s Value Focus: Convenience Store Industry Second Quarter 2014
3
4
5
6
7
8
9
10
Q1
2009
Q2 Q3 Q4 Q1
2010
Q2 Q3 Q4 Q1
2011
Q2 Q3 Q4 Q1
2012
Q2 Q3 Q4 Q1
2013
Q2 Q3 Q4 Q1
2014
Mid-Point
3
4
5
6
7
8
9
10
Q1
2009
Q2 Q3 Q4 Q1
2010
Q2 Q3 Q4 Q1
2011
Q2 Q3 Q4 Q1
2012
Q2 Q3 Q4 Q1
2013
Q2 Q3 Q4 Q1
2014
Mid-Point
C-Store EBITDA Valuations // Quarterly Range of Mean Highs & Lows
Grocery Store EBITDA Valuations // Quarterly Range of Mean Highs & Lows
Data Source: Bloomberg
© 2014 Mercer Capital // www.mercercapital.com 3
Mercer Capital’s Value Focus: Convenience Store Industry Second Quarter 2014
Margins. Nationwide retail gasoline margins ended the quarter at 15.4 cents per gallon, down from 19.3 cents per gallon in the first
week of the first quarter, but in line with the historical five-year average. According to OPIS, gasoline prices are currently supported
by a low supply, especially in the Southeastern United States, while gasoline demand is on the rise. Diesel margins have rallied,
ending the quarter at 30.9 cents per gallon. Diesel margins during the first week of the first quarter were 26.3 cents per gallon. A wide
separation between gasoline and diesel profits exists across many regions of the country. Many U.S. refineries will complete annual
maintenance in the second quarter, and the increase in gasoline supply should push pricing down and support strong margins.
Generally, over 70% of a c-store’s sales are motor fuels; however, fuel contributes only one-third of total convenience store gross margin
dollars. Fuel margins have been consistent on an annual basis, averaging 16.9 cents per gallon for 2008 through 2012.2
There is a
delay between the time crude prices increase and the time that pump prices rise. This lag also occurs when wholesale prices drop.
Retailers tend to reduce their markups when costs are escalating. Conversely, when costs are declining, retailers tend to leave their
pump prices elevated – leading to increased fuel margins – until competition forces pump pricing downward. The time lag between
cost changes and retail price adjustments as well as the duration of cost trends is a significant influencer of the operator’s margin.
On average, it costs retailers approximately 12 to 16 cents to dispense a gallon of fuel. Given that the average five-year markup on
gasoline was 16.9 cents, this translates to a typical two to three cents per gallon of bottom line profit.
Fast Food (QSR) EBITDA Valuations // Quarterly Range of Mean Highs & Lows
3
5
7
9
11
13
15
Q1
2009
Q2 Q3 Q4 Q1
2010
Q2 Q3 Q4 Q1
2011
Q2 Q3 Q4 Q1
2012
Q2 Q3 Q4 Q1
2013
Q2 Q3 Q4 Q1
2014
	
  Mid-­‐Point	
   Data Source: Bloomberg
2
	 2013 margin average is forthcoming but not yet available at the time of this publication.
© 2014 Mercer Capital // www.mercercapital.com 4
Mercer Capital’s Value Focus: Convenience Store Industry Second Quarter 2014
Tobacco Products. Tobacco products comprised 37% of in-store sales during 2013 and accounted for only 18.7% of gross
margin, according to the NACS. Dollar sales dipped 3.5% in 2013, and unit sales dropped 2.1%. Tobacco sales are the largest inside
product category for c stores. Many industry insiders are predicting the OTP (other tobacco products) category to overtake cigarettes in
the next few years. The OTP category includes e-cigarettes, vapor tobacco products, cigars, and smokeless tobacco. It will take some
time for this to occur, as OTP sales averaged $6,479 per month per store as compared to sales of $44,751 for cigarettes. However,
e-cigarettes posted the strongest growth as a percentage of dollar sales among all c-store product categories, a nearly 177% increase
during 2013.
Taxation remains the biggest challenge to selling cigarettes, and there is a large degree of regulatory uncertainty where the OTP
category is concerned. The FDA is focused on new regulations (or even a ban) on menthol in tobacco products, the decision to
increase the legal age of tobacco purchase to 21 or 25, and new regulations for cigars, pipe tobacco, electronic cigarettes and/or
hookah tobacco.
CVS drug stores are expected to give up $2 billion in tobacco sales as the company exited the category during the quarter. Military
exchanges are considering a ban on tobacco sales as well.
Highway Trust Fund. The Highway Trust Fund (“HTF”) was created by the federal government in 1956 to pay for highway
construction and maintenance. It is funded by an 18.3 cent per gallon federal tax on gasoline and a 24.4 cent per gallon tax on diesel.
These levels have not changed since 1993. Since then, the cost of road construction and maintenance has gone up, and these taxes
have lost more than 40% of their purchasing power, according to the Institute on Taxation and Economic Policy. Over that same time,
vehicles have become more fuel efficient, reducing the total number of gallons purchased and taxes collected per vehicle. A $100
million shortfall is anticipated for the HTC in the third quarter of 2014. Several proposed remedies include:
»» An increase in the cents per gallon tax rate, or indexing the tax to inflation;
»» 	A mileage-based user fee whereby a recorder would be installed in a vehicle to log miles traveled and report them back
to the appropriate taxing authority;
»» A tax on alternative fuel vehicles;
»» Raising U.S. taxes on companies’ overseas earnings; or
»» Rescinding the restriction on tolling federal interstates.
The U.S. Transportation Secretary estimates 700,000 jobs are at risk if the HTF is allowed to become insolvent. This could represent
a concern for c-store operators as construction workers are often a key customer segment. However, an increase in the gasoline tax
could negatively impact the volume of c-store gallons sold.
© 2014 Mercer Capital // www.mercercapital.com 5
Mercer Capital’s Value Focus: Convenience Store Industry Second Quarter 2014
Recent
M&A
Activity
Given that terms were not disclosed relating to these transactions, we are not able to derive valuation multiples. However, industry
insiders are noticing a trend of improving multiples and increased activity. This is expected to continue in 2014.
Factors contributing to higher multiples include the increase of willing lenders to finance transactions at relatively low rates, the
increase of tax-advantaged MLPs and spinoffs, and higher demand for properties in urban centers and smaller format stores. Experts
indicate that while multiples a few years ago were in the 5x - 6x EBITDA range, recent deals have been in the 7x - 8x range.
»» Pantry’s group of dissident shareholders was ultimately successful in placing their chosen nominees to the board of
directors. This may have an influence on the direction of the company in the near term.
»» 	Several major brands announced significant divestiture programs during the first three months of the year after
conducting analyses of their real estate portfolios. CST Brands, Inc. plans to sell approximately 100 stores, 7-Eleven,
Inc. is divesting 72 stores, and Getty Realty Corporation is selling 50 stores.
»» 	Hess Retail Corp. gained approval for a spinoff in early 2014, which is expected to be completed by the middle of
the year. Immediately prior to the release of this publication (May 22, 2014), Hess announced its intention to sell the
recently spun-off retail operations to Marathon Petroleum for $2.6 billion, ending months of speculation regarding the
future of the Hess c-stores. The Hess c-store chain consists of over 1,300 locations and will make Marathon one of the
largest owners and operators of c-stores in the U.S. with locations in 23 states.
»» 	Casey’s General Stores signed an asset purchase agreement to acquire 24 Stop-n-Go locations in North Dakota and
Minnesota, as it looks to expand in the Upper Midwest. The stores are expected to be rebranded upon repurchase.
»» 	The spin-off trend continues as Western Refining Inc. and Northern Tier Energy LP discussed the possibility of
combining and spinning off their respective gas station and convenience store networks into a standalone company.
This conversation took place in the first joint earnings call following Western Refining’s purchase of 38.7% of Northern
Tier Energy LP from ACON Investments and TPG, two private equity firms. While this transaction was primarily a
refining play, it includes the SuperAmerica retail chain consisting of 163 company-operated c-stores and 74 franchised
locations. Western Refining has 229 gas stations and c-stores.
© 2014 Mercer Capital // www.mercercapital.com 6
Mercer Capital’s Value Focus: Convenience Store Industry Second Quarter 2014
Grocery
Stores
Segment Focus The Supermarkets and Grocery Stores industry makes up the largest food retail channel in the United States. Industry revenue totaled
approximately $574.1 billion in 2013, and profit was $9.2 billion. The following chart presents the products and services segmentation
for the industry as estimated for 2014 by IBISWORLD.
This industry has grown over the past five years, benefitting from a strengthening economy and the trend toward organic and all-natural
brands. However, the industry is mature, and revenue is expected to grow at a rate below national GDP over the next five years (1.5%,
annualized). The top four operators account for roughly 30% of industry revenue. Competition from superstores and warehouse clubs
intensified during the recent recession, and remains high. As shown below, other sector operators enjoy modestly lower costs than
grocery store retailers.
© 2014 Mercer Capital // www.mercercapital.com 7
Mercer Capital’s Value Focus: Convenience Store Industry Second Quarter 2014
The industry continues to consolidate, and merger and acquisition activity has been high in recent quarters.
The Kroger Co., the largest pure player in the industry, merged with Harris Teeter Supermarkets in a cash transaction valued at
$2.5 billion in order to boost its market share. This represents a multiple of 7.9x EBITDA.Safeway, with a 6.4% market share, announced
a definitive merger agreement in March 2014 with Albertsons LLC. Albertsons is expected to purchase the struggling Safeway for
$9.2 billion, a multiple of 5.5x EBITDA. Such transactions allow for retailers to lower per-unit costs through economies of scale.
© 2014 Mercer Capital // www.mercercapital.com 8
Mercer Capital’s Value Focus: Convenience Store Industry Second Quarter 2014
The grocery store industry has been facing increasing competition from superstores and discount warehouse clubs, such as Wal-
Mart. According to Wal-Mart’s 10-K for the fiscal year ended January 31, 2014, grocery segment revenues were 56% of total company
revenues. This translates to roughly $264 billion in grocery-related company revenue, making Wal-Mart the nation’s largest grocery
retailer.1
It is estimated that 25% of America’s grocery budget is spent at Wal-Mart.
1
	 Grocery is defined as “grocery items, including meat, produce, deli, bakery, dairy, frozen foods, alcoholic and nonalcoholic beverages, floral and dry grocery, as well as
consumables such as health and beauty aids, baby products, household chemicals, paper goods, and pet supplies.”
© 2014 Mercer Capital // www.mercercapital.com 9
Mercer Capital’s Value Focus: Convenience Store Industry Second Quarter 2014
Fuel Pricing and Supply Charts
Fuel Prices & Supply
$0.00	
  
$0.50	
  
$1.00	
  
$1.50	
  
$2.00	
  
$2.50	
  
$3.00	
  
$3.50	
  
$4.00	
  
$4.50	
  
$5.00	
  
$20	
  
$40	
  
$60	
  
$80	
  
$100	
  
$120	
  
$140	
  
$160	
  
Apr-­‐08	
  
Jul-­‐08	
  
Oct-­‐08	
  
Jan-­‐09	
  
Apr-­‐09	
  
Jul-­‐09	
  
Oct-­‐09	
  
Jan-­‐10	
  
Apr-­‐10	
  
Jul-­‐10	
  
Oct-­‐10	
  
Jan-­‐11	
  
Apr-­‐11	
  
Jul-­‐11	
  
Oct-­‐11	
  
Jan-­‐12	
  
Apr-­‐12	
  
Jul-­‐12	
  
Oct-­‐12	
  
Jan-­‐13	
  
Apr-­‐13	
  
Jul-­‐13	
  
Oct-­‐13	
  
Jan-­‐14	
  
Price/Gallon	
  Price/Barrel	
  
WTI	
   Brent	
   Gasoline	
   Diesel	
  
Data Source: Calculated by Mercer Capital based on raw data obtained from the US Energy Information Administration (EIA.gov)
© 2014 Mercer Capital // www.mercercapital.com 10
Mercer Capital’s Value Focus: Convenience Store Industry Second Quarter 2014
Motor Fuel and Brent Crude Price Fluctuation
-­‐0.2	
  
-­‐0.15	
  
-­‐0.1	
  
-­‐0.05	
  
0	
  
0.05	
  
0.1	
  
0.15	
  
0.2	
  
0.25	
  
Apr-­‐08	
  
Aug-­‐08	
  
Dec-­‐08	
  
Apr-­‐09	
  
Aug-­‐09	
  
Dec-­‐09	
  
Apr-­‐10	
  
Aug-­‐10	
  
Dec-­‐10	
  
Apr-­‐11	
  
Aug-­‐11	
  
Dec-­‐11	
  
Apr-­‐12	
  
Aug-­‐12	
  
Dec-­‐12	
  
Apr-­‐13	
  
Aug-­‐13	
  
Dec-­‐13	
  
Price	
  	
  
Vola9lity	
  
Gasoline	
   Brent	
   Diesel	
  
Data Source: Calculated by Mercer Capital based on raw data obtained from the US Energy Information Administration (EIA.gov)
Fuel Pricing and Supply Charts
© 2014 Mercer Capital // www.mercercapital.com 11
Mercer Capital’s Value Focus: Convenience Store Industry Second Quarter 2014
Prime Supplier Sales Volumes
	
  -­‐	


  50,000	


  100,000	


  150,000	


  200,000	


  250,000	


  300,000	


  350,000	


  400,000	
  	
  
Gas	
  Diesel	
  
Gas	
  Diesel	
  
Gas	
  Diesel	
  
Gas	
  Diesel	
  
Gas	
  Diesel	
  
Gas	
  Diesel	
  
Gas	
  Diesel	
  
Gas	
  Diesel	
  
Gas	
  Diesel	
  
Gas	
  Diesel	
  
Gas	
  Diesel	
  
Gas	
  Diesel	
  
Gas	
  Diesel	
  
Gas	
  Diesel	
  
Gas	
  Diesel	
  
Gas	
  Diesel	
  
Gas	
  Diesel	
  
Gas	
  Diesel	
  
2009	


   2010	


   2011	
   2012	


   2013	


   Feb	
  
'13	


   Mar	
  
'13	


   Apr	
  
'13	


   May	
  
'13	


   June	
  
'13	


   July	
  
'13	


   Aug	
  
'13	


   Sept	
  
'13	


   Oct	
  
'13	


   Nov	
  
'13	


   Dec	
  
'13	


   Jan	
  
'14	


   Feb	
  
'14	
  
000's	
  Gallons/Day	
  
Regular	
   Mid-­‐Grade	
   Premium	
   Diesel	
  
Data Source: US Energy Information Administration (EIA.gov)
Fuel Pricing and Supply Charts
© 2014 Mercer Capital // www.mercercapital.com 12
Mercer Capital’s Value Focus: Convenience Store Industry Second Quarter 2014
Data Source: Calculated by Mercer Capital based on raw data
obtained from the US Energy Information Administration (EIA.gov)
Fuel Pricing and Supply Charts
Percentage Change in Non-Motor Fuel Spread by MonthNon-Motor Fuel Prices
$0.00	
  
$0.50	
  
$1.00	
  
$1.50	
  
$2.00	
  
$2.50	
  
$3.00	
  
$3.50	
  
$4.00	
  
$4.50	
  
Oct-­‐08	
  
M
ar-­‐09	
  
Aug-­‐09	
  
Jan-­‐10	
  
Jun-­‐10	
  
Nov-­‐10	
  
Apr-­‐11	
  
Sep-­‐11	
  
Feb-­‐12	
  
Jul-­‐12	
  
Dec-­‐12	
  
M
ay-­‐13	
  
Oct-­‐13	
  
M
ar-­‐14	
  
Price/Gallon
No. 2 Heating Oil Propane
-­‐100%	
  
-­‐50%	
  
0%	
  
50%	
  
100%	
  
150%	
  
200%	
  
Jan-­‐14	
  
Jan-­‐14	
  
Jan-­‐14	
  
Jan-­‐14	
  
Feb-­‐14	
  
Feb-­‐14	
  
Feb-­‐14	
  
Feb-­‐14	
  
M
ar-­‐14	
  
M
ar-­‐14	
  
M
ar-­‐14	
  
%	
  +/-­‐	
  in	
  Hea5ng	
  Oil	
  Spread	
   %	
  +/-­‐	
  Inc/Dec	
  in	
  Propane	
  Spread	
  
Data Source: US Energy Information Administration (EIA.gov)
Mercer
Capital
Convenience Store
Industry Services
Contact Us
Copyright © 2014 Mercer Capital Management, Inc. All rights reserved. It is illegal under Federal law to reproduce this publication or any portion of its contents without the publisher’s permission. Media quotations with source attribution are encouraged.
Reporters requesting additional information or editorial comment should contact Barbara Walters Price at 901.685.2120. Mercer Capital’s Industry Focus is published quarterly and does not constitute legal or financial consulting advice. It is offered as an
information service to our clients and friends. Those interested in specific guidance for legal or accounting matters should seek competent professional advice. Inquiries to discuss specific valuation matters are welcomed. To add your name to our mailing list
to receive this complimentary publication, visit our web site at www.mercercapital.com.
Mercer Capital provides the multi-unit retailing and QSR industries with
corporate valuation, financial reporting, transaction advisory, and related
services.
Industry Segments
Mercer Capital serves the following industry segments:
•	 Convenience stores
•	 Grocery stores
•	 Fast food (QSR)
•	 Travel Centers
Mercer Capital Experience
•	 Family and management succession planning
•	 Buy-side and sell-side transaction advisory assistance
•	 Conflict resolution and litigation support
•	 Trust and estate planning
•	 Buy-sell agreement valuation, design, and funding advisory
Eden G. Stanton, CFA
901.270.7250
stantone@mercercapital.com
Timothy R. Lee, ASA
901.322.9740
leet@mercercapital.com
Mercer Capital
5100 Poplar Avenue, Suite 2600
Memphis, Tennessee 38137
901.685.2120 (P)
www.mercercapital.com
BUSINESS VALUATION &
FINANCIAL ADVISORY SERVICES

More Related Content

What's hot

Profitable addictions- Sin stocks main
Profitable addictions- Sin stocks mainProfitable addictions- Sin stocks main
Profitable addictions- Sin stocks mainSonia Khalsa
 
FreePint Review of Avention
FreePint Review of AventionFreePint Review of Avention
FreePint Review of AventionAvention
 
cf industries 2015 annual report ammonia
cf industries 2015 annual report ammoniacf industries 2015 annual report ammonia
cf industries 2015 annual report ammoniaSteve Wittrig
 
CF Industries 8 8 16 update ammonia
CF Industries 8 8 16 update ammoniaCF Industries 8 8 16 update ammonia
CF Industries 8 8 16 update ammoniaSteve Wittrig
 
Aranca Brief | Global Deals (M & A) - Volume-1-1 - September 2014
Aranca Brief | Global Deals (M & A) - Volume-1-1 - September 2014Aranca Brief | Global Deals (M & A) - Volume-1-1 - September 2014
Aranca Brief | Global Deals (M & A) - Volume-1-1 - September 2014Aranca
 
Cox Automotive Market Insight Overview December & FY 2019
Cox Automotive Market Insight Overview   December & FY 2019  Cox Automotive Market Insight Overview   December & FY 2019
Cox Automotive Market Insight Overview December & FY 2019 Philip Nothard
 
Cox Automotive Market Insight Overview November 2019
Cox Automotive Market Insight Overview   November 2019  Cox Automotive Market Insight Overview   November 2019
Cox Automotive Market Insight Overview November 2019 Philip Nothard
 
Shale gas downstream investment $164 bb
Shale gas downstream investment $164 bbShale gas downstream investment $164 bb
Shale gas downstream investment $164 bbSteve Wittrig
 
Economic & Industry Overview Q3 2017
Economic & Industry Overview Q3 2017Economic & Industry Overview Q3 2017
Economic & Industry Overview Q3 2017liselcoleman
 
Cox Automotive Market Insight Overview March 2019
Cox Automotive Market Insight Overview   March 2019Cox Automotive Market Insight Overview   March 2019
Cox Automotive Market Insight Overview March 2019Philip Nothard
 
The Boulder Group | Q3 2014 Net Lease Research Report2014 q3-net-lease-resear...
The Boulder Group | Q3 2014 Net Lease Research Report2014 q3-net-lease-resear...The Boulder Group | Q3 2014 Net Lease Research Report2014 q3-net-lease-resear...
The Boulder Group | Q3 2014 Net Lease Research Report2014 q3-net-lease-resear...The Boulder Group
 
Cox Automotive Market Overview - May 2018
Cox Automotive   Market Overview - May 2018 Cox Automotive   Market Overview - May 2018
Cox Automotive Market Overview - May 2018 Philip Nothard
 
20171103 sauc q3 2017 teleconference slides final
20171103 sauc q3 2017 teleconference slides final20171103 sauc q3 2017 teleconference slides final
20171103 sauc q3 2017 teleconference slides finaldrhincorporated
 
Trup investor presentation march 2017
Trup investor presentation   march 2017Trup investor presentation   march 2017
Trup investor presentation march 2017trupanion
 

What's hot (20)

Profitable addictions- Sin stocks main
Profitable addictions- Sin stocks mainProfitable addictions- Sin stocks main
Profitable addictions- Sin stocks main
 
FreePint Review of Avention
FreePint Review of AventionFreePint Review of Avention
FreePint Review of Avention
 
cf industries 2015 annual report ammonia
cf industries 2015 annual report ammoniacf industries 2015 annual report ammonia
cf industries 2015 annual report ammonia
 
Retail Mix | Retail Pulse
Retail Mix | Retail PulseRetail Mix | Retail Pulse
Retail Mix | Retail Pulse
 
CF Industries 8 8 16 update ammonia
CF Industries 8 8 16 update ammoniaCF Industries 8 8 16 update ammonia
CF Industries 8 8 16 update ammonia
 
Aranca Brief | Global Deals (M & A) - Volume-1-1 - September 2014
Aranca Brief | Global Deals (M & A) - Volume-1-1 - September 2014Aranca Brief | Global Deals (M & A) - Volume-1-1 - September 2014
Aranca Brief | Global Deals (M & A) - Volume-1-1 - September 2014
 
Salesforce
SalesforceSalesforce
Salesforce
 
Cox Automotive Market Insight Overview December & FY 2019
Cox Automotive Market Insight Overview   December & FY 2019  Cox Automotive Market Insight Overview   December & FY 2019
Cox Automotive Market Insight Overview December & FY 2019
 
Cox Automotive Market Insight Overview November 2019
Cox Automotive Market Insight Overview   November 2019  Cox Automotive Market Insight Overview   November 2019
Cox Automotive Market Insight Overview November 2019
 
Shale gas downstream investment $164 bb
Shale gas downstream investment $164 bbShale gas downstream investment $164 bb
Shale gas downstream investment $164 bb
 
Economic & Industry Overview Q3 2017
Economic & Industry Overview Q3 2017Economic & Industry Overview Q3 2017
Economic & Industry Overview Q3 2017
 
Bh24 23 july 2014
Bh24 23 july 2014Bh24 23 july 2014
Bh24 23 july 2014
 
Travis Perkins PLC Research Report
Travis Perkins PLC Research Report Travis Perkins PLC Research Report
Travis Perkins PLC Research Report
 
Cox Automotive Market Insight Overview March 2019
Cox Automotive Market Insight Overview   March 2019Cox Automotive Market Insight Overview   March 2019
Cox Automotive Market Insight Overview March 2019
 
Tung Anh Nguyen's Writing Sample 1
Tung Anh Nguyen's Writing Sample 1Tung Anh Nguyen's Writing Sample 1
Tung Anh Nguyen's Writing Sample 1
 
The Boulder Group | Q3 2014 Net Lease Research Report2014 q3-net-lease-resear...
The Boulder Group | Q3 2014 Net Lease Research Report2014 q3-net-lease-resear...The Boulder Group | Q3 2014 Net Lease Research Report2014 q3-net-lease-resear...
The Boulder Group | Q3 2014 Net Lease Research Report2014 q3-net-lease-resear...
 
Cox Automotive Market Overview - May 2018
Cox Automotive   Market Overview - May 2018 Cox Automotive   Market Overview - May 2018
Cox Automotive Market Overview - May 2018
 
20171103 sauc q3 2017 teleconference slides final
20171103 sauc q3 2017 teleconference slides final20171103 sauc q3 2017 teleconference slides final
20171103 sauc q3 2017 teleconference slides final
 
Trup investor presentation march 2017
Trup investor presentation   march 2017Trup investor presentation   march 2017
Trup investor presentation march 2017
 
George Weston (WN-T)
George Weston (WN-T)George Weston (WN-T)
George Weston (WN-T)
 

Similar to Mercer Capital's Value Focus: Convenience Store Industry | Month Year | Segment: Grocery Stores

Mercer Capital's Value Focus: Convenience Store Industry | Q4 2014 | Segment:...
Mercer Capital's Value Focus: Convenience Store Industry | Q4 2014 | Segment:...Mercer Capital's Value Focus: Convenience Store Industry | Q4 2014 | Segment:...
Mercer Capital's Value Focus: Convenience Store Industry | Q4 2014 | Segment:...Mercer Capital
 
Mercer Capital's Value Focus: Convenience Store Industry | Q1 2016 | Segment:...
Mercer Capital's Value Focus: Convenience Store Industry | Q1 2016 | Segment:...Mercer Capital's Value Focus: Convenience Store Industry | Q1 2016 | Segment:...
Mercer Capital's Value Focus: Convenience Store Industry | Q1 2016 | Segment:...Mercer Capital
 
Mercer Capital's Value Focus: Convenience Store Industry | Q1 2015 | Segment:...
Mercer Capital's Value Focus: Convenience Store Industry | Q1 2015 | Segment:...Mercer Capital's Value Focus: Convenience Store Industry | Q1 2015 | Segment:...
Mercer Capital's Value Focus: Convenience Store Industry | Q1 2015 | Segment:...Mercer Capital
 
Deloitte: Oil & Gas Mergers and Acquisitions Report – Mid-year 2016
Deloitte: Oil & Gas Mergers and Acquisitions Report – Mid-year 2016Deloitte: Oil & Gas Mergers and Acquisitions Report – Mid-year 2016
Deloitte: Oil & Gas Mergers and Acquisitions Report – Mid-year 2016Marcellus Drilling News
 
Delltona Gas Station_SAMPLE.pdf
Delltona Gas Station_SAMPLE.pdfDelltona Gas Station_SAMPLE.pdf
Delltona Gas Station_SAMPLE.pdfJanaGough
 
Thor investor presentation 3.6.17 final
Thor investor presentation 3.6.17 finalThor investor presentation 3.6.17 final
Thor investor presentation 3.6.17 finalThor_Industries
 
Mercer Capital's Value Focus: Refining | 2Q16
Mercer Capital's Value Focus: Refining | 2Q16 Mercer Capital's Value Focus: Refining | 2Q16
Mercer Capital's Value Focus: Refining | 2Q16 Mercer Capital
 
Mercer Capital's Value Focus: Auto Dealer Industry | Mid-Year 2018
Mercer Capital's Value Focus: Auto Dealer Industry | Mid-Year 2018Mercer Capital's Value Focus: Auto Dealer Industry | Mid-Year 2018
Mercer Capital's Value Focus: Auto Dealer Industry | Mid-Year 2018Mercer Capital
 
Investor presentation20140317
Investor presentation20140317Investor presentation20140317
Investor presentation20140317Thor_Industries
 
Thor investor presentation20140422_v001_m302cw
Thor investor presentation20140422_v001_m302cwThor investor presentation20140422_v001_m302cw
Thor investor presentation20140422_v001_m302cwThor_Industries
 
Cox Automotive Market Insight Overview June & H1 2019
Cox Automotive Market Insight Overview   June & H1 2019Cox Automotive Market Insight Overview   June & H1 2019
Cox Automotive Market Insight Overview June & H1 2019Philip Nothard
 
Accenture Spend Trends Report Q3 2014
Accenture Spend Trends Report Q3 2014Accenture Spend Trends Report Q3 2014
Accenture Spend Trends Report Q3 2014accenture
 
Thor investor presentation 3.6.14 final
Thor investor presentation 3.6.14   finalThor investor presentation 3.6.14   final
Thor investor presentation 3.6.14 finalThor_Industries
 
OIL AND GAS SALARY GUIDE 2014
OIL AND GAS SALARY GUIDE 2014OIL AND GAS SALARY GUIDE 2014
OIL AND GAS SALARY GUIDE 2014Hays Netherlands
 
Supply Chain Metrics That Matter: A Focus on Food & Beverage Companies 2017
Supply Chain Metrics That Matter: A Focus on Food & Beverage Companies 2017Supply Chain Metrics That Matter: A Focus on Food & Beverage Companies 2017
Supply Chain Metrics That Matter: A Focus on Food & Beverage Companies 2017Lora Cecere
 
Mercer Capital's Value Focus: Convenience Store Industry | Q1 2017 | Segment:...
Mercer Capital's Value Focus: Convenience Store Industry | Q1 2017 | Segment:...Mercer Capital's Value Focus: Convenience Store Industry | Q1 2017 | Segment:...
Mercer Capital's Value Focus: Convenience Store Industry | Q1 2017 | Segment:...Mercer Capital
 
Top 100 Retailers and Categories
Top 100 Retailers and CategoriesTop 100 Retailers and Categories
Top 100 Retailers and CategoriesHumberto Galasso
 

Similar to Mercer Capital's Value Focus: Convenience Store Industry | Month Year | Segment: Grocery Stores (20)

Mercer Capital's Value Focus: Convenience Store Industry | Q4 2014 | Segment:...
Mercer Capital's Value Focus: Convenience Store Industry | Q4 2014 | Segment:...Mercer Capital's Value Focus: Convenience Store Industry | Q4 2014 | Segment:...
Mercer Capital's Value Focus: Convenience Store Industry | Q4 2014 | Segment:...
 
Mercer Capital's Value Focus: Convenience Store Industry | Q1 2016 | Segment:...
Mercer Capital's Value Focus: Convenience Store Industry | Q1 2016 | Segment:...Mercer Capital's Value Focus: Convenience Store Industry | Q1 2016 | Segment:...
Mercer Capital's Value Focus: Convenience Store Industry | Q1 2016 | Segment:...
 
Mercer Capital's Value Focus: Convenience Store Industry | Q1 2015 | Segment:...
Mercer Capital's Value Focus: Convenience Store Industry | Q1 2015 | Segment:...Mercer Capital's Value Focus: Convenience Store Industry | Q1 2015 | Segment:...
Mercer Capital's Value Focus: Convenience Store Industry | Q1 2015 | Segment:...
 
HCUK-mid-year-review
HCUK-mid-year-reviewHCUK-mid-year-review
HCUK-mid-year-review
 
Deloitte: Oil & Gas Mergers and Acquisitions Report – Mid-year 2016
Deloitte: Oil & Gas Mergers and Acquisitions Report – Mid-year 2016Deloitte: Oil & Gas Mergers and Acquisitions Report – Mid-year 2016
Deloitte: Oil & Gas Mergers and Acquisitions Report – Mid-year 2016
 
Delltona Gas Station_SAMPLE.pdf
Delltona Gas Station_SAMPLE.pdfDelltona Gas Station_SAMPLE.pdf
Delltona Gas Station_SAMPLE.pdf
 
Thor investor presentation 3.6.17 final
Thor investor presentation 3.6.17 finalThor investor presentation 3.6.17 final
Thor investor presentation 3.6.17 final
 
Mercer Capital's Value Focus: Refining | 2Q16
Mercer Capital's Value Focus: Refining | 2Q16 Mercer Capital's Value Focus: Refining | 2Q16
Mercer Capital's Value Focus: Refining | 2Q16
 
Mercer Capital's Value Focus: Auto Dealer Industry | Mid-Year 2018
Mercer Capital's Value Focus: Auto Dealer Industry | Mid-Year 2018Mercer Capital's Value Focus: Auto Dealer Industry | Mid-Year 2018
Mercer Capital's Value Focus: Auto Dealer Industry | Mid-Year 2018
 
Investor presentation20140317
Investor presentation20140317Investor presentation20140317
Investor presentation20140317
 
Thor investor presentation20140422_v001_m302cw
Thor investor presentation20140422_v001_m302cwThor investor presentation20140422_v001_m302cw
Thor investor presentation20140422_v001_m302cw
 
Cox Automotive Market Insight Overview June & H1 2019
Cox Automotive Market Insight Overview   June & H1 2019Cox Automotive Market Insight Overview   June & H1 2019
Cox Automotive Market Insight Overview June & H1 2019
 
Accenture Spend Trends Report Q3 2014
Accenture Spend Trends Report Q3 2014Accenture Spend Trends Report Q3 2014
Accenture Spend Trends Report Q3 2014
 
Thor investor presentation 3.6.14 final
Thor investor presentation 3.6.14   finalThor investor presentation 3.6.14   final
Thor investor presentation 3.6.14 final
 
OIL AND GAS SALARY GUIDE 2014
OIL AND GAS SALARY GUIDE 2014OIL AND GAS SALARY GUIDE 2014
OIL AND GAS SALARY GUIDE 2014
 
Supply Chain Metrics That Matter: A Focus on Food & Beverage Companies 2017
Supply Chain Metrics That Matter: A Focus on Food & Beverage Companies 2017Supply Chain Metrics That Matter: A Focus on Food & Beverage Companies 2017
Supply Chain Metrics That Matter: A Focus on Food & Beverage Companies 2017
 
Mercer Capital's Value Focus: Convenience Store Industry | Q1 2017 | Segment:...
Mercer Capital's Value Focus: Convenience Store Industry | Q1 2017 | Segment:...Mercer Capital's Value Focus: Convenience Store Industry | Q1 2017 | Segment:...
Mercer Capital's Value Focus: Convenience Store Industry | Q1 2017 | Segment:...
 
Updated cyh pitchbook
Updated cyh pitchbookUpdated cyh pitchbook
Updated cyh pitchbook
 
Kroger Strategic Proposal
Kroger Strategic ProposalKroger Strategic Proposal
Kroger Strategic Proposal
 
Top 100 Retailers and Categories
Top 100 Retailers and CategoriesTop 100 Retailers and Categories
Top 100 Retailers and Categories
 

More from Mercer Capital

Mercer Capital's Bank Watch | September 2023 | The Interest Rate Environment ...
Mercer Capital's Bank Watch | September 2023 | The Interest Rate Environment ...Mercer Capital's Bank Watch | September 2023 | The Interest Rate Environment ...
Mercer Capital's Bank Watch | September 2023 | The Interest Rate Environment ...Mercer Capital
 
Mercer Capital's Investment Management Industry Newsletter | Q2 2023 | Focus:...
Mercer Capital's Investment Management Industry Newsletter | Q2 2023 | Focus:...Mercer Capital's Investment Management Industry Newsletter | Q2 2023 | Focus:...
Mercer Capital's Investment Management Industry Newsletter | Q2 2023 | Focus:...Mercer Capital
 
Mercer Capital's Bank Watch | July 2023 | Bank Impairment Testing
Mercer Capital's Bank Watch | July 2023 | Bank Impairment TestingMercer Capital's Bank Watch | July 2023 | Bank Impairment Testing
Mercer Capital's Bank Watch | July 2023 | Bank Impairment TestingMercer Capital
 
Mercer Capital's Value Focus: Transportation & Logistics | Q1 2023 |
Mercer Capital's Value Focus: Transportation & Logistics  | Q1 2023 |Mercer Capital's Value Focus: Transportation & Logistics  | Q1 2023 |
Mercer Capital's Value Focus: Transportation & Logistics | Q1 2023 |Mercer Capital
 
Mercer Capital's Value Matters™ | Issue No. 1, 2023
Mercer Capital's Value Matters™ | Issue No. 1, 2023  Mercer Capital's Value Matters™ | Issue No. 1, 2023
Mercer Capital's Value Matters™ | Issue No. 1, 2023 Mercer Capital
 
Mercer Capital - Corporate Finance in 30 Minutes Whitepaper.pdf
Mercer Capital - Corporate Finance in 30 Minutes Whitepaper.pdfMercer Capital - Corporate Finance in 30 Minutes Whitepaper.pdf
Mercer Capital - Corporate Finance in 30 Minutes Whitepaper.pdfMercer Capital
 
Mercer Capital's Bank Watch | March 2023 | “I’m Not Broke. I’m Just Not Liquid.”
Mercer Capital's Bank Watch | March 2023 | “I’m Not Broke. I’m Just Not Liquid.”Mercer Capital's Bank Watch | March 2023 | “I’m Not Broke. I’m Just Not Liquid.”
Mercer Capital's Bank Watch | March 2023 | “I’m Not Broke. I’m Just Not Liquid.”Mercer Capital
 
Mercer Capital's Middle Market Transaction Update | Spring 2023
Mercer Capital's Middle Market Transaction Update | Spring 2023Mercer Capital's Middle Market Transaction Update | Spring 2023
Mercer Capital's Middle Market Transaction Update | Spring 2023Mercer Capital
 
Mercer Capital's Bank Watch | February 2023 | Themes from Bank Director’s 202...
Mercer Capital's Bank Watch | February 2023 | Themes from Bank Director’s 202...Mercer Capital's Bank Watch | February 2023 | Themes from Bank Director’s 202...
Mercer Capital's Bank Watch | February 2023 | Themes from Bank Director’s 202...Mercer Capital
 
Mercer Capital's Investment Management Industry Newsletter | Q4 2023 | Focus:...
Mercer Capital's Investment Management Industry Newsletter | Q4 2023 | Focus:...Mercer Capital's Investment Management Industry Newsletter | Q4 2023 | Focus:...
Mercer Capital's Investment Management Industry Newsletter | Q4 2023 | Focus:...Mercer Capital
 
Mercer Capital's Value Focus: Exploration and Production | Fourth Quarter 202...
Mercer Capital's Value Focus: Exploration and Production | Fourth Quarter 202...Mercer Capital's Value Focus: Exploration and Production | Fourth Quarter 202...
Mercer Capital's Value Focus: Exploration and Production | Fourth Quarter 202...Mercer Capital
 
Mercer Capital's Middle Market Transaction Update | Winter 2022
Mercer Capital's Middle Market Transaction Update | Winter 2022Mercer Capital's Middle Market Transaction Update | Winter 2022
Mercer Capital's Middle Market Transaction Update | Winter 2022Mercer Capital
 
Mercer Capital's Bank Watch | December 2022 | Bank M&A 2022 - Turbulence
Mercer Capital's Bank Watch | December 2022 | Bank M&A 2022 - TurbulenceMercer Capital's Bank Watch | December 2022 | Bank M&A 2022 - Turbulence
Mercer Capital's Bank Watch | December 2022 | Bank M&A 2022 - TurbulenceMercer Capital
 
Mercer Capital's Value Matters™ | Issue No. 3, 2022|
Mercer Capital's Value Matters™ | Issue No. 3, 2022|Mercer Capital's Value Matters™ | Issue No. 3, 2022|
Mercer Capital's Value Matters™ | Issue No. 3, 2022|Mercer Capital
 
Mercer Capital's Value Focus: Transportation & Logistics | Q3 2022
Mercer Capital's Value Focus: Transportation & Logistics  | Q3 2022 Mercer Capital's Value Focus: Transportation & Logistics  | Q3 2022
Mercer Capital's Value Focus: Transportation & Logistics | Q3 2022 Mercer Capital
 
Mercer Capital's Bank Watch | November 2022 | Community Bank Loan Portfolios ...
Mercer Capital's Bank Watch | November 2022 | Community Bank Loan Portfolios ...Mercer Capital's Bank Watch | November 2022 | Community Bank Loan Portfolios ...
Mercer Capital's Bank Watch | November 2022 | Community Bank Loan Portfolios ...Mercer Capital
 
Mercer Capital's Investment Management Industry Newsletter | Q3 2022 | Focus:...
Mercer Capital's Investment Management Industry Newsletter | Q3 2022 | Focus:...Mercer Capital's Investment Management Industry Newsletter | Q3 2022 | Focus:...
Mercer Capital's Investment Management Industry Newsletter | Q3 2022 | Focus:...Mercer Capital
 
Mercer Capital's Investment Management Industry Newsletter | Q2 2022 | Segmen...
Mercer Capital's Investment Management Industry Newsletter | Q2 2022 | Segmen...Mercer Capital's Investment Management Industry Newsletter | Q2 2022 | Segmen...
Mercer Capital's Investment Management Industry Newsletter | Q2 2022 | Segmen...Mercer Capital
 
Mercer Capital's Bank Watch | October 2022 | How Are Tech-Forward Banks Perfo...
Mercer Capital's Bank Watch | October 2022 | How Are Tech-Forward Banks Perfo...Mercer Capital's Bank Watch | October 2022 | How Are Tech-Forward Banks Perfo...
Mercer Capital's Bank Watch | October 2022 | How Are Tech-Forward Banks Perfo...Mercer Capital
 
Mercer Capital's Value Focus: Transportation & Logistics | Q2 2022 | Feature...
Mercer Capital's Value Focus: Transportation & Logistics  | Q2 2022 | Feature...Mercer Capital's Value Focus: Transportation & Logistics  | Q2 2022 | Feature...
Mercer Capital's Value Focus: Transportation & Logistics | Q2 2022 | Feature...Mercer Capital
 

More from Mercer Capital (20)

Mercer Capital's Bank Watch | September 2023 | The Interest Rate Environment ...
Mercer Capital's Bank Watch | September 2023 | The Interest Rate Environment ...Mercer Capital's Bank Watch | September 2023 | The Interest Rate Environment ...
Mercer Capital's Bank Watch | September 2023 | The Interest Rate Environment ...
 
Mercer Capital's Investment Management Industry Newsletter | Q2 2023 | Focus:...
Mercer Capital's Investment Management Industry Newsletter | Q2 2023 | Focus:...Mercer Capital's Investment Management Industry Newsletter | Q2 2023 | Focus:...
Mercer Capital's Investment Management Industry Newsletter | Q2 2023 | Focus:...
 
Mercer Capital's Bank Watch | July 2023 | Bank Impairment Testing
Mercer Capital's Bank Watch | July 2023 | Bank Impairment TestingMercer Capital's Bank Watch | July 2023 | Bank Impairment Testing
Mercer Capital's Bank Watch | July 2023 | Bank Impairment Testing
 
Mercer Capital's Value Focus: Transportation & Logistics | Q1 2023 |
Mercer Capital's Value Focus: Transportation & Logistics  | Q1 2023 |Mercer Capital's Value Focus: Transportation & Logistics  | Q1 2023 |
Mercer Capital's Value Focus: Transportation & Logistics | Q1 2023 |
 
Mercer Capital's Value Matters™ | Issue No. 1, 2023
Mercer Capital's Value Matters™ | Issue No. 1, 2023  Mercer Capital's Value Matters™ | Issue No. 1, 2023
Mercer Capital's Value Matters™ | Issue No. 1, 2023
 
Mercer Capital - Corporate Finance in 30 Minutes Whitepaper.pdf
Mercer Capital - Corporate Finance in 30 Minutes Whitepaper.pdfMercer Capital - Corporate Finance in 30 Minutes Whitepaper.pdf
Mercer Capital - Corporate Finance in 30 Minutes Whitepaper.pdf
 
Mercer Capital's Bank Watch | March 2023 | “I’m Not Broke. I’m Just Not Liquid.”
Mercer Capital's Bank Watch | March 2023 | “I’m Not Broke. I’m Just Not Liquid.”Mercer Capital's Bank Watch | March 2023 | “I’m Not Broke. I’m Just Not Liquid.”
Mercer Capital's Bank Watch | March 2023 | “I’m Not Broke. I’m Just Not Liquid.”
 
Mercer Capital's Middle Market Transaction Update | Spring 2023
Mercer Capital's Middle Market Transaction Update | Spring 2023Mercer Capital's Middle Market Transaction Update | Spring 2023
Mercer Capital's Middle Market Transaction Update | Spring 2023
 
Mercer Capital's Bank Watch | February 2023 | Themes from Bank Director’s 202...
Mercer Capital's Bank Watch | February 2023 | Themes from Bank Director’s 202...Mercer Capital's Bank Watch | February 2023 | Themes from Bank Director’s 202...
Mercer Capital's Bank Watch | February 2023 | Themes from Bank Director’s 202...
 
Mercer Capital's Investment Management Industry Newsletter | Q4 2023 | Focus:...
Mercer Capital's Investment Management Industry Newsletter | Q4 2023 | Focus:...Mercer Capital's Investment Management Industry Newsletter | Q4 2023 | Focus:...
Mercer Capital's Investment Management Industry Newsletter | Q4 2023 | Focus:...
 
Mercer Capital's Value Focus: Exploration and Production | Fourth Quarter 202...
Mercer Capital's Value Focus: Exploration and Production | Fourth Quarter 202...Mercer Capital's Value Focus: Exploration and Production | Fourth Quarter 202...
Mercer Capital's Value Focus: Exploration and Production | Fourth Quarter 202...
 
Mercer Capital's Middle Market Transaction Update | Winter 2022
Mercer Capital's Middle Market Transaction Update | Winter 2022Mercer Capital's Middle Market Transaction Update | Winter 2022
Mercer Capital's Middle Market Transaction Update | Winter 2022
 
Mercer Capital's Bank Watch | December 2022 | Bank M&A 2022 - Turbulence
Mercer Capital's Bank Watch | December 2022 | Bank M&A 2022 - TurbulenceMercer Capital's Bank Watch | December 2022 | Bank M&A 2022 - Turbulence
Mercer Capital's Bank Watch | December 2022 | Bank M&A 2022 - Turbulence
 
Mercer Capital's Value Matters™ | Issue No. 3, 2022|
Mercer Capital's Value Matters™ | Issue No. 3, 2022|Mercer Capital's Value Matters™ | Issue No. 3, 2022|
Mercer Capital's Value Matters™ | Issue No. 3, 2022|
 
Mercer Capital's Value Focus: Transportation & Logistics | Q3 2022
Mercer Capital's Value Focus: Transportation & Logistics  | Q3 2022 Mercer Capital's Value Focus: Transportation & Logistics  | Q3 2022
Mercer Capital's Value Focus: Transportation & Logistics | Q3 2022
 
Mercer Capital's Bank Watch | November 2022 | Community Bank Loan Portfolios ...
Mercer Capital's Bank Watch | November 2022 | Community Bank Loan Portfolios ...Mercer Capital's Bank Watch | November 2022 | Community Bank Loan Portfolios ...
Mercer Capital's Bank Watch | November 2022 | Community Bank Loan Portfolios ...
 
Mercer Capital's Investment Management Industry Newsletter | Q3 2022 | Focus:...
Mercer Capital's Investment Management Industry Newsletter | Q3 2022 | Focus:...Mercer Capital's Investment Management Industry Newsletter | Q3 2022 | Focus:...
Mercer Capital's Investment Management Industry Newsletter | Q3 2022 | Focus:...
 
Mercer Capital's Investment Management Industry Newsletter | Q2 2022 | Segmen...
Mercer Capital's Investment Management Industry Newsletter | Q2 2022 | Segmen...Mercer Capital's Investment Management Industry Newsletter | Q2 2022 | Segmen...
Mercer Capital's Investment Management Industry Newsletter | Q2 2022 | Segmen...
 
Mercer Capital's Bank Watch | October 2022 | How Are Tech-Forward Banks Perfo...
Mercer Capital's Bank Watch | October 2022 | How Are Tech-Forward Banks Perfo...Mercer Capital's Bank Watch | October 2022 | How Are Tech-Forward Banks Perfo...
Mercer Capital's Bank Watch | October 2022 | How Are Tech-Forward Banks Perfo...
 
Mercer Capital's Value Focus: Transportation & Logistics | Q2 2022 | Feature...
Mercer Capital's Value Focus: Transportation & Logistics  | Q2 2022 | Feature...Mercer Capital's Value Focus: Transportation & Logistics  | Q2 2022 | Feature...
Mercer Capital's Value Focus: Transportation & Logistics | Q2 2022 | Feature...
 

Recently uploaded

Banking: Commercial and Central Banking.pptx
Banking: Commercial and Central Banking.pptxBanking: Commercial and Central Banking.pptx
Banking: Commercial and Central Banking.pptxANTHONYAKINYOSOYE1
 
ekthesi-trapeza-tis-ellados-gia-2023.pdf
ekthesi-trapeza-tis-ellados-gia-2023.pdfekthesi-trapeza-tis-ellados-gia-2023.pdf
ekthesi-trapeza-tis-ellados-gia-2023.pdfSteliosTheodorou4
 
OAT_RI_Ep18 WeighingTheRisks_Mar24_GlobalCredit.pptx
OAT_RI_Ep18 WeighingTheRisks_Mar24_GlobalCredit.pptxOAT_RI_Ep18 WeighingTheRisks_Mar24_GlobalCredit.pptx
OAT_RI_Ep18 WeighingTheRisks_Mar24_GlobalCredit.pptxhiddenlevers
 
Financial Preparation for Millennia.pptx
Financial Preparation for Millennia.pptxFinancial Preparation for Millennia.pptx
Financial Preparation for Millennia.pptxsimon978302
 
Uae-NO1 Black Magic Specialist In Lahore Black magic In Pakistan Kala Ilam Ex...
Uae-NO1 Black Magic Specialist In Lahore Black magic In Pakistan Kala Ilam Ex...Uae-NO1 Black Magic Specialist In Lahore Black magic In Pakistan Kala Ilam Ex...
Uae-NO1 Black Magic Specialist In Lahore Black magic In Pakistan Kala Ilam Ex...Amil baba
 
Financial analysis on Risk and Return.ppt
Financial analysis on Risk and Return.pptFinancial analysis on Risk and Return.ppt
Financial analysis on Risk and Return.ppttadegebreyesus
 
Gender and caste discrimination in india
Gender and caste discrimination in indiaGender and caste discrimination in india
Gender and caste discrimination in indiavandanasingh01072003
 
AnyConv.com__FSS Advance Retail & Distribution - 15.06.17.ppt
AnyConv.com__FSS Advance Retail & Distribution - 15.06.17.pptAnyConv.com__FSS Advance Retail & Distribution - 15.06.17.ppt
AnyConv.com__FSS Advance Retail & Distribution - 15.06.17.pptPriyankaSharma89719
 
Kempen ' UK DB Endgame Paper Apr 24 final3.pdf
Kempen ' UK DB Endgame Paper Apr 24 final3.pdfKempen ' UK DB Endgame Paper Apr 24 final3.pdf
Kempen ' UK DB Endgame Paper Apr 24 final3.pdfHenry Tapper
 
What is sip and What are its Benefits in 2024
What is sip and What are its Benefits in 2024What is sip and What are its Benefits in 2024
What is sip and What are its Benefits in 2024prajwalgopocket
 
Crypto Confidence Unlocked: AnyKYCaccount's Shortcut to Binance Verification
Crypto Confidence Unlocked: AnyKYCaccount's Shortcut to Binance VerificationCrypto Confidence Unlocked: AnyKYCaccount's Shortcut to Binance Verification
Crypto Confidence Unlocked: AnyKYCaccount's Shortcut to Binance VerificationAny kyc Account
 
Uae-NO1 Pakistani Amil Baba Real Amil baba In Pakistan Najoomi Baba in Pakist...
Uae-NO1 Pakistani Amil Baba Real Amil baba In Pakistan Najoomi Baba in Pakist...Uae-NO1 Pakistani Amil Baba Real Amil baba In Pakistan Najoomi Baba in Pakist...
Uae-NO1 Pakistani Amil Baba Real Amil baba In Pakistan Najoomi Baba in Pakist...Amil baba
 
Abhay Bhutada Leads Poonawalla Fincorp To Record Growth In FY24
Abhay Bhutada Leads Poonawalla Fincorp To Record Growth In FY24Abhay Bhutada Leads Poonawalla Fincorp To Record Growth In FY24
Abhay Bhutada Leads Poonawalla Fincorp To Record Growth In FY24Champak Jhagmag
 
Building pressure? Rising rents, and what to expect in the future
Building pressure? Rising rents, and what to expect in the futureBuilding pressure? Rising rents, and what to expect in the future
Building pressure? Rising rents, and what to expect in the futureResolutionFoundation
 
Overview of Inkel Unlisted Shares Price.
Overview of Inkel Unlisted Shares Price.Overview of Inkel Unlisted Shares Price.
Overview of Inkel Unlisted Shares Price.Precize Formely Leadoff
 
10 QuickBooks Tips 2024 - Globus Finanza.pdf
10 QuickBooks Tips 2024 - Globus Finanza.pdf10 QuickBooks Tips 2024 - Globus Finanza.pdf
10 QuickBooks Tips 2024 - Globus Finanza.pdfglobusfinanza
 
Uae-NO1 Rohani Amil In Islamabad Amil Baba in Rawalpindi Kala Jadu Amil In Ra...
Uae-NO1 Rohani Amil In Islamabad Amil Baba in Rawalpindi Kala Jadu Amil In Ra...Uae-NO1 Rohani Amil In Islamabad Amil Baba in Rawalpindi Kala Jadu Amil In Ra...
Uae-NO1 Rohani Amil In Islamabad Amil Baba in Rawalpindi Kala Jadu Amil In Ra...Amil baba
 
Money Forward Integrated Report “Forward Map” 2024
Money Forward Integrated Report “Forward Map” 2024Money Forward Integrated Report “Forward Map” 2024
Money Forward Integrated Report “Forward Map” 2024Money Forward
 
Uk-NO1 Amil baba in pakistan Amil Baba in Karachi Black Magic Islamabad Kala ...
Uk-NO1 Amil baba in pakistan Amil Baba in Karachi Black Magic Islamabad Kala ...Uk-NO1 Amil baba in pakistan Amil Baba in Karachi Black Magic Islamabad Kala ...
Uk-NO1 Amil baba in pakistan Amil Baba in Karachi Black Magic Islamabad Kala ...Amil baba
 
Liquidity Decisions in Financial management
Liquidity Decisions in Financial managementLiquidity Decisions in Financial management
Liquidity Decisions in Financial managementshrutisingh143670
 

Recently uploaded (20)

Banking: Commercial and Central Banking.pptx
Banking: Commercial and Central Banking.pptxBanking: Commercial and Central Banking.pptx
Banking: Commercial and Central Banking.pptx
 
ekthesi-trapeza-tis-ellados-gia-2023.pdf
ekthesi-trapeza-tis-ellados-gia-2023.pdfekthesi-trapeza-tis-ellados-gia-2023.pdf
ekthesi-trapeza-tis-ellados-gia-2023.pdf
 
OAT_RI_Ep18 WeighingTheRisks_Mar24_GlobalCredit.pptx
OAT_RI_Ep18 WeighingTheRisks_Mar24_GlobalCredit.pptxOAT_RI_Ep18 WeighingTheRisks_Mar24_GlobalCredit.pptx
OAT_RI_Ep18 WeighingTheRisks_Mar24_GlobalCredit.pptx
 
Financial Preparation for Millennia.pptx
Financial Preparation for Millennia.pptxFinancial Preparation for Millennia.pptx
Financial Preparation for Millennia.pptx
 
Uae-NO1 Black Magic Specialist In Lahore Black magic In Pakistan Kala Ilam Ex...
Uae-NO1 Black Magic Specialist In Lahore Black magic In Pakistan Kala Ilam Ex...Uae-NO1 Black Magic Specialist In Lahore Black magic In Pakistan Kala Ilam Ex...
Uae-NO1 Black Magic Specialist In Lahore Black magic In Pakistan Kala Ilam Ex...
 
Financial analysis on Risk and Return.ppt
Financial analysis on Risk and Return.pptFinancial analysis on Risk and Return.ppt
Financial analysis on Risk and Return.ppt
 
Gender and caste discrimination in india
Gender and caste discrimination in indiaGender and caste discrimination in india
Gender and caste discrimination in india
 
AnyConv.com__FSS Advance Retail & Distribution - 15.06.17.ppt
AnyConv.com__FSS Advance Retail & Distribution - 15.06.17.pptAnyConv.com__FSS Advance Retail & Distribution - 15.06.17.ppt
AnyConv.com__FSS Advance Retail & Distribution - 15.06.17.ppt
 
Kempen ' UK DB Endgame Paper Apr 24 final3.pdf
Kempen ' UK DB Endgame Paper Apr 24 final3.pdfKempen ' UK DB Endgame Paper Apr 24 final3.pdf
Kempen ' UK DB Endgame Paper Apr 24 final3.pdf
 
What is sip and What are its Benefits in 2024
What is sip and What are its Benefits in 2024What is sip and What are its Benefits in 2024
What is sip and What are its Benefits in 2024
 
Crypto Confidence Unlocked: AnyKYCaccount's Shortcut to Binance Verification
Crypto Confidence Unlocked: AnyKYCaccount's Shortcut to Binance VerificationCrypto Confidence Unlocked: AnyKYCaccount's Shortcut to Binance Verification
Crypto Confidence Unlocked: AnyKYCaccount's Shortcut to Binance Verification
 
Uae-NO1 Pakistani Amil Baba Real Amil baba In Pakistan Najoomi Baba in Pakist...
Uae-NO1 Pakistani Amil Baba Real Amil baba In Pakistan Najoomi Baba in Pakist...Uae-NO1 Pakistani Amil Baba Real Amil baba In Pakistan Najoomi Baba in Pakist...
Uae-NO1 Pakistani Amil Baba Real Amil baba In Pakistan Najoomi Baba in Pakist...
 
Abhay Bhutada Leads Poonawalla Fincorp To Record Growth In FY24
Abhay Bhutada Leads Poonawalla Fincorp To Record Growth In FY24Abhay Bhutada Leads Poonawalla Fincorp To Record Growth In FY24
Abhay Bhutada Leads Poonawalla Fincorp To Record Growth In FY24
 
Building pressure? Rising rents, and what to expect in the future
Building pressure? Rising rents, and what to expect in the futureBuilding pressure? Rising rents, and what to expect in the future
Building pressure? Rising rents, and what to expect in the future
 
Overview of Inkel Unlisted Shares Price.
Overview of Inkel Unlisted Shares Price.Overview of Inkel Unlisted Shares Price.
Overview of Inkel Unlisted Shares Price.
 
10 QuickBooks Tips 2024 - Globus Finanza.pdf
10 QuickBooks Tips 2024 - Globus Finanza.pdf10 QuickBooks Tips 2024 - Globus Finanza.pdf
10 QuickBooks Tips 2024 - Globus Finanza.pdf
 
Uae-NO1 Rohani Amil In Islamabad Amil Baba in Rawalpindi Kala Jadu Amil In Ra...
Uae-NO1 Rohani Amil In Islamabad Amil Baba in Rawalpindi Kala Jadu Amil In Ra...Uae-NO1 Rohani Amil In Islamabad Amil Baba in Rawalpindi Kala Jadu Amil In Ra...
Uae-NO1 Rohani Amil In Islamabad Amil Baba in Rawalpindi Kala Jadu Amil In Ra...
 
Money Forward Integrated Report “Forward Map” 2024
Money Forward Integrated Report “Forward Map” 2024Money Forward Integrated Report “Forward Map” 2024
Money Forward Integrated Report “Forward Map” 2024
 
Uk-NO1 Amil baba in pakistan Amil Baba in Karachi Black Magic Islamabad Kala ...
Uk-NO1 Amil baba in pakistan Amil Baba in Karachi Black Magic Islamabad Kala ...Uk-NO1 Amil baba in pakistan Amil Baba in Karachi Black Magic Islamabad Kala ...
Uk-NO1 Amil baba in pakistan Amil Baba in Karachi Black Magic Islamabad Kala ...
 
Liquidity Decisions in Financial management
Liquidity Decisions in Financial managementLiquidity Decisions in Financial management
Liquidity Decisions in Financial management
 

Mercer Capital's Value Focus: Convenience Store Industry | Month Year | Segment: Grocery Stores

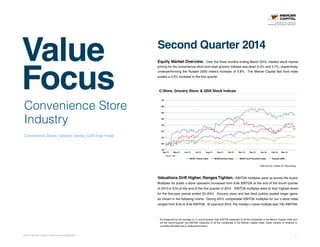
  • 1. Value Focus © 2014 Mercer Capital // www.mercercapital.com 1 Convenience Store Industry Convenience Stores | Grocery Stores | QSR (Fast Food) Second Quarter 2014 Equity Market Overview. Over the three months ending March 2014, median stock market pricing for the convenience store and retail grocery indexes was down 5.0% and 4.7%, respectively, underperforming the Russell 2000 index’s increase of 0.8%. The Mercer Capital fast food index posted a 3.0% increase in the first quarter. Valuations Drift Higher, Ranges Tighten. EBITDA multiples were up across the board. Multiples for public c-store operators increased from 8.8x EBITDA at the end of the fourth quarter of 2013 to 9.0x at the end of the first quarter of 2014. EBITDA multiples were at their highest levels for the five-year period ended Q1-2014. Grocery store and fast food publics posted larger gains, as shown in the following charts. During 2013, comparable EBITDA multiples for our c-store index ranged from 8.0x to 8.8x EBITDA. At year-end 2012, the median c-store multiple was 7.8x EBITDA. C-Store, Grocery Store, & QSR Stock Indices 90 100 110 120 130 140 150 160 170 Apr-13 May-13 Jun-13 Jul-13 Aug-13 Sep-13 Oct-13 Nov-13 Dec-13 Jan-14 Feb-14 Mar-14 MCM C-Store Index MCM Grocery Index MCM Food Franchise Index Russell 2000 4/1/13  =  100   Data Source: Capital IQ / Bloomberg BUSINESS VALUATION & FINANCIAL ADVISORY SERVICES 1 As measured by the average of (1) end-of-quarter high EBITDA measures of all the companies in the Mercer Capital index and (2) the end-of-quarter low EBITDA measures of all the companies in the Mercer Capital index. Travel Centers of America is currently excluded due to underperformance.
  • 2. © 2014 Mercer Capital // www.mercercapital.com 2 Mercer Capital’s Value Focus: Convenience Store Industry Second Quarter 2014 3 4 5 6 7 8 9 10 Q1 2009 Q2 Q3 Q4 Q1 2010 Q2 Q3 Q4 Q1 2011 Q2 Q3 Q4 Q1 2012 Q2 Q3 Q4 Q1 2013 Q2 Q3 Q4 Q1 2014 Mid-Point 3 4 5 6 7 8 9 10 Q1 2009 Q2 Q3 Q4 Q1 2010 Q2 Q3 Q4 Q1 2011 Q2 Q3 Q4 Q1 2012 Q2 Q3 Q4 Q1 2013 Q2 Q3 Q4 Q1 2014 Mid-Point C-Store EBITDA Valuations // Quarterly Range of Mean Highs & Lows Grocery Store EBITDA Valuations // Quarterly Range of Mean Highs & Lows Data Source: Bloomberg Data Source: Bloomberg
  • 3. © 2014 Mercer Capital // www.mercercapital.com 3 Mercer Capital’s Value Focus: Convenience Store Industry Second Quarter 2014 Margins. Nationwide retail gasoline margins ended the quarter at 15.4 cents per gallon, down from 19.3 cents per gallon in the first week of the first quarter, but in line with the historical five-year average. According to OPIS, gasoline prices are currently supported by a low supply, especially in the Southeastern United States, while gasoline demand is on the rise. Diesel margins have rallied, ending the quarter at 30.9 cents per gallon. Diesel margins during the first week of the first quarter were 26.3 cents per gallon. A wide separation between gasoline and diesel profits exists across many regions of the country. Many U.S. refineries will complete annual maintenance in the second quarter, and the increase in gasoline supply should push pricing down and support strong margins. Generally, over 70% of a c-store’s sales are motor fuels; however, fuel contributes only one-third of total convenience store gross margin dollars. Fuel margins have been consistent on an annual basis, averaging 16.9 cents per gallon for 2008 through 2012.2 There is a delay between the time crude prices increase and the time that pump prices rise. This lag also occurs when wholesale prices drop. Retailers tend to reduce their markups when costs are escalating. Conversely, when costs are declining, retailers tend to leave their pump prices elevated – leading to increased fuel margins – until competition forces pump pricing downward. The time lag between cost changes and retail price adjustments as well as the duration of cost trends is a significant influencer of the operator’s margin. On average, it costs retailers approximately 12 to 16 cents to dispense a gallon of fuel. Given that the average five-year markup on gasoline was 16.9 cents, this translates to a typical two to three cents per gallon of bottom line profit. Fast Food (QSR) EBITDA Valuations // Quarterly Range of Mean Highs & Lows 3 5 7 9 11 13 15 Q1 2009 Q2 Q3 Q4 Q1 2010 Q2 Q3 Q4 Q1 2011 Q2 Q3 Q4 Q1 2012 Q2 Q3 Q4 Q1 2013 Q2 Q3 Q4 Q1 2014  Mid-­‐Point   Data Source: Bloomberg 2 2013 margin average is forthcoming but not yet available at the time of this publication.
  • 4. © 2014 Mercer Capital // www.mercercapital.com 4 Mercer Capital’s Value Focus: Convenience Store Industry Second Quarter 2014 Tobacco Products. Tobacco products comprised 37% of in-store sales during 2013 and accounted for only 18.7% of gross margin, according to the NACS. Dollar sales dipped 3.5% in 2013, and unit sales dropped 2.1%. Tobacco sales are the largest inside product category for c stores. Many industry insiders are predicting the OTP (other tobacco products) category to overtake cigarettes in the next few years. The OTP category includes e-cigarettes, vapor tobacco products, cigars, and smokeless tobacco. It will take some time for this to occur, as OTP sales averaged $6,479 per month per store as compared to sales of $44,751 for cigarettes. However, e-cigarettes posted the strongest growth as a percentage of dollar sales among all c-store product categories, a nearly 177% increase during 2013. Taxation remains the biggest challenge to selling cigarettes, and there is a large degree of regulatory uncertainty where the OTP category is concerned. The FDA is focused on new regulations (or even a ban) on menthol in tobacco products, the decision to increase the legal age of tobacco purchase to 21 or 25, and new regulations for cigars, pipe tobacco, electronic cigarettes and/or hookah tobacco. CVS drug stores are expected to give up $2 billion in tobacco sales as the company exited the category during the quarter. Military exchanges are considering a ban on tobacco sales as well. Highway Trust Fund. The Highway Trust Fund (“HTF”) was created by the federal government in 1956 to pay for highway construction and maintenance. It is funded by an 18.3 cent per gallon federal tax on gasoline and a 24.4 cent per gallon tax on diesel. These levels have not changed since 1993. Since then, the cost of road construction and maintenance has gone up, and these taxes have lost more than 40% of their purchasing power, according to the Institute on Taxation and Economic Policy. Over that same time, vehicles have become more fuel efficient, reducing the total number of gallons purchased and taxes collected per vehicle. A $100 million shortfall is anticipated for the HTC in the third quarter of 2014. Several proposed remedies include: »» An increase in the cents per gallon tax rate, or indexing the tax to inflation; »» A mileage-based user fee whereby a recorder would be installed in a vehicle to log miles traveled and report them back to the appropriate taxing authority; »» A tax on alternative fuel vehicles; »» Raising U.S. taxes on companies’ overseas earnings; or »» Rescinding the restriction on tolling federal interstates. The U.S. Transportation Secretary estimates 700,000 jobs are at risk if the HTF is allowed to become insolvent. This could represent a concern for c-store operators as construction workers are often a key customer segment. However, an increase in the gasoline tax could negatively impact the volume of c-store gallons sold.
  • 5. © 2014 Mercer Capital // www.mercercapital.com 5 Mercer Capital’s Value Focus: Convenience Store Industry Second Quarter 2014 Recent M&A Activity Given that terms were not disclosed relating to these transactions, we are not able to derive valuation multiples. However, industry insiders are noticing a trend of improving multiples and increased activity. This is expected to continue in 2014. Factors contributing to higher multiples include the increase of willing lenders to finance transactions at relatively low rates, the increase of tax-advantaged MLPs and spinoffs, and higher demand for properties in urban centers and smaller format stores. Experts indicate that while multiples a few years ago were in the 5x - 6x EBITDA range, recent deals have been in the 7x - 8x range. »» Pantry’s group of dissident shareholders was ultimately successful in placing their chosen nominees to the board of directors. This may have an influence on the direction of the company in the near term. »» Several major brands announced significant divestiture programs during the first three months of the year after conducting analyses of their real estate portfolios. CST Brands, Inc. plans to sell approximately 100 stores, 7-Eleven, Inc. is divesting 72 stores, and Getty Realty Corporation is selling 50 stores. »» Hess Retail Corp. gained approval for a spinoff in early 2014, which is expected to be completed by the middle of the year. Immediately prior to the release of this publication (May 22, 2014), Hess announced its intention to sell the recently spun-off retail operations to Marathon Petroleum for $2.6 billion, ending months of speculation regarding the future of the Hess c-stores. The Hess c-store chain consists of over 1,300 locations and will make Marathon one of the largest owners and operators of c-stores in the U.S. with locations in 23 states. »» Casey’s General Stores signed an asset purchase agreement to acquire 24 Stop-n-Go locations in North Dakota and Minnesota, as it looks to expand in the Upper Midwest. The stores are expected to be rebranded upon repurchase. »» The spin-off trend continues as Western Refining Inc. and Northern Tier Energy LP discussed the possibility of combining and spinning off their respective gas station and convenience store networks into a standalone company. This conversation took place in the first joint earnings call following Western Refining’s purchase of 38.7% of Northern Tier Energy LP from ACON Investments and TPG, two private equity firms. While this transaction was primarily a refining play, it includes the SuperAmerica retail chain consisting of 163 company-operated c-stores and 74 franchised locations. Western Refining has 229 gas stations and c-stores.
  • 6. © 2014 Mercer Capital // www.mercercapital.com 6 Mercer Capital’s Value Focus: Convenience Store Industry Second Quarter 2014 Grocery Stores Segment Focus The Supermarkets and Grocery Stores industry makes up the largest food retail channel in the United States. Industry revenue totaled approximately $574.1 billion in 2013, and profit was $9.2 billion. The following chart presents the products and services segmentation for the industry as estimated for 2014 by IBISWORLD. This industry has grown over the past five years, benefitting from a strengthening economy and the trend toward organic and all-natural brands. However, the industry is mature, and revenue is expected to grow at a rate below national GDP over the next five years (1.5%, annualized). The top four operators account for roughly 30% of industry revenue. Competition from superstores and warehouse clubs intensified during the recent recession, and remains high. As shown below, other sector operators enjoy modestly lower costs than grocery store retailers.
  • 7. © 2014 Mercer Capital // www.mercercapital.com 7 Mercer Capital’s Value Focus: Convenience Store Industry Second Quarter 2014 The industry continues to consolidate, and merger and acquisition activity has been high in recent quarters. The Kroger Co., the largest pure player in the industry, merged with Harris Teeter Supermarkets in a cash transaction valued at $2.5 billion in order to boost its market share. This represents a multiple of 7.9x EBITDA.Safeway, with a 6.4% market share, announced a definitive merger agreement in March 2014 with Albertsons LLC. Albertsons is expected to purchase the struggling Safeway for $9.2 billion, a multiple of 5.5x EBITDA. Such transactions allow for retailers to lower per-unit costs through economies of scale.
  • 8. © 2014 Mercer Capital // www.mercercapital.com 8 Mercer Capital’s Value Focus: Convenience Store Industry Second Quarter 2014 The grocery store industry has been facing increasing competition from superstores and discount warehouse clubs, such as Wal- Mart. According to Wal-Mart’s 10-K for the fiscal year ended January 31, 2014, grocery segment revenues were 56% of total company revenues. This translates to roughly $264 billion in grocery-related company revenue, making Wal-Mart the nation’s largest grocery retailer.1 It is estimated that 25% of America’s grocery budget is spent at Wal-Mart. 1 Grocery is defined as “grocery items, including meat, produce, deli, bakery, dairy, frozen foods, alcoholic and nonalcoholic beverages, floral and dry grocery, as well as consumables such as health and beauty aids, baby products, household chemicals, paper goods, and pet supplies.”
  • 9. © 2014 Mercer Capital // www.mercercapital.com 9 Mercer Capital’s Value Focus: Convenience Store Industry Second Quarter 2014 Fuel Pricing and Supply Charts Fuel Prices & Supply $0.00   $0.50   $1.00   $1.50   $2.00   $2.50   $3.00   $3.50   $4.00   $4.50   $5.00   $20   $40   $60   $80   $100   $120   $140   $160   Apr-­‐08   Jul-­‐08   Oct-­‐08   Jan-­‐09   Apr-­‐09   Jul-­‐09   Oct-­‐09   Jan-­‐10   Apr-­‐10   Jul-­‐10   Oct-­‐10   Jan-­‐11   Apr-­‐11   Jul-­‐11   Oct-­‐11   Jan-­‐12   Apr-­‐12   Jul-­‐12   Oct-­‐12   Jan-­‐13   Apr-­‐13   Jul-­‐13   Oct-­‐13   Jan-­‐14   Price/Gallon  Price/Barrel   WTI   Brent   Gasoline   Diesel   Data Source: Calculated by Mercer Capital based on raw data obtained from the US Energy Information Administration (EIA.gov)
  • 10. © 2014 Mercer Capital // www.mercercapital.com 10 Mercer Capital’s Value Focus: Convenience Store Industry Second Quarter 2014 Motor Fuel and Brent Crude Price Fluctuation -­‐0.2   -­‐0.15   -­‐0.1   -­‐0.05   0   0.05   0.1   0.15   0.2   0.25   Apr-­‐08   Aug-­‐08   Dec-­‐08   Apr-­‐09   Aug-­‐09   Dec-­‐09   Apr-­‐10   Aug-­‐10   Dec-­‐10   Apr-­‐11   Aug-­‐11   Dec-­‐11   Apr-­‐12   Aug-­‐12   Dec-­‐12   Apr-­‐13   Aug-­‐13   Dec-­‐13   Price     Vola9lity   Gasoline   Brent   Diesel   Data Source: Calculated by Mercer Capital based on raw data obtained from the US Energy Information Administration (EIA.gov) Fuel Pricing and Supply Charts
  • 11. © 2014 Mercer Capital // www.mercercapital.com 11 Mercer Capital’s Value Focus: Convenience Store Industry Second Quarter 2014 Prime Supplier Sales Volumes  -­‐          50,000      100,000      150,000      200,000      250,000      300,000      350,000      400,000     Gas  Diesel   Gas  Diesel   Gas  Diesel   Gas  Diesel   Gas  Diesel   Gas  Diesel   Gas  Diesel   Gas  Diesel   Gas  Diesel   Gas  Diesel   Gas  Diesel   Gas  Diesel   Gas  Diesel   Gas  Diesel   Gas  Diesel   Gas  Diesel   Gas  Diesel   Gas  Diesel   2009               2010             2011   2012             2013             Feb   '13             Mar   '13             Apr   '13             May   '13             June   '13             July   '13             Aug   '13             Sept   '13             Oct   '13             Nov   '13             Dec   '13             Jan   '14             Feb   '14   000's  Gallons/Day   Regular   Mid-­‐Grade   Premium   Diesel   Data Source: US Energy Information Administration (EIA.gov) Fuel Pricing and Supply Charts
  • 12. © 2014 Mercer Capital // www.mercercapital.com 12 Mercer Capital’s Value Focus: Convenience Store Industry Second Quarter 2014 Data Source: Calculated by Mercer Capital based on raw data obtained from the US Energy Information Administration (EIA.gov) Fuel Pricing and Supply Charts Percentage Change in Non-Motor Fuel Spread by MonthNon-Motor Fuel Prices $0.00   $0.50   $1.00   $1.50   $2.00   $2.50   $3.00   $3.50   $4.00   $4.50   Oct-­‐08   M ar-­‐09   Aug-­‐09   Jan-­‐10   Jun-­‐10   Nov-­‐10   Apr-­‐11   Sep-­‐11   Feb-­‐12   Jul-­‐12   Dec-­‐12   M ay-­‐13   Oct-­‐13   M ar-­‐14   Price/Gallon No. 2 Heating Oil Propane -­‐100%   -­‐50%   0%   50%   100%   150%   200%   Jan-­‐14   Jan-­‐14   Jan-­‐14   Jan-­‐14   Feb-­‐14   Feb-­‐14   Feb-­‐14   Feb-­‐14   M ar-­‐14   M ar-­‐14   M ar-­‐14   %  +/-­‐  in  Hea5ng  Oil  Spread   %  +/-­‐  Inc/Dec  in  Propane  Spread   Data Source: US Energy Information Administration (EIA.gov)
  • 13. Mercer Capital Convenience Store Industry Services Contact Us Copyright © 2014 Mercer Capital Management, Inc. All rights reserved. It is illegal under Federal law to reproduce this publication or any portion of its contents without the publisher’s permission. Media quotations with source attribution are encouraged. Reporters requesting additional information or editorial comment should contact Barbara Walters Price at 901.685.2120. Mercer Capital’s Industry Focus is published quarterly and does not constitute legal or financial consulting advice. It is offered as an information service to our clients and friends. Those interested in specific guidance for legal or accounting matters should seek competent professional advice. Inquiries to discuss specific valuation matters are welcomed. To add your name to our mailing list to receive this complimentary publication, visit our web site at www.mercercapital.com. Mercer Capital provides the multi-unit retailing and QSR industries with corporate valuation, financial reporting, transaction advisory, and related services. Industry Segments Mercer Capital serves the following industry segments: • Convenience stores • Grocery stores • Fast food (QSR) • Travel Centers Mercer Capital Experience • Family and management succession planning • Buy-side and sell-side transaction advisory assistance • Conflict resolution and litigation support • Trust and estate planning • Buy-sell agreement valuation, design, and funding advisory Eden G. Stanton, CFA 901.270.7250 stantone@mercercapital.com Timothy R. Lee, ASA 901.322.9740 leet@mercercapital.com Mercer Capital 5100 Poplar Avenue, Suite 2600 Memphis, Tennessee 38137 901.685.2120 (P) www.mercercapital.com BUSINESS VALUATION & FINANCIAL ADVISORY SERVICES