Air pollution trends and tools in Catalonia
•
0 likes•17 views

Presentació d'. Albert Soret. Líder del grup Earth System Services del Barcelona Supercomputing Centre, a la jornada de presentació de l’Informe sobre l’estat del medi ambient 2016 – 2019, organitzada pel Departament d’Acció Climàtica, Alimentació i Agenda Rural i amb la col·laboració del Consell Assessor per al Desenvolupament Sostenible de Catalunya (CADS).

Recommended
Recommended
More Related Content
Similar to Air pollution trends and tools in Catalonia
Similar to Air pollution trends and tools in Catalonia (20)
More from Medi Ambient. Generalitat de Catalunya
More from Medi Ambient. Generalitat de Catalunya (20)
Recently uploaded
Recently uploaded (20)
Air pollution trends and tools in Catalonia
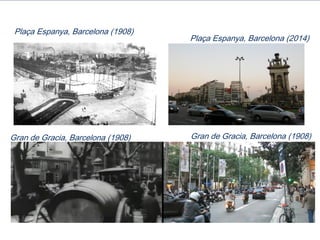
- 1. Plaça Espanya, Barcelona (1908) Plaça Espanya, Barcelona (2014) Gran de Gracia, Barcelona (1908) Gran de Gracia, Barcelona (1908)
- 2. Qualitat de l’aire i Ies eines de les que disposem per a la seva gestió Albert Soret 25/11/2022 Informe sobre l'Estat del Medi Ambient a Catalunya. Període 2016 - 2019
- 3. Air pollution Air pollution can be defined as atmospheric conditions in which air pollutants are present at concentrations higher than their normal levels to produce measurable adverse effects on humans, animals, vegetation or materials (Seinfeld and Pandis, 1998). Tiananmen square
- 4. Processes Emission (anthropogenic and natural): production and release of pollutants into the atmosphere by emitting sources. Transport and transformation of pollutants into the atmosphere. Pollutants are dispersed and are affected by weather factors, terrain relief, etc. They suffer from chemical reactions that modify their composition and create new pollutants. Source: U.S. Fish and Wildlife Service
- 5. Anthropogenic emissions trends NOx emissions in the EU. Share by sector 2019 (EEA, 2021) NOx emissions in the EU. Sectorial trends (EEA, 2021)
- 6. Population exposure, impacts on health and air quality legislation Health impacts of air pollution (EEA, 2019) Source: EEA, 2020
- 8. Comparison between the periods 2011–2015 and 2016–2019 The three most critical atmospheric pollutants in Catalonia are NO2, PM10 and O3. The air quality zones of Barcelona and Vallès- Baix Llobregat (ZQA 1 and 2) present the highest concentrations of NO2. Regarding PM10, the highest values are observed in ZQ6. In general, however, it is observed how these pollutants remain stable or with a particular downward trend in these areas, and in Catalonia as a whole. O3, on the other hand, does not show a clear trend in either period.
- 9. NO2
- 10. PM10 During these years the annual limit value was not exceeded; however, the daily limit value was exceeded in ZQA 6 (Plana de Vic and Manlleu stations in certain days).
- 11. O3
- 12. Key aspects that have happened since 2019
- 13. The COVID-19 related emission reduction and decreased air pollution in Europe
- 14. The COVID-19 related emission reduction and decreased air pollution in Europe
- 15. The COVID-19 related emission reduction and decreased air pollution in Europe Mitjana anual de diòxid de nitrogen. Estat de la qualitat de l’aire a Catalunya - Anuari 2021
- 16. WHO guidelines vs to EU standards The EU air quality standards are less strict for all pollutants than the new health- based air quality guidelines that were published by the WHO in 2021. In 2019, the majority of the urban population in the EU was exposed to levels of key air pollutants that damage health. In particular, 97% of the urban population was exposed to concentrations of fine particulate matter (PM2.5) above the new WHO guideline level of 5 µg/m3. Annual WHO 2021 Annual EC/50/2008
- 17. WHO guidelines vs to EU standards The EU air quality standards are less strict for all pollutants than the new health- based air quality guidelines that were published by the WHO in 2021. In 2019, the majority of the urban population in the EU was exposed to levels of key air pollutants that damage health. In particular, 97% of the urban population was exposed to concentrations of fine particulate matter (PM2.5) above the new WHO guideline level of 5 µg/m3. Share of the EU urban population exposed to air pollutant concentrations above EU standards and WHO guidelines in 2019
- 18. Revision of the EU Ambient Air Quality Directives • To define common methods for air quality monitoring and assessment “…Member States must establish a network of measurement stations and sampling points based on common criteria as regards the determination of the minimum number of sampling points, data quality, unacceptable uncertainty in monitoring and modelling, …“ • To set standards to be achieved across the EU • To ensure that air quality information is made available to the public • To maintain good air quality and improve it where it is not good enough
- 20. Air quality modelling Fixed sampling points in Europe are situated at different types of stations following rules for macro- and micro-scale-siting. Eixample station
- 21. Earth observations The spatial gaps of ground monitoring resources are inevitable, and satellite data are able to fill in air quality information in areas without a ground monitor. There are numerous satellite data that can indicate criteria air pollutants (e.g., PM2.5 and NO2) and greenhouse gases (e.g., CH4 and CO2). Tropomi (Sentinel 5) will map a multitude of trace gases such as nitrogen dioxide, ozone, formaldehyde, sulphur dioxide, methane, carbon monoxide and aerosols.
- 23. Air quality modelling CALIOPE Urban air quality forecast system
- 24. Applications and Impact Past events Forecast Planning
- 25. Applications and Impact Past events Forecast Planning
- 26. Applications and Impact Past events Forecast Planning
- 27. Applications and Impact Past events Forecast Planning Past events Forecast Planning
- 28. Applications and Impact Past events Forecast Planning Past events Forecast Planning Past events Forecast Planning Diagnostic analysis of Santa Cruz de Tenerife NO2 maxh reductions: 25 - 30 µg m-3 8-16% PM10 maxh reductions: < 8 µg m-3 2-5% Fleet electrification