Building Interactive Systems for Social Good [Job Talk]

Abstract The number of internet-of-things (IoT) connected devices is increasing daily, providing new opportunities for information access and interactivity. This talk will focus on work developing low-cost, IoT systems for social good using a user-centered design approach with a focus on applications in the built environment. We will discuss how such systems can empower end-users through access to new information, provide services that alleviate their daily challenges, and discuss future directions for these increasingly ubiquitous technologies. Bio: Matthew Louis Mauriello is a postdoctoral scholar at Stanford University. He holds a Ph.D. in Computer Science from the University of Maryland, where he was advised by Jon E. Froehlich, and an M.S./B.S. in Computer Science and Applied Mathematics from the State University of New York at Albany. His research in the area of Human-Computer Interaction (HCI) focuses on applying user-centered design and computer science techniques to social good problems, emphasizing those facing our health, education, environmental, and computing systems. His work has been published in top-tier venues for HCI and Ubiquitous Computing with several receiving awards for being in the top 5% of submissions at venues including the international SIGCHI Conference on Human Factors in Computing Systems (CHI)—the premier venue for HCI research.

Recommended
Recommended
More Related Content
What's hot
What's hot (14)
Similar to Building Interactive Systems for Social Good [Job Talk]
Similar to Building Interactive Systems for Social Good [Job Talk] (20)
Recently uploaded
Recently uploaded (20)
Building Interactive Systems for Social Good [Job Talk]
- 1. Building Interactive Systems for Social Good Matthew Louis Mauriello | Postdoctoral Scholar | Stanford University makeability lab University of Delaware | February 19, 2020
- 5. Over 30 Billion Internet of Things (IoT) connected devices on the planet (Statista, 2016)
- 6. How can we use IoT for Social Good?
- 7. How can we use IoT for Social Good? Providing some benefit to the general public often in areas like environmental sustainability, education, and healthcare…
- 8. An approach to interactive systems development that aims to make systems usable and useful by focusing on the users, their needs and requirements, and by applying human factors, usability knowledge, and design techniques. This approach enhances effectiveness and efficiency, improves human well- being, user satisfaction, accessibility and sustainability; and counteracts possible adverse effects of use on e.g. human health, safety and performance. HUMAN-CENTERED DESIGN
- 9. An approach to interactive systems development that aims to make systems usable and useful by focusing on the users, their needs and requirements, and by applying human factors, usability knowledge, and design techniques. This approach enhances effectiveness and efficiency, improves human well- being, user satisfaction, accessibility and sustainability; and counteracts possible adverse effects of use on e.g. human health, safety and performance. ISO 9241-210:2010(E) HUMAN-CENTERED DESIGN
- 10. HUMAN-CENTERED DESIGN Design Build Evaluate An approach to interactive systems development that aims to make systems usable and useful by focusing on the users, their needs and requirements, and by applying human factors, usability knowledge, and design techniques. This approach enhances effectiveness and efficiency, improves human well- being, user satisfaction, accessibility and sustainability; and counteracts possible adverse effects of use on e.g. human health, safety and performance. ISO 9241-210:2010(E)
- 12. BUILDING INTERACTIVE SYSTEMS Energy Efficiency (Surfacing Information) Indoor Navigation (Services On-demand)
- 13. BUILDING INTERACTIVE SYSTEMS Energy Efficiency (Surfacing Information) Indoor Navigation (Services On-demand)
- 14. An Easy-to-Deploy Temporal Thermography System Energy Efficiency [UbiComp‘14, CHI’15 *Honorable Mention*, CHI’16, CHI’17, UbiComp’17, MobileHCI’18, CHI’19]
- 16. Common reasons for building inefficiencies include their design, materials, and age. To address these issues, renovations and retrofits of existing building stock has become a pressing need. The US Department of Energy (DOE), for example, has set a goal of reducing housing energy use by up to 70%. Norberg-Bohm, V. and White, C. Building America Program Evaluation. 2004
- 20. 1-3% of residential buildings are audited each year. Common recommendations: • Sealing air leaks • Adding insulation • Improving lighting • Increasing efficiency of appliances Including thermal imagery in reports increases the likelihood of implementing recommendations. The Energy Efficiency Information Gap Palmer et al. 2013
- 21. Energy audits and thermographic surveying are time and labor intensive 21
- 22. Novice Thermography Studies CHI’16, CHI’17 Professional Thermography Studies UbiComp’14, CHI’15 Temporal Thermography UbiComp’17, CHI’19 EXAMINING BUILDING THERMOGRAPHY Energy Efficiency
- 23. EXAMINING BUILDING THERMOGRAPHY Energy Efficiency Novice Thermography Studies CHI’16, CHI’17 Professional Thermography Studies UbiComp’14, CHI’15 Temporal Thermography UbiComp’17, CHI’19
- 25. What challenges do novice users encounter and what benefits do they perceive about using thermal cameras for DIY audits? NOVICE SMARTPHONE FIELD STUDY: RESEARCH QUESTION Mauriello, M.L., Saha, M., Brown, E., and Froehlich, J.E., (2017). "Exploring novice approaches to smartphone-based thermographic energy auditing: a field study." In Proceedings of ACM CHI 2017 Conference on Human Factors in Computing Systems
- 26. NOVICE STUDY METHOD: PARTICIPANTS 10 Participants (5 Female) Avg. Age: 37.7 Years Avg. Green: 6.7 (7pt Likert)
- 28. NOVICE STUDY METHOD: AUDIT TASKS (MISSIONS) “Investigate your home with your thermal camera for signs of energy inefficiencies; collect at least 25 photos that highlight aspects of your investigation.”
- 29. Pre-Study Questionnaire Thermography “Mission” Introduction Meeting Survey NOVICE STUDY METHOD: FIELD STUDY PROCEDURE
- 30. Pre-Study Questionnaire Thermography “Mission” Survey Introduction Meeting 4 Weeks NOVICE STUDY METHOD: FIELD STUDY PROCEDURE
- 31. Pre-Study Questionnaire Thermography “Mission” Semi-Structured Interview Survey Introduction Meeting NOVICE STUDY METHOD: FIELD STUDY PROCEDURE
- 32. NOVICE STUDY METHOD: SEMI-STRUCTURED INTERVIEW + PHOTO-ELICITATION “It was pretty clear to me that the air seals around this door were not doing a very good job of preventing cold air from leaking into this room.” -P3
- 33. I qualitatively coded the survey, interview, and image data to uncover themes. NOVICE STUDY METHOD: DATA ANALYSIS
- 34. NOVICE STUDY FINDINGS: FIELD ACTIVITIES
- 38. “I was stunned to realize that my monitor doesn't completely turn off when it goes to sleep. It was unused for the weekend but still appeared hot [when I came back to work]. So I turned it off when I went to lunch…” –P4
- 39. NOVICE STUDY FINDINGS: SEMI-STRUCTURED INTERVIEWS Participants thought that the benefits of their application of thermography included: • All participants (10) considered the thermal camera a valuable investigative tool. Potential Benefits
- 40. NOVICE STUDY FINDINGS: SEMI-STRUCTURED INTERVIEWS Participants thought that the benefits of their application of thermography included: • All participants (10) considered the thermal camera a valuable investigative tool. • Most (8) suggested that thermal imagery could provide supporting evidence for decisions makers with respect to making retrofit decisions. Potential Benefits
- 42. “I’ve been meaning to contact my landlord with these images and say, look, there seems to be a clear issue here that I think you should address.” -P7
- 43. Participants frequently discussed challenges associated with their ability to interpret issues they discovered: • All participants (10) described imagery they did not understand. NOVICE STUDY FINDINGS: SEMI-STRUCTURED INTERVIEWS Interpretative Issues
- 44. Participants frequently discussed challenges associated with their ability to interpret issues they discovered: • All participants (10) described imagery they did not understand. • Most (8) believed that their ability to interpret thermographic images was limited by lack of knowledge (e.g., unfamiliar building systems). NOVICE STUDY FINDINGS: SEMI-STRUCTURED INTERVIEWS Interpretative Issues
- 45. Participants frequently discussed challenges associated with their ability to interpret issues they discovered: • All participants (10) described imagery they did not understand. • Most (8) believed that their ability to interpret thermographic images was limited by lack of knowledge (e.g., unfamiliar building systems). • Over half (6) found it difficult to determine the significance of issue. NOVICE STUDY FINDINGS: SEMI-STRUCTURED INTERVIEWS Interpretative Issues
- 47. “I don't know how much this really affects the energy use of my apartment.” -P2
- 48. NOVICE STUDY CONCLUSION: RESEARCH OUTCOMES Characterize novice use of thermal cameras for building energy auditing activities Highlights perceived benefits—such as being able to investigate and collect supporting evidence about efficiency issues Outlines primary barriers including difficulty determining: • Missing areas of knowledge • Severity of problems found • What actions to take
- 49. Novice Thermography Studies CHI’16, CHI’17 Professional Thermography Studies UbiComp’14, CHI’15 Temporal Thermography UbiComp’17, CHI’19 EXAMINING BUILDING THERMOGRAPHY Energy Efficiency
- 50. Novice Thermography Studies CHI’16, CHI’17 Professional Thermography Studies UbiComp’14, CHI’15 Temporal Thermography UbiComp’17, CHI’19 Energy Efficiency EXAMINING BUILDING THERMOGRAPHY
- 51. Mauriello, M.L., and Froehlich, J.E., (2014). "Towards automated thermal profiling of buildings at scale using unmanned aerial vehicles and 3D-reconstruction." In Proceedings of the 2014 ACM international Joint Conference on Pervasive and Ubiquitous Computing. Adjunct Publication.
- 53. How can we scale thermographic assessments? Data Collection from Unmanned Aerial Vehicles (Laguela et. al, 2009)
- 54. How can we scale thermographic assessments? Energy Auditing Backpack (Oreifej et al. 2014)
- 55. How can we scale thermographic assessments? Car Mounted Thermographic Cameras (Essess Inc., 2013)
- 56. How can we scale thermographic assessments? High Fidelity Model Generation
- 57. Previtali et al.,Applied Geomatics’14 Bormann et al., Adv. Eng. Informatics’14 Laguela et al., Q. Infrared Thermography’14 Laguela et al., Energy and Buidlings’14 Previtali et al., J. Mobile Multimedia’14 Hamet al., Adv. Eng. Informatics’13 Vidas et al., IEEE Sensors’14 Wang et al., J. Comp. Civil Engineering’13 Ham et al., J. Comp. Civil Engineering’14 Demisse et al., Intl. Conf. Adv. Robotics’13 NO HUMAN PERSPECTIVE IN AUTOMATED THERMOGRAPHY LITERATURE Reviewed over 30 papers in ‘automated thermography.’ No user studies, no investigations of how human auditors may use or perceive emerging systems, no discussions of human-centered design, etc.
- 58. How is thermography currently being used by professional energy auditors? And, what benefits and drawbacks do they identify with automated thermographic data collection? PROFESSIONAL THERMOGRAPHY STUDY: RESEARCH QUESTIONS Mauriello, M.L., Norooz, L., and Froehlich, J.E., (2015). "Understanding the role of thermography in energy auditing: current practices and the potential for automated solutions." In Proceedings of ACM CHI 2015 Conference on Human Factors in Computing Systems. Best Paper Honorable Mention
- 59. 10 Participants (1 Female) Average Age: 44.8 Years Average Exp.: 6.7 Years PROFESSIONAL STUDY METHOD: PARTICIPANTS
- 60. Part 1: Semi-Structured Interviews ~50 Minutes Part 2: Presentation of Design Probes ~40 Minutes PROFESSIONAL STUDY METHOD: OVERVIEW Part 3: Observational Case Study ~3 Hours
- 61. Part 1: Semi-Structured Interviews ~50 Minutes Part 2: Presentation of Design Probes ~40 Minutes PROFESSIONAL STUDY METHOD: OVERVIEW Part 3: Observational Case Study ~3 Hours
- 62. Scenario 1 (Text) Scenario 2 (Text) Scenario 3 (Text) Scenario 4 (Video) Scenario 5 (Mid-Fi Prototype) PROFESSIONAL STUDY METHOD: PRESENTATION OF DESIGN PROBES
- 63. Scenario 1 (Text) Scenario 2 (Text) Scenario 3 (Text) Scenario 4 (Video) Scenario 5 (Mid-Fi Prototype) “You are responsible for a small fleet of thermography UAVs. The UAVs fly around semi-autonomously collecting thermal data about each building on your campus. When abnormalities are detected, the UAVs are programmed to more closely examine these areas and provide high resolution reports of potential problems. The UAVs reduce labor costs compared with manual assessments, can investigate otherwise inaccessible areas of buildings (e.g., high exterior floors), and enable historical reports showing thermal performance over time.” PROFESSIONAL STUDY METHOD: PRESENTATION OF DESIGN PROBES
- 64. Scenario 1 (Text) Scenario 2 (Text) Scenario 3 (Text) Scenario 4 (Video) Scenario 5 (Mid-Fi Prototype) PROFESSIONAL STUDY METHOD: PRESENTATION OF DESIGN PROBES
- 65. Scenario 5 (Mid-Fi Prototype) 3D Reconstruction, Anomaly Detection, Temporal Analysis
- 66. PROFESSIONAL STUDY METHOD: DATA ANALYSIS I qualitatively coded the interview and design probe data to uncover themes.
- 67. Required Knowledge Client Interactions Challenges PROFESSIONAL STUDY FINDINGS: SEMI-STRUCTURED INTERVIEWS
- 68. “The thing that is most critical to understand is how heat behaves and interacts with different materials.” –P1
- 69. social process: energy auditing is a socio-technical process
- 70. CHALLENGES PROFESSIONAL STUDY FINDINGS: SEMI-STRUCTURED INTERVIEWS All of our energy auditors brought up challenges related to the practice of thermography, especially related to: • Weather
- 71. CHALLENGES PROFESSIONAL STUDY FINDINGS: SEMI-STRUCTURED INTERVIEWS All of our energy auditors brought up challenges related to the practice of thermography, especially related to: • Weather • Untrained or undereducated practitioners
- 72. CHALLENGES PROFESSIONAL STUDY FINDINGS: SEMI-STRUCTURED INTERVIEWS All of our energy auditors brought up challenges related to the practice of thermography, especially related to: • Weather • Untrained or undereducated practitioners • Subjectivity in interpreting results
- 73. “The reality is that you can have three guys with the same camera, looking at the same thing, and have three totally different reports.” -P2
- 74. Automation Benefits Concerns PROFESSIONAL STUDY FINDINGS: DESIGN PROBES
- 75. Saving time and money Assessing inaccessible areas Scaling up data collection Automatic anomaly detection Model generation New types of analyses PROFESSIONAL STUDY FINDINGS: AUTOMATION BENEFITS
- 76. data quality: automated approaches lack control of environment
- 77. data overload: how to manage orders of magnitude more data?
- 78. PROFESSIONAL STUDY CONCLUSION: RESEARCH OUTCOMES An assessment of professional energy auditing and thermography’s role therein. A critical examination of emerging automated thermographic solutions to data collection and analysis. A set of design recommendations for future energy auditing and thermographic tools intended for professional use including: • Obtain environmental data • Integrate quantitative assessment • Minimize analysis time
- 79. Novice Thermography Studies CHI’16, CHI’17 Professional Thermography Studies UbiComp’14, CHI’15 Temporal Thermography UbiComp’17, CHI’19 Energy Efficiency EXAMINING BUILDING THERMOGRAPHY
- 80. Novice Thermography Studies CHI’16, CHI’17 Professional Thermography Studies UbiComp’14, CHI’15 Temporal Thermography UbiComp’17, CHI’19 Energy Efficiency EXAMINING BUILDING THERMOGRAPHY
- 81. Designing Building Thermography Systems Energy Efficiency [UbiComp‘17, CHI’19 ]
- 82. TEMPORAL THERMOGRAPHY STUDY: RESEARCH QUESTIONS How does using the temporal thermography system influence homeowner’s confidence in their assessments? And, how might the temporal thermography system fit with current professional practices? Mauriello, M.L., McNally, B., and Froehlich, J.E. (2019). “Thermporal: An Easy-to-Deploy Temporal Thermographic Sensor System to Support Residential Energy Audits.” In Proceedings of ACM CHI 2019 Conference on Human Factors in Computing Systems
- 83. Easy-to-Deploy Non-intrusive Provide Rapid Analysis Help with Severity Estimation Holistic Report TEMPORAL THERMOGRAPHY DEVELOPMENT: DESIGN GOALS
- 84. TEMPORAL THERMOGRAPHY RELATED WORK: TEMPORAL DATA COLLECTION Fox et al., Energy and Buildings ‘14
- 85. TEMPORAL THERMOGRAPHY RELATED WORK: TEMPORAL DATA COLLECTION Fox et al., Energy and Buildings ‘14
- 86. TEMPORAL THERMOGRAPAHY RELATED WORK: TEMPORAL DATA COLLECTION Fox et al., Energy and Buildings ‘14
- 87. Fox et al., Energy and Buildings ‘14 TEMPORAL THERMOGRAPHY RELATED WORK: TEMPORAL VISUALIZATIONS
- 88. PHYSIKIT HOUBEN ET AL., 2016
- 89. BuildAX Environmental Sensor Toolkit Finnigan et al. 2017 PHYSIKIT HOUBEN ET AL., 2016
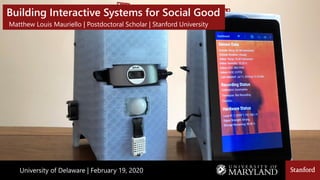
- 90. Thermal Camera Motion Sensor Pan Unit Humidity/Temperature Sensor Raspberry Pi Interchangeable Mounting Plate GPS Unit & High Capacity Battery Mauriello, M.L., Chazan, J., Gilkeson, J., and Froehlich, J.E., (2017). "A temporal thermography system for supporting longitudinal building energy audits." In Proceedings of the 2017 ACM international Joint Conference on Pervasive and Ubiquitous Computing. Adjunct Publication. EASY-TO-DEPLOY THERMOGRAPHIC SENSOR SYSTEM (V3.0)
- 92. TEMPORAL THERMOGRAPHY USER STUDY: FINDINGS Results Based on user study sessions (n=5): • Temporal thermography is helpful for evaluating the impact of environmental conditions • Deploying hardware remains challenging (e.g., no screen on device for ensuring connection to Wi-Fi) • Assessment of temporal issues remains subjective.
- 93. TEMPORAL THERMOGRAPY RELATED WORK: QUANTITATIVE THERMOGRAPHY Madding, 2008
- 94. Nardi et al., 2016 Fokaides & Kalogirou, 2011 Dall’O et al., 2013 Albatici et al., 2015 TEMPORAL THERMOGRAPY RELATED WORK: QUANTITATIVE THERMOGRAPHY
- 95. Direct Contact Methods: Heat Flux Sensors and Thermocouples TEMPORAL THERMOGRAPY RELATED WORK: QUANTITATIVE THERMOGRAPHY
- 99. TEMPORAL THERMOGRAPHY DEVELOPMENT: SYSTEM OVERVIEW
- 100. TEMPORAL THERMOGRAPHY DEVELOPMENT: SYSTEM OVERVIEW
- 101. Sensing Calibration, Processing, Reporting TEMPORAL THERMOGRAPHY DEVELOPMENT: SYSTEM OVERVIEW
- 102. Sensing Calibration, Processing, Reporting TEMPORAL THERMOGRAPHY DEVELOPMENT: SYSTEM OVERVIEW
- 103. TEMPORAL THERMOGRAPHY DEVELOPMENT: REVISED VISUALIZATION
- 104. TEMPORAL THERMOGRAPHY DEVELOPMENT: VALIDATION EXPERIMENTS
- 105. Data Segment Notional THM (deviation) IRT (deviation) Average Temp. Delta Day 1 R-6.50 R-7.54 (16.00%) R-7.67 (18.00%) 27.47°C Day 2 R-6.50 R-6.67 (2.61%) R-6.29 (3.23%) 20.96°C Full Campaign R-6.50 R-6.30 (3.07%) R-6.39 (1.69%) 22.85°C TEMPORAL THERMOGRAPHY DEVELOPMENT: VALIDATION RESULTS
- 106. Study 1: Novice Field Deployment 1 Week Part 2: Expert Review ~90 Minutes TEMPORAL THERMOGRAPHY STUDY METHOD: TWO-PARTS
- 107. Study 1: Novice Field Deployment 1 Week Part 2: Expert Review ~90 Minutes TEMPORAL THERMOGRAPHY STUDY METHOD: TWO-PARTS
- 108. TEMPORAL THERMOGRAPHY FIELD DEPLOYMENT: PARTICIPANTS 5 Participants (3 Male, 1 Female, 1 Prefer Not to Answer)
- 109. Pre-Study Questionnaire Thermal Camera “Mission” Survey Introduction Meeting TEMPORAL THERMOGRAPHY FIELD DEPLOYMENT: PROCEDURE
- 110. TEMPORAL THERMOGRAPHY FIELD DEPLOYMENT: PROCEDURE Pre-Study Questionnaire Thermal Camera “Mission” Survey Introduction Meeting Sensor System “Mission”
- 111. TEMPORAL THERMOGRAPHY FIELD DEPLOYMENT: PROCEDURE Pre-Study Questionnaire Thermal Camera “Mission” Survey Introduction Meeting Sensor System “Mission” 1 Week
- 112. Pre-Study Questionnaire Thermal Camera “Mission” Semi-Structured Interview Post-Study Follow-up (~45 days) Survey Introduction Meeting Sensor System “Mission” TEMPORAL THERMOGRAPHY FIELD DEPLOYMENT: PROCEDURE
- 113. I qualitatively coded the survey and interview data to uncover themes. TEMPORAL THERMOGRAPHY FIELD DEPLOYMENT: ANALYSIS
- 114. Thermal Camera “Mission” Survey TEMPORAL THERMOGRAPHY FIELD DEPLOYMENT: RESULTS
- 115. TEMPORAL THERMOGRAPHY FIELD DEPLOYMENT: THERMAL CAMERA RESULTS
- 116. TEMPORAL THERMOGRAPHY FIELD DEPLOYMENT: THERMAL CAMERA RESULTS “There are some very cold spots in the office, but it’s hard to tell if they are just because it's unheated or that there's some big gaps in the insulation.” –NS2
- 117. Sensor System “Mission” Survey TEMPORAL THERMOGRAPHY FIELD DEPLOYMENT: RESULTS
- 118. Participant ID Sensor Kit Aimed at Suspected Issue Issue was Found P1 No No P2 Yes Yes Less severe than anticipated P3 Yes Yes P4 No Yes P5 Yes Based on intuition, not thermal camera No TEMPORAL THERMOGRAPHY FIELD DEPLOYMENT: SENSOR SYSTEM RESULTS
- 119. Participant ID Sensor Kit Aimed at Suspected Issue Issue was Found P1 No No P2 Yes Yes Less severe than anticipated P3 Yes Yes P4 No Yes P5 Yes Based on intuition, not thermal camera No TEMPORAL THERMOGRAPHY FIELD DEPLOYMENT: SENSOR SYSTEM RESULTS
- 120. TEMPORAL THERMOGRAPHY FIELD DEPLOYMENT: SENSOR SYSTEM RESULTS Participant ID Sensor Kit Aimed at Suspected Issue Issue was Found P1 No No P2 Yes Yes Less severe than anticipated P3 Yes Yes P4 No Yes P5 Yes Based on intuition, not thermal camera mission No “It kind of gave me a why. It's real cold here and it is below code. Here's some further information you can look at. That was super helpful. I can decide if I agree that this is a problem, and it’s telling me something I can do.” –NI2
- 121. Participant ID Sensor Kit Aimed at Suspected Issue Issue was Found P1 No No P2 Yes Yes Less severe than anticipated P3 Yes Yes P4 No Yes P5 Yes Based on intuition, not thermal camera No TEMPORAL THERMOGRAPHY FIELD DEPLOYMENT: SENSOR SYSTEM RESULTS
- 122. TEMPORAL THERMOGRAPHY FIELD DEPLOYMENT: SENSOR SYSTEM RESULTS Participant ID Sensor Kit Aimed at Suspected Issue Issue was Found P1 No No P2 Yes Yes Less severe than anticipated P3 Yes Yes P4 No Yes P5 Yes Based on intuition, not thermal camera mission No “My reports were negative, so I am not sure what else to glean from them.” –NS5
- 123. Semi-Structured Interview TEMPORAL THERMOGRAPHY FIELD DEPLOYMENT: INTERVIEW RESULTS
- 124. Interactive Reporting Data Privacy Assessment Confidence Post-Mission Attitudes TEMPORAL THERMOGRAPHY FIELD DEPLOYMENT: INTERVIEW RESULTS
- 125. Interactive Reporting Data Privacy Assessment Confidence Post-Mission Attitudes TEMPORAL THERMOGRAPHY FIELD DEPLOYMENT: INTERVIEW RESULTS
- 126. Interactive Reporting Participants described the interactive report in several ways: • 4 of 5 were positive about receiving the easy-to-read, automatically generated report. TEMPORAL THERMOGRAPHY FIELD DEPLOYMENT: INTERVIEW RESULTS
- 127. Interactive Reporting Participants described the interactive report in several ways: • 4 of 5 were positive about receiving the easy-to-read, automatically generated report. • 4 of 5 liked having temporal data and the additional depth the report provided by comparison to thermograms alone. TEMPORAL THERMOGRAPHY FIELD DEPLOYMENT: INTERVIEW RESULTS
- 128. TEMPORAL THERMOGRAPHY FIELD DEPLOYMENT: INTERVIEW RESULTS Interactive Reporting Participants described the interactive report in several ways: • 4 of 5 were positive about receiving the easy-to-read, automatically generated report. • 4 of 5 liked having longitudinal data and the additional depth the report provided by comparison to thermograms alone. “I like the idea of having a report that I can refer to again afterward. You get that with pictures too, obviously. But the reporting aspect gives you more detail, […] the fact that you had the environmental and air quality readings also gave you something more to look at.” –NI3
- 129. Interactive Reporting Participants described the interactive report in several ways: • 4 of 5 were positive about receiving the easy-to-read, automatically generated report. • 4 of 5 liked having longitudinal data and the additional depth the report provided by comparison to thermograms alone. • 3 of 5 envisioned using this data as a tool to communicate with professionals TEMPORAL THERMOGRAPHY FIELD DEPLOYMENT: INTERVIEW RESULTS
- 130. TEMPORAL THERMOGRAPHY FIELD DEPLOYMENT: INTERVIEW RESULTS Interactive Reporting Participants described the interactive report in several ways: • 4 of 5 were positive about receiving the easy-to-read, automatically generated report. • 4 of 5 liked having longitudinal data and the additional depth the report provided by comparison to thermograms alone. • 3 of 5 envisioned using this data as a tool to communicate with professionals “If there's a big problem, that's the thing I want to fix, but I don't trust that some guy is coming in and not trying to sell me [on repairs].” –NI2
- 131. Participant ID Sensor Kit Aimed at Suspected Issue Issue was Found P1 No No P2 Yes Yes Less severe than anticipated P3 Yes Yes P4 No Yes P5 Yes Based on intuition, not thermal camera No TEMPORAL THERMOGRAPHY FIELD DEPLOYMENT: CONFIDENCE IN ASSESSMENTS
- 132. Post-Study Follow-up (~45 days) TEMPORAL THERMOGRAPHY FIELD DEPLOYMENT: FOLLOW-UP RESULTS
- 133. Follow-up Findings After 45 Days, participants reported: • 5 of 5 reported thinking more about energy efficiency issues in their home since participation had ended. TEMPORAL THERMOGRAPHY FIELD DEPLOYMENT: FOLLOW-UP RESULTS
- 134. TEMPORAL THERMOGRAPHY FIELD DEPLOYMENT: FOLLOW-UP RESULTS Follow-up Findings After 45 Days, participants reported: • 5 of 5 reported thinking more about energy efficiency issues in their home since participation had ended. “It has made me generally more aware of where there might be issues and why.” –NS3
- 135. Follow-up Findings After 45 Days, participants reported: • 5 of 5 reported thinking more about energy efficiency issues in their home since participation had ended. • 2 of 5 reported making some repairs for air leakage issues; however, all reported that insulation issues required more savings and planning. TEMPORAL THERMOGRAPHY FIELD DEPLOYMENT: FOLLOW-UP RESULTS
- 136. TEMPORAL THERMOGRAPHY FIELD DEPLOYMENT: FOLLOW-UP RESULTS Follow-up Findings After 45 Days, participants reported: • 5 of 5 reported thinking more about energy efficiency issues in their home since participation had ended. • 2 of 5 reported making some repairs for air leakage issues; however, all reported that insulation issues required more savings and planning. “I'd say it's kind of too late for a homeowner, unless you're about to do a renovation.” –NI3
- 137. Study 1: Novice Field Deployment 1 Week Part 2: Expert Review ~90 Minutes TEMPORAL THERMOGRAPHY STUDY METHOD: TWO-PARTS
- 138. Study 1: Novice Field Deployment 1 Week Part 2: Expert Review ~90 Minutes TEMPORAL THERMOGRAPHY STUDY METHOD: TWO-PARTS
- 139. TEMPORAL THERMOGRAPHY EXPERT REVIEW: PARTICIPANTS 5 Participants (All male)
- 140. Scenario 1 (Text) Scenario 3 (Text) Interactive Demo TEMPORAL THERMOGRAPHY EXPERT REVIEW: PRESENTATION OF DESIGN PROBES
- 141. Scenario 1 (Text) Scenario 3 (Text) Interactive Demo Hardware & Procedure Study Data & Reports TEMPORAL THERMOGRAPHY EXPERT REVIEW: PRESENTATION OF DESIGN PROBES
- 142. TEMPORAL THERMOGRAPHY EXPERT REVIEW: DESIGN PROBE RESULTS
- 143. Raising Awareness TEMPORAL THERMOGRAPHY EXPERT REVIEW: DESIGN PROBE RESULTS
- 144. Raising Awareness Providing Reliable Data TEMPORAL THERMOGRAPHY EXPERT REVIEW: DESIGN PROBE RESULTS
- 145. Raising Awareness Providing Reliable Data Relationship Building TEMPORAL THERMOGRAPHY EXPERT REVIEW: DESIGN PROBE RESULTS
- 146. TEMPORAL THERMOGRAPHY EXPERT REVIEW: DESIGN PROBE RESULTS
- 147. Installation and Coverage TEMPORAL THERMOGRAPHY EXPERT REVIEW: DESIGN PROBE RESULTS
- 148. Motivating Action Installation and Coverage TEMPORAL THERMOGRAPHY EXPERT REVIEW: DESIGN PROBE RESULTS
- 149. DISSERTATION SUMMARY TEMPORAL THERMOGRAPHY CONCLUSION: CONTRIBUTIONS Integrating Temporal/Quantitative analysis will likely provide more specific insights in the case of insulation performance. Increasing homeowner agency may open new opportunities for professional auditor and homeowner relations. While we saw DIY solutions enacted, motivating larger-scale structural changes remains challenging. Mauriello, M.L., McNally, B., and Froehlich, J.E. (2019). “Thermporal: An Easy-to-Deploy Temporal Thermographic Sensor System to Support Residential Energy Audits.” In Proceedings of ACM CHI 2019 Conference on Human Factors in Computing Systems
- 150. Pervasive Thermography Team Jon E. Froehlich Noa Chazan Leyla Norooz Erica Brown Manaswi Saha Matthew Dahlhausen Jamie H. Gilkeson Julie Zheng Matthew Brady Anthony Castrio Brenna McNally Sapna Bagalkotkar Cody Buntain Samuel Kushnir Simran Chawla
- 151. Multi-Sensor Deployments Standard for Temporal Thermography CONCLUSION: FUTURE WORK
- 152. BUILDING INTERACTIVE SYSTEMS Energy Efficiency (Surfacing Information) Indoor Navigation (Services On-demand)
- 153. BUILDING INTERACTIVE SYSTEMS Energy Efficiency (Surfacing Information) Indoor Navigation (Services On-demand)
- 154. [IJHCS ‘21 To Appear] Designing Indoor Navigation Systems Smart Environments
- 157. INDOOR NAVIGATION: RESEARCH QUESTIONS Can we design a low-cost, scalable system that improves indoor navigational performance and keeps users engaged in their environment?
- 158. Part 1: Formative Survey Part 2: System Design INDOOR NAVIGATION: OVERVIEW Part 3: Evaluation
- 159. Part 1: Formative Survey Part 2: System Design Part 3: Evaluation INDOOR NAVIGATION: OVERVIEW
- 160. INDOOR NAVIGATION: FORMATIVE SURVEY Method We recruited 58 participants and asked about their: • Experience navigating unfamiliar indoor spaces (generally) • Experience navigating indoor office environments • Perceptions of different technology interventions (e.g., AR)
- 161. Findings Based on survey responses: • Most common reasons for navigational challenges included: • Confusing layouts or floorplans • Difficulty orienting on posted maps • Lack of general signage • Confusing naming or numbering conventions INDOOR NAVIGATION: FORMATIVE SURVEY
- 162. Findings Based on survey responses: • Perceptions of technology solutions were often mixed: • Participants were split about mobile applications, with about half viewing these solution positively and the remaining considered it a hassle. • Participants were more positive about large screen displays but considered them to expensive and impractical for most use cases. • Solutions involving AR were also viewed as problematic because most were unlikely to carry additional (heavy) technology INDOOR NAVIGATION: FORMATIVE SURVEY
- 163. Part 1: Formative Survey Part 2: System Design Part 3: Evaluation INDOOR NAVIGATION: OVERVIEW
- 164. Part 1: Formative Survey Part 2: System Design Part 3: Evaluation INDOOR NAVIGATION: OVERVIEW
- 165. ESP8266 Dev Board Digital RGB LED Strip Battery Pack INDOOR NAVIGATION: SYSTEM DESIGN
- 167. INDOOR NAVIGATION: SYSTEM DESIGN
- 168. Part 1: Formative Survey Part 2: System Design Part 3: Evaluation INDOOR NAVIGATION: OVERVIEW
- 169. Part 1: Formative Survey Part 2: System Design Part 3: Evaluation INDOOR NAVIGATION: OVERVIEW
- 170. Evaluation n = 18 INDOOR NAVIGATION: EVALUATION
- 171. • Does our system lead to performance improvements over posted maps? Does route complexity or display density impact performance? And, what might that mean for scalability? INDOOR NAVIGATION: EVALUATION
- 172. • Does our system lead to performance improvements over posted maps? Does route complexity or display density impact performance? And, what might that mean for scalability? • We used a 3 x 2 within-subjects design with factors for: • Indicator density (None, Low, and High) • Route complexity (Simple and Complex). INDOOR NAVIGATION: EVALUATION
- 173. Evaluation n = 18 INDOOR NAVIGATION: EVALUATION
- 174. Evaluation n = 18 INDOOR NAVIGATION: EVALUATION
- 175. • Data collected: • Height and gait information • Timing and task load (NASA TLX) data on the individual tasks • Post-study Interview and System Usability Scale (SUS) data INDOOR NAVIGATION: MEASURES
- 176. INDOOR NAVIGATION: TIMING DATA
- 177. INDOOR NAVIGATION: TIMING DATA
- 178. INDOOR NAVIGATION: TIMING DATA
- 179. INDOOR NAVIGATION: TIMING DATA
- 180. Findings Timing data (mph) analyzed using a two-way, repeated measures ANOVA. Results indicate participants were: • On average, participants were fastest in: • High indicator density conditions (m = 1.9;sd = 0.42) versus • Low (m = 1.81;sd = 0.54) and • None (m = 1.61;sd = 0.56) • Density had a significant effect (F(2,34)=3.61, p<0.05). INDOOR NAVIGATION: DENSITY
- 181. INDOOR NAVIGATION: TIMING DATA
- 182. Findings Timing data (mph) analyzed using a two-way, repeated measures ANOVA. Results indicate participants were: • On average, participants were fastest in: • High indicator density conditions (m = 1.9;sd = 0.42) versus • Low (m = 1.81;sd = 0.54) and • None (m = 1.61;sd = 0.56) • Density had a significant effect (F(2,34)=3.61, p<0.05). • Post-hoc analysis (H1 = None < High) was also found to be significant (p<0.01) INDOOR NAVIGATION: DENSITY
- 183. Findings Timing data (mph) analyzed using a two-way, repeated measures ANOVA. Results indicate participants were: • On average, participants were fastest in: • Complex route conditions (M = 1.93; SD = 0.51) versus • Simple route conditions (M = 1.62; SD = 0.48). • Complexity had a significant effect (F(1,17)=14.95, p<0.01). INDOOR NAVIGATION: ROUTE COMPLEXITY
- 184. Findings Timing data (mph) analyzed using a two-way, repeated measures ANOVA. Results indicate participants were: • Between both factors, there was also significant interaction effect (F(2,34)=5.53, p<0.01). INDOOR NAVIGATION: DENSITY X ROUTE COMPLEXITY
- 185. Conclusions • The system offers speed-ups over posted maps. • Task complexity is likely to determine the number of display units that are active but the most complex tasks will likely influence the total number of units needed to be installed. INDOOR NAVIGATION: DENSITY X ROUTE COMPLEXITY
- 186. INDOOR NAVIGATION: TASK LOAD DATA
- 187. Findings Qualitative feedback on the system indicated that participants: • Enjoyed using the system INDOOR NAVIGATION: PARTICIPANT FEEDBACK
- 188. Findings Qualitative feedback on the system indicated that participants: • Enjoyed using the system • Reported improved confidence during navigation tasks INDOOR NAVIGATION: PARTICIPANT FEEDBACK
- 189. Findings Qualitative feedback on the system indicated that participants: • Enjoyed using the system • Reported improved confidence during navigation tasks INDOOR NAVIGATION: PARTICIPANT FEEDBACK “You feel more confident when you’re working with it. Using the maps give you a rough idea, but not a sense of direction. This fills that gap and helps a lot.”(P55)
- 190. Findings Qualitative feedback on the system indicated that participants: • Enjoyed using the system • Reported improved confidence during navigation tasks • Appreciated the aesthetics of the system INDOOR NAVIGATION: PARTICIPANT FEEDBACK
- 191. Findings Qualitative feedback on the system indicated that participants: • Enjoyed using the system • Reported improved confidence during navigation tasks • Appreciated the aesthetics of the system INDOOR NAVIGATION: PARTICIPANT FEEDBACK “It was just a part of the environment and visually pleasing” (P40)
- 192. Low-cost, LED Matrices deliver similar benefits ascribed to high- cost solutions Offers avenues for improving indoor navigational experiences Potential for synergies with other technologies to create mixed- fidelity display ecosystems INDOOR NAVIGATION: CONCLUSION
- 193. BUILDING INTERACTIVE SYSTEMS Energy Efficiency (Surfacing Information) Indoor Navigation (Services On-demand)
- 194. Environmental Sustainability Smart Environments FOCUS AREAS & FUTURE WORK
- 196. [CHI’14] Health & Wellness Designing Fitness Support Systems Health & Wellness Mauriello, M.L., Gubbels, M., Froehlich, J.E., (2014). "Social Fabric Fitness: The design and evaluation of wearable e-textile displays to support group running." In Proceedings of ACM CHI 2014 Conference on Human Factors in Computing Systems.
- 198. How flexible are users with respect to path optimization?
- 199. Can we use this low-cost wayfinding system for behavioral nudges?
- 200. Environmental Sustainability Health & Wellness FOCUS AREAS & FUTURE WORK Smart Environments
- 201. Environmental Sustainability Smart Environments Health & Wellness Early Education FOCUS AREAS & FUTURE WORK
- 202. [CHI’12, IJCCI’14] Health & Wellness Early Education Games for Computational Thinking (CTArcade) Lee, T. Y., Mauriello, M. L., Ahn, J., and Bederson, B.B., (2014). "CTArcade: Computational thinking with games in school age children." International Journal of Child-Computer Interaction, v2.1 (2014): 26-33.
- 203. • KYEN Program STEM Education An Energy Lifestyle Program for Tweens [CHI’19] Mauriello, M.L., Zanocco, C., Stelmach, G., Flora, J., Boudet, H., and Rajagopal, R., (2019). “An Energy Lifestyles Program for Tweens: A Pilot Study”. In Proceedings of ACM CHI 2019 Conference on Human Factors in Computing Systems. Extended Abstract.
- 204. Could we including real-time building informatics data into simulation games that educate users?
- 205. Affective Built Environments for Health & Well-being FOCUS AREAS & FUTURE WORK
- 206. Building Informatics for Real-time Energy Education Games Affective Built Environments for Health & Well-being FOCUS AREAS & FUTURE WORK
- 207. makeability lab @mattm401 | mattm401@stanford.edu http://web.stanford.edu/~mattm401/ Building Interactive Systems for Social Good Matthew Louis Mauriello | Postdoctoral Scholar | Stanford University