Communicating your social impact 2022 infographic
•
0 likes•2 views

Communicating your social impact 2022 infographic by McCrindle Research

Recommended
Recommended
More Related Content
Similar to Communicating your social impact 2022 infographic
Similar to Communicating your social impact 2022 infographic (20)
More from Mark McCrindle
More from Mark McCrindle (20)
Recently uploaded
Recently uploaded (20)
Communicating your social impact 2022 infographic
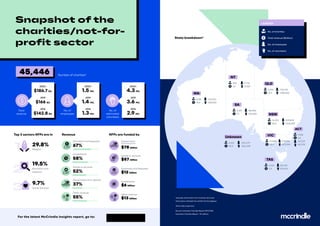
- 1. 4,136 15.6 124,923 218,033 WA 405 1.5 11,776 13,180 NT 3,159 9.1 88,084 154,359 SA 6,419 19.3 178,314 408,506 QLD 14,074 39.4 329,808 1,535,987 NSW 10,840 35.9 279,555 693,043 VIC 1,043 2.4 28,425 104,676 TAS 1,055 4.5 24,539 48,294 ACT 4,315 35.2 293,279 363,338 Unknown State breakdown* *excludes information from charities that have information withheld from ACNC Charity Register < McCrindle projections Source: Australian Charities Report 2013-2018, Australian Charities Report - 7th edition. Snapshot of the charities/not-for- profit sector 2022 $186.7 BIL 2019 $166 BIL 2016 $142.8 BIL 2022< 1.5 MIL 2019 1.4 MIL 2016 1.3 MIL 2022< 4.3 MIL 2019 3.6 MIL 2016 2.9 MIL Number of charities* 2022< $186.7 BIL 2019 $166 BIL 2016 $142.8 BIL Top 3 sectors NFPs are in Revenue NFPs are funded by 1 2 3 29.8% 67% 58% 52% 37% 55% 19.5% 9.7% Religion Donations and bequests Investments Goods or services Government (incl. grants) Other revenue Education and research Social Services 45,446 Government (including grants) $78 billion Goods or services $57 billion Donations and bequests $12 billion Investments $6 billion Other revenue $13 billion Total revenue No. of employees No. of estimated volunteers No. of charities Total revenue ($billion) No. of employees No. of volunteers LEGEND For the latest McCrindle Insights report, go to: mccrindle.com.au mccrindle.com.au
- 2. Australian attitudes towards social impact reporting Younger Australians driving the rise of social impact reporting Gen Ys (93%) are more likely than Baby Boomers (80%) to engage with an organisation that clearly communicates its social impact Gen Ys (90%) are more likely than Baby Boomers (77%) to tell others about an organisation that clearly communicates its social impact Gen Z are 2.6 times as likely as Baby Boomers to know of and be at least somewhat familiar with the term social impact reporting (47% Gen Z cf. 18% Baby Boomers). Top three areas Australians are looking for organisations to report on Extremely/very important Reducing environmental impact Building stronger connections with local community Rebuilding economic activity Increasing social and environmental impact reporting Addressing supply chain issues 49% 43% 37% 30% 30% Social impact reporting is the process of communicating not just the activities undertaken by the organisation but the outcomes and changes that have occurred because of it. We anticipate that within a decade, just like financial reporting, social impact reporting will be viewed as essential, if not mandatory. 1 2 3 4 5 47% 18% Environmental impact Staff morale and wellbeing Social impact 67% 65% 62% Short video summary Infographic Interactive web report Social media Website Email Bite-sized, regular updates are best for sharing about organisational impacts Two in five Australians (41%) want to hear about the impacts of the organisations they are engaged with at least monthly. Australians are most likely to want to spend between two and five minutes engaging with an organisation’s content to understand its social impact (39%). Most engaging platforms for hearing about an organisation’s social impact Extremely/very engaging Social impact reporting builds trust 87% of Australians agree that social impact reporting builds their trust with an organisation 86% of Australians agree they are more likely to engage with an organisation that clearly communicates its social impact 84% of Australians agree they are more likely to tell others about an organisation that clearly communicates its social impact For the latest McCrindle Insights report, go to: Top five issues for organisations to focus on in the year ahead according to Australians Methodology Research and infographic by McCrindle research Online survey of 1,003 Australians aged 18+ In field 6-10th January 2021 Most engaging forms of social impact reporting Extremely/very engaging mccrindle.com.au mccrindle.com.au