Australian Communities 2019 infographic
•
0 likes•3 views

Australian Communities 2019 infographic by McCrindle Research

Recommended
Recommended
More Related Content
Similar to Australian Communities 2019 infographic
Similar to Australian Communities 2019 infographic (20)
More from Mark McCrindle
More from Mark McCrindle (20)
Recently uploaded
Recently uploaded (20)
Australian Communities 2019 infographic
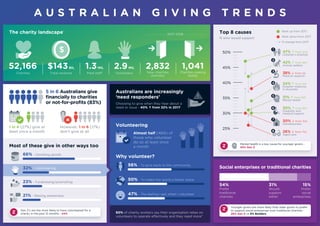
- 1. A U S T R A L I A N G I V I N G T R E N D S Most of these give in other ways too Australians are increasingly ‘need responders’ Social enterprises or traditional charities Volunteering The charity landscape† Choosing to give when they hear about a need or issue - 40% ↑ from 32% in 2017 60% of charity workers say their organisation relies on volunteers to operate effectively and they need more* % who would support Charities Total revenue Paid staff Volunteers 50% 45% 40% 35% 30% 25% 66% - Donating goods Top 8 causes 32% - Volunteering 23% - Fundraising/promoting 21% - Raising awareness 5 in 6 Australians give financially to charities or not-for-profits (83%) 1 in 4 (27%) give at least once a month However, 1 in 6 (17%) don’t give at all Almost half (46%) of those who volunteer do so at least once a month 38% ↓ from 1st Medical research 47% ↑ from 2nd Children’s charities 30% ↓ from 3rd Homelessness 31% ↑ from 6th Mental health 42% ↑ from 4th Animal welfare 34% ↑ from 5th Disaster response in Australia 30% ↑ from 8th Disability and medical support 26% ↓ from 7th Aged care Rank up from 2017 Rank down from 2017 % change from 2017 50% - To make the world a better place 56% - To give back to the community 47% - The feeling I get when I volunteer 52,166 $143BIL 1.3MIL 2.9MIL New charities (entries) 2017-2018 2,832 Charities ceasing (exits) 1,041 Gen Z’s are the most likely to have volunteered for a charity in the past 12 months - 44% Z Z Younger givers are more likely than older givers to prefer to support social enterprises over traditional charities - 26% Gen Z vs 6% Builders Z Why volunteer? Mental health is a key cause for younger givers - 45% Gen Z 54% Prefer traditional charities 15% Prefer social enterprises 31% Would support either $ 1 2 3 4 5 6 7 8
- 2. K E Y D R I V E R S F O R E N G A G E M E N T Methodology Nationally representative survey, n=1103. * Charity workers survey, n= 169. † ACNC Annual report 2018, Australian Charities Report 2016. Research and infographic by McCrindle - cb2019 66% Know and trust the charity 58% Personal values align 55% Making the world a better place mccrindle.com.au Blockers and enablers for giving Trust in the not-for-profit sector 61% VS E M O T I O N A L B L O C K E R S E N A B L E R S P R A C T I C A L Doubt how much money reaches those in need Lack of trust in charities Oversaturation of charities Not seeing the impact of giving Already give to people in need Communicate the impacts of giving Values alignment with organisation Communicate the vision and mission of the organisation Personal connection Frontline participation Variable income/rising cost of living Transparency regarding admin costs Intrusive donation requests Fixed giving amounts/frequency Not aware of the need Cost effective organisations Positive donor experience One-off giving Simple giving process Flexible donation amount $ % who say this is extremely/very important % who believe they are extremely/very trustworthy The top 5 charity essentials % who say this is extremely/very significant Top motivators for getting involved $ 69% Transparent reporting of admin costs 68% Well established with a proven track record 68% Verification of registration as a charity 67% Where donations are allocated 62% Reporting of specific impacts 29% 37% 23% A personal connection with the organisation is extremely or very important for 50% of Gen Z Z Gen Z (43%) are 14 times as likely as Builders (3%) to consider social enterprises extremely/very trustworthy Z Younger givers are looking for personal connections (54% Gen Y cf. 33% Builders) Registered charities you personally support Not-for-profit organisations (e.g. local community groups, sports clubs) The charity sector as a whole Social enterprises (e.g. Thankyou, Zambrero) 1 1 2 3 Z 2 3 4 5 Older givers are looking for transparency (87% Builders cf. 53% Gen Z)