Ensuring Technical Readiness For Copilot in Microsoft 365
Luxottica q3 2010_results
1. 1
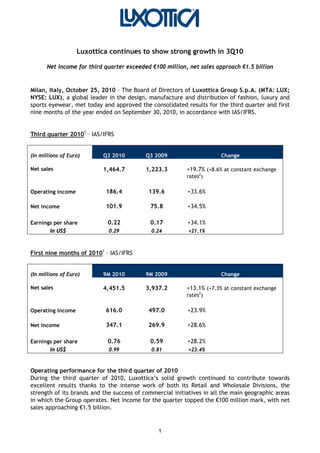
Luxottica continues to show strong growth in 3Q10
Net income for third quarter exceeded €100 million, net sales approach €1.5 billion
Milan, Italy, October 25, 2010 – The Board of Directors of Luxottica Group S.p.A. (MTA: LUX;
NYSE: LUX), a global leader in the design, manufacture and distribution of fashion, luxury and
sports eyewear, met today and approved the consolidated results for the third quarter and first
nine months of the year ended on September 30, 2010, in accordance with IAS/IFRS.
Third quarter 20101
– IAS/IFRS
(In millions of Euro) Q3 2010 Q3 2009 Change
Net sales 1,464.7 1,223.3 +19.7% (+8.6% at constant exchange
rates2
)
Operating income 186.4 139.6 +33.6%
Net income 101.9 75.8 +34.5%
Earnings per share 0.22 0.17 +34.1%
in US$ 0.29 0.24 +21.1%
First nine months of 20101
– IAS/IFRS
(In millions of Euro) 9M 2010 9M 2009 Change
Net sales 4,451.5 3,937.2 +13.1% (+7.3% at constant exchange
rates2
)
Operating income 616.0 497.0 +23.9%
Net income 347.1 269.9 +28.6%
Earnings per share 0.76 0.59 +28.2%
in US$ 0.99 0.81 +23.4%
Operating performance for the third quarter of 2010
During the third quarter of 2010, Luxottica’s solid growth continued to contribute towards
excellent results thanks to the intense work of both its Retail and Wholesale Divisions, the
strength of its brands and the success of commercial initiatives in all the main geographic areas
in which the Group operates. Net income for the quarter topped the €100 million mark, with net
sales approaching €1.5 billion.
2. 2
“Results achieved in the third quarter of 2010 were positive,” commented Andrea Guerra, Chief
Executive Officer of Luxottica. “All our people were able to strongly react to and make the best
of the opportunities offered by the New World in which we operate. Such results may be
summarized in a solid growth in so-called mature markets – net sales in Europe were up by
12.7% and net sales in U.S. dollars in North America rose by 8.5% over the third quarter last year
- as well as in a strong increase in key emerging markets, where net sales grew by 26.2% over
last year.”
Sun season results were positive all over the world and Sunglass Hut, our specialty sun stores
chain, posted successful performances both in the U.S., where comparable store sales4
were up
by 12.5%, and globally.”
Due attention must be given to the new growth trend of our premium and luxury brands: over
the last two quarters, we have experienced a steady increase in the number of consumers again
interested in these brands.”
I’m also really proud of our excellent positive free cash flow3
, equivalent to more than €250
million in the quarter, which confirmed the validity of our business model and the constant
attention to working capital.”
The results achieved thus far allow us to look optimistically toward a year-end that, if we
continue to work with the determination and passion shown in recent months, may allow us to
reach the threshold of €400 million of net income.”
During the third quarter of the year, Luxottica successfully achieved very positive results in
most of the geographic regions in which it operates. The Wholesale Division made a decisive
contribution to these results with its continued growth in both more mature markets, such as
the United States and Europe, and in emerging markets, where net sales increased by more than
20% for the fourth consecutive quarter, with increases of approximately 40% seen in India and
South Korea.
The Group also posted very positive results at LensCrafters, which returned to its position as a
leader in the North American optical retail sector, and at Sunglass Hut, today more than ever,
the world’s leading sun specialty stores chain.
Consolidated results
In the third quarter of 2010, net sales rose by 19.7% at current exchange rates and by +8.6% at
constant exchange rates² to €1,464.7 million, from €1,223.3 million in the third quarter of 2009.
In the first nine months, net sales rose by 13.1% to €4,451.5 million, from €3,937.2 million in
the first nine months of 2009.
EBITDA3
grew over the previous year by +25.6% to €263.5 million, from €209.8 million in the
third quarter of 2009. In the first nine months, EBITDA3
increased from €711.3 million for the
first nine months of 2009 to €841.5 million (+18.3%) for the same period in 2010.
Operating income was €186.4 million for the third quarter of 2010 (€139.6 million for the same
period last year, +33.6%), while the Group’s operating margin improved from 11.4% in the third
quarter of 2009 to 12.7% for the same period in 2010. In the first nine months of the year,
operating income amounted to €616.0 million, up 23.9% from the €497.0 million posted for the
same period last year.
3. 3
Net income for the third quarter of 2010 increased to €101.9 million (up by +34.5% from €75.8
million for the same period in 2009), resulting in earnings per share (EPS) of €0.22 (at an
average Euro/Dollar exchange rate of 1.2910). In the first nine months of the year, net income
amounted to €347.1 million, up 28.6% from the €269.9 million posted for the same period last
year, resulting in EPS of €0.76 ((at an average Euro/Dollar exchange rate of 1.3145).
For the third quarter of 2010, once again, the Group generated excellent positive free cash
flow3
(more than €250 million). Net debt3
as of September 30, 2010, amounted to €2,269 million
(€2,337 million at the end of 2009), with a ratio of net debt to EBITDA3
of 2.3X as compared
with 2.7X at the end of 2009.
Overview of performance at the Wholesale Division
During the third quarter, the Wholesale Division continued to record excellent results thanks to
the continued success of commercial initiatives, the great appreciation by customers of
collections and initiatives such as the Buying Days, along with positive results from all Group
brands. Particularly noteworthy, for the second quarter in a row, the premium and luxury
brands accelerated their improvement trend, marking a 18% increase in net sales. Ray-Ban and
Oakley continued their double-digit growth, with great success enjoyed by the optical
collections. In terms of sales performance in the main geographical areas, Luxottica saw very
positive results in emerging markets, in particular in Brazil, China and India, as well as in
Europe.
The Division's net sales rose to €518.3 million in the third quarter of 2010, from €429.5 million in
the third quarter of 2009 (+20.7% at current exchange rates and +12.4% at constant exchange
rates2
). In the first nine months of 2010, net sales were €1,722.9 million, up 14.4% from the
€1,506.5 million recorded for the first nine months of 2009 (+9.5% at constant exchange rates²).
Operating income for the Wholesale Division amounted to €94.9 million in the third quarter of
2010, up by 53.8% compared with €61.7 million for the third quarter of 2009. The operating
margin rose to 18.3% during the third quarter of 2010, from 14.4% for the third quarter of 2009,
confirming the effectiveness of the measures taken to recover margins and a better price
point/product mix effect. In the first nine months of 2010, the operating margin was 21.6%
(19.7% in the same period of 2009).
Overview of performance at the Retail Division
During the third quarter, the Retail Division posted good results, boosted by positive
performances at LensCrafters and Sunglass Hut. In particular, comparable store sales4
at
LensCrafters were up by 8.4% for the third quarter of 2010 over the same period last year,
thanks to the strong efforts of the entire organization and the solid trend of both “plano” and
prescription sunglass sales, as well as the positive results seen in sales during the back-to-school
period.
Sunglass Hut also posted very positive results in terms of margins, with overall comparable store
sales4
up 9.6% as compared to last year, with a very positive trend in the United States
(+12.5%).
On the other hand, comparable store sales4
were negative in Australia, where the retail market
scenario is still challenging. In this market, the Group is reacting with new initiatives aimed at
increasing consumer traffic at the store level and at further improving the buying experience.
Early results in the current quarter are positive.
4. 4
Net sales for the Retail Division therefore rose to €946.5 million in the third quarter of 2010,
from €793.8 million in the third quarter of 2009 (+19.2% at current exchange rates, +6.5% at
constant exchange rates2
). In the first nine months of 2010, net sales were €2,728.6 million, up
12.3% on the €2,430.8 million recorded for the first nine months of 2009 (+5.9 at constant
exchange rates²).
The Division’s operating income grew by +13.5% to €129.3 million, from €113.9 million in the
third quarter of 2009. The operating margin for the third quarter of 2010 decreased from 14.3%
during the same period last year to 13.7%. In the first nine months of 2010, the operating margin
was 13.0% (12.8% in the first nine months of 2009).
§
The Board of Directors also resolved to amend the Company’s by-laws, in order to meet the new
criteria introduced by Italian Legislative Decree no. 27/2010, implementing Directive
2007/36/EC on shareholder rights.
In line with the provisions of Consob Regulation no. 17221/2010, and with the favorable
recommendation of the Internal Control Committee, whose members are exclusively
independent directors, the Board of Directors approved the new procedure on transactions with
related parties.
§
The results of the third quarter and first nine months of 2010 will be discussed today at 6:00
p.m. (CET) during a conference call with the financial community. The presentation will be
available via webcast directly from the website at www.luxottica.com.
In accordance with subsection 2 of Article 154-bis of the Italian Consolidated Finance Law, the Director
appointed to prepare the company’s accounts, Enrico Cavatorta, hereby declares that the accounting
disclosure contained in this release complies with the results of the accounting records, books and
registers of the Group.
Contacts
Ivan Dompé
Group Corporate Communications Director
Tel.: +39 (02) 8633 4726
E-mail: ivan.dompe@luxottica.com
Luca Biondolillo
Group Director of International Communications
Tel.: +39 (02) 8633 4668
E-mail: LucaBiondolillo@Luxottica.com
Alessandra Senici
Group Investor Relations Director
Tel.: +39 (02) 8633 4038
E-mail: InvestorRelations@Luxottica.com
www.luxottica.com
1 All comparisons, including percentage changes, are between the three and nine-month periods ended September 30, 2010 and
September 30, 2009, as indicated, in accordance with IAS/IFRS.
2 Figures given at constant exchange rates have been calculated using the average exchange rate of the respective comparative period
in the previous year. For further information, please refer to the attached tables.
3 EBITDA, free cash flow, net debt and the ratio of net debt to EBITDA are not measures in accordance with IAS/IFRS. For further
information on such non-IAS/IFRS measures, please see the attached tables.
4 Comparable store sales reflect the change in sales from one period to another that, for comparison purposes, includes in the
calculation only stores open in the more recent period that also were open during the comparable prior period, and applies to both
periods the average exchange rate for the prior period and the same geographic area.
5. 5
Luxottica Group S.p.A.
Luxottica Group is a global leader in premium fashion, luxury and sports eyewear with more
than 6,300 optical and sun retail stores in North America, Asia-Pacific, China, South Africa and
Europe and a strong and well-balanced brand portfolio. Luxottica’s key house brands include
Ray-Ban, the best-known sun eyewear brand in the world, Oakley, Vogue, Persol, Oliver
Peoples, Arnette and REVO, while license brands include Bvlgari, Burberry, Chanel, Dolce &
Gabbana, Donna Karan, Polo Ralph Lauren, Prada, Salvatore Ferragamo, Tiffany and Versace. In
addition to a global wholesale network covering 130 different countries, the Group manages
leading retail brands such as LensCrafters, Pearle Vision and ILORI in North America, OPSM and
Laubman & Pank in Asia-Pacific, LensCrafters in China and Sunglass Hut globally. The Group's
products are designed and manufactured at its six manufacturing plants in Italy, two wholly-
owned plants in China and a sport sunglass production facility in the US. In 2009, Luxottica
Group posted consolidated net sales of €5.1 billion. Additional information about the Group is
available at www.luxottica.com.
Safe Harbor Statement
Certain statements in this press release may constitute “forward looking statements” as defined
in the Private Securities Litigation Reform Act of 1995. Such statements involve risks,
uncertainties and other factors that could cause actual results to differ materially from those
which are anticipated. Such risks and uncertainties include, but are not limited to, our ability to
manage the effect of the uncertain current global economic conditions on our business, our
ability to successfully acquire new businesses and integrate their operations, our ability to
predict future economic conditions and changes in consumer preferences, our ability to
successfully introduce and market new products, our ability to maintain an efficient distribution
network, our ability to achieve and manage growth, our ability to negotiate and maintain
favorable license arrangements, the availability of correction alternatives to prescription
eyeglasses, fluctuations in exchange rates, changes in local conditions, our ability to protect our
proprietary rights, our ability to maintain our relationships with host stores, any failure of our
information technology, inventory and other asset risk, credit risk on our accounts, insurance
risks, changes in tax laws, as well as other political, economic, legal and technological factors
and other risks and uncertainties described in Luxottica Group’s filings with the U.S. Securities
and Exchange Commission. These forward-looking statements are made as of the date hereof
and Luxottica Group does not assume any obligation to update them.
- TABLES FOLLOW –
6. KEY FIGURES IN THOUSANDS OF EURO
(1)
2010 2009 % Change
NET SALES 1,464,732 1,223,272 19.7%
NET INCOME 101,934 75,784 34.5%
BASIC EARNINGS PER SHARE (ADS)
(2)
: 0.22 0.17 34.1%
KEY FIGURES IN THOUSANDS OF U.S. DOLLARS
(1) (3)
2010 2009 % Change
NET SALES 1,890,969 1,749,646 8.1%
NET INCOME 131,597 108,394 21.4%
BASIC EARNINGS PER SHARE (ADS)
(2)
: 0.29 0.24 21.1%
Notes : 2010 2009
(1) Except earnings per share (ADS), which are expressed in Euro and U.S. Dollars, respectively
(2) Weighted average number of outstanding shares 458,527,966 457,214,454
(3) Average exchange rate (in U.S. Dollars per Euro) 1.2910 1.4303
In accordance with IAS/IFRS
LUXOTTICA GROUP
CONSOLIDATED FINANCIAL HIGHLIGHTS
FOR THE THREE-MONTH PERIODS ENDED
SEPTEMBER 30, 2010 AND SEPTEMBER 30, 2009
Luxottica Group 3Q10, Table 1 of 6
7. KEY FIGURES IN THOUSANDS OF EURO
(1)
2010 2009 % Change
NET SALES 4,451,542 3,937,233 13.1%
NET INCOME 347,077 269,869 28.6%
BASIC EARNINGS PER SHARE (ADS)
(2)
0.76 0.59 28.2%
KEY FIGURES IN THOUSANDS OF U.S. DOLLARS
(1) (3)
2010 2009 % Change
NET SALES 5,851,552 5,379,048 8.8%
NET INCOME 456,233 368,695 23.7%
BASIC EARNINGS PER SHARE (ADS)
(2)
0.99 0.81 23.4%
Notes : 2010 2009
(1) Except earnings per share (ADS), which are expressed in Euro and U.S. Dollars, respectively
(2) Weighted average number of outstanding shares 458,544,153 457,108,193
(3) Average exchange rate (in U.S. Dollars per Euro) 1.3145 1.3662
In accordance with IAS/IFRS
LUXOTTICA GROUP
CONSOLIDATED FINANCIAL HIGHLIGHTS
FOR THE NINE-MONTH PERIODS ENDED
SEPTEMBER 30, 2010 AND SEPTEMBER 30, 2009
Luxottica Group 3Q10, Table 2 of 6
8. In thousands of Euro
(1)
3Q 10 % of sales 3Q 09 % of sales % Change
NET SALES 1,464,732 100.0% 1,223,272 100.0% 19.7%
COST OF SALES (499,849) (420,784)
GROSS PROFIT 964,883 65.9% 802,488 65.6% 20.2%
OPERATING EXPENSES:
SELLING EXPENSES (490,264) (412,049)
ROYALTIES (22,012) (20,342)
ADVERTISING EXPENSES (89,967) (73,246)
GENERAL AND ADMINISTRATIVE EXPENSES (154,907) (137,217)
TRADEMARK AMORTIZATION (21,297) (20,072)
TOTAL (778,447) (662,925)
OPERATING INCOME 186,436 12.7% 139,563 11.4% 33.6%
OTHER INCOME (EXPENSE):
INTEREST EXPENSES (26,929) (29,663)
INTEREST INCOME 2,543 954
OTHER - NET (1,120) 2,087
OTHER INCOME (EXPENSES)-NET (25,507) (26,621)
INCOME BEFORE PROVISION FOR
INCOME TAXES 160,929 11.0% 112,941 9.2% 42.5%
PROVISION FOR INCOME TAXES (58,229) (36,142)
NET INCOME 102,700 76,800
LESS: NET INCOME ATTRIBUTABLE TO NONCONTROLLING
INTEREST (766) (1,016)
NET INCOME ATTRIBUTABLE TO
LUXOTTICA GROUP SHAREHOLDERS 101,934 7.0% 75,784 6.2% 34.5%
BASIC EARNINGS PER SHARE (ADS): 0.22 0.17
FULLY DILUTED EARNINGS PER SHARE (ADS): 0.22 0.17
WEIGHTED AVERAGE NUMBER OF
OUTSTANDING SHARES 458,527,966 457,214,454
FULLY DILUTED AVERAGE NUMBER OF SHARES 460,152,396 458,303,432
Notes :
(1) Except earnings per share (ADS), which are expressed in Euro
In accordance with IAS/IFRS
(2) Certain figures from 2008 have been reclassified to conform to the 2009 presentation
LUXOTTICA GROUP
CONSOLIDATED INCOME STATEMENT
FOR THE THREE-MONTH PERIODS ENDED
SEPTEMBER 30, 2010 AND SEPTEMBER 30, 2009
Luxottica Group 3Q10, Table 3 of 6
9. In thousands of Euro
(1)
2010 % of sales 2009 % of sales % Change
NET SALES 4,451,542 100.0% 3,937,233 100.0% 13.1%
COST OF SALES (1,529,395) (1,352,480)
GROSS PROFIT 2,922,148 65.6% 2,584,752 65.6% 13.1%
OPERATING EXPENSES:
SELLING EXPENSES (1,427,794) (1,281,290)
ROYALTIES (74,512) (74,509)
ADVERTISING EXPENSES (286,455) (245,410)
GENERAL AND ADMINISTRATIVE EXPENSES (454,547) (425,227)
TRADEMARK AMORTIZATION (62,829) (61,266)
TOTAL (2,306,136) (2,087,703)
OPERATING INCOME 616,012 13.8% 497,049 12.6% 23.9%
OTHER INCOME (EXPENSE):
INTEREST EXPENSES (78,500) (79,307)
INTEREST INCOME 5,824 4,322
OTHER - NET (5,872) (1,905)
OTHER INCOME (EXPENSES)-NET (78,548) (76,890)
INCOME BEFORE PROVISION FOR
INCOME TAXES 537,464 12.1% 420,159 10.7% 27.9%
PROVISION FOR INCOME TAXES (186,202) (145,308)
NET INCOME 351,262 274,852
LESS: NET INCOME ATTRIBUTABLE TO NONCONTROLLING
INTEREST (4,185) (4,983)
NET INCOME ATTRIBUTABLE TO
LUXOTTICA GROUP SHAREHOLDERS 347,077 7.8% 269,869 6.9% 28.6%
BASIC EARNINGS PER SHARE (ADS): 0.76 0.59
FULLY DILUTED EARNINGS PER SHARE (ADS): 0.75 0.59
WEIGHTED AVERAGE NUMBER OF
OUTSTANDING SHARES 458,544,153 457,108,193
FULLY DILUTED AVERAGE NUMBER OF SHARES 460,249,173 457,661,787
Notes :
(1) Except earnings per share (ADS), which are expressed in Euro
LUXOTTICA GROUP
CONSOLIDATED INCOME STATEMENT
FOR THE NINE-MONTH PERIODS ENDED
SEPTEMBER 30, 2010 AND SEPTEMBER 30, 2009
(2) certain amounts of 2009 have been reclassified to conform to 2010 presentation
In accordance with IAS/IFRS
Luxottica Group 3Q10, Table 4 of 6
10. In thousands of Euro September 30, 2010 December 31, 2009
CURRENT ASSETS:
CASH AND CASH EQUIVALENTS 482,943 380,081
MARKETABLE SECURITIES 25,330
ACCOUNTS RECEIVABLE - NET 665,332 618,884
SALES AND INCOME TAXES RECEIVABLE 24,512 59,516
INVENTORIES - NET 562,047 524,663
PREPAID EXPENSES AND OTHER 143,404 138,849
DEFERRED TAX ASSETS - CURRENT
TOTAL CURRENT ASSETS 1,903,577 1,721,993
PROPERTY, PLANT AND EQUIPMENT - NET 1,167,933 1,149,972
OTHER ASSETS
INTANGIBLE ASSETS - NET 3,992,926 3,838,715
INVESTMENTS 51,454 46,317
OTHER ASSETS 147,893 146,626
SALES AND INCOME TAXES RECEIVABLE 1,191 965
DEFERRED TAX ASSETS - NON-CURRENT 380,304 356,706
TOTAL OTHER ASSETS 4,573,768 4,389,329
TOTAL 7,645,278 7,261,294
CURRENT LIABILITIES:
BANK OVERDRAFTS 221,956 148,951
CURRENT PORTION OF LONG-TERM DEBT 135,142 166,279
ACCOUNTS PAYABLE 415,576 434,604
ACCRUED EXPENSES AND OTHER 483,752 526,801
ACCRUAL FOR CUSTOMERS' RIGHT OF RETURN 31,335 27,334
INCOME TAXES PAYABLE 88,044 11,204
TOTAL CURRENT LIABILITIES 1,375,805 1,315,174
LONG-TERM LIABILITIES:
LONG-TERM DEBT 2,394,627 2,401,796
LIABILITY FOR TERMINATION INDEMNITIES 42,755 44,633
DEFERRED TAX LIABILITIES - NON-CURRENT 403,224 396,048
OTHER LONG-TERM LIABILITIES 315,495 350,028
TOTAL LIABILITIES 4,531,905 4,507,679
EQUITY:
465,222,483 ORDINARY SHARES AUTHORIZED AND ISSUED - 458,768,198 SHARES
OUTSTANDING 27,913 27,863
NET INCOME ATTRIBUTABLE TO LUXOTTICA GROUP SHAREHOLDERS 347,077 299,122
RETAINED EARNINGS 2,726,292 2,410,253
TOTAL LUXOTTICA GROUP SHAREHOLDERS' EQUITY 3,101,281 2,737,239
NONCONTROLLING INTEREST 12,091 16,376
TOTAL EQUITY 3,113,373 2,753,615
TOTAL 7,645,278 7,261,294
LUXOTTICA GROUP
CONSOLIDATED BALANCE SHEET
AS OF SEPTEMBER 30, 2010 AND DECEMBER 31, 2009
In accordance with IAS/IFRS
Luxottica Group 3Q10, Table 5 of 6
11. In thousands of Euro Manufacturing
and
Wholesale
Retail
Inter-Segment
Transactions and
Corporate Adj.
Consolidated
2010
Net Sales 1,722,947 2,728,595 4,451,542
Operating Income 372,235 353,877 (110,101) 616,012
% of sales 21.6% 13.0% 13.8%
Capital Expenditures 59,556 79,709 139,264
Depreciation & Amortization 58,297 104,317 62,829 225,442
2009
Net Sales 1,506,468 2,430,764 3,937,233
Operating income 296,069 310,707 (109,726) 497,049
% of sales 19.7% 12.8% 12.6%
Capital Expenditures 52,490 78,578 131,068
Depreciation & Amortization 55,915 97,031 61,266 214,212
SEPTEMBER 30, 2010 AND SEPTEMBER 30, 2009
LUXOTTICA GROUP
CONSOLIDATED FINANCIAL HIGHLIGHTS
FOR THE NINE-MONTH PERIODS ENDED
- SEGMENTAL INFORMATION -
In accordance with IAS/IFRS
Luxottica Group 3Q10, Table 6 of 6
12. Major currencies
Three months ended Nine Months ended Twelve months ended Three months ended Nine months ended
September 30, 2009 September 30, 2009 December 31, 2009 September 30, 2010 September 30, 2010
Average exchange rates
per € 1
US$ 1.43030 1.36618 1.39467 1.29104 1.31453
AUD 1.71689 1.82338 1.77281 1.42885 1.46555
GBP 0.87161 0.88633 0.89104 0.83305 0.85730
CNY 9.77019 9.33414 9.52693 8.73875 8.94742
JPY 133.81712 129.50037 130.31404 110.67500 117.66057
13. Non-IAS/IFRS Measure: EBITDA and EBITDA margin
EBITDA represents net income before non-controlling interest, taxes, other income/expense, depreciation and amortization. EBITDA margin means EBITDA divided by net sales.
The Company believes that EBITDA is useful to both management and investors in evaluating the Company’s operating performance compared with that of other companies in its industry.
Our calculation of EBITDA allows us to compare our operating results with those of other companies without giving effect to financing, income taxes
and the accounting effects of capital spending, which items may vary for different companies for reasons unrelated to the overall operating performance of a company’s business.
EBITDA and EBITDA margin are not measures of performance under International Financial Reporting Standards as issued by the International Accounting Standards Board (IAS/IFRS).
We include them in this presentation in order to:
* improve transparency for investors;
* assist investors in their assessment of the Company’s operating performance and its ability to refinance its debt as it matures and incur additional indebtedness to invest in new business opportunities;
* assist investors in their assessment of the Company’s cost of debt;
* ensure that these measures are fully understood in light of how the Company evaluates its operating results and leverage;
* properly define the metrics used and confirm their calculation; and
* share these measures with all investors at the same time.
EBITDA and EBITDA margin are not meant to be considered in isolation or as a substitute for items appearing on our financial statements prepared in accordance with IAS/IFRS.
Rather, these non-IAS/IFRS measures should be used as a supplement to IAS/IFRS results to assist the reader in better understanding the operational performance of the Company.
The Company cautions that these measures are not defined terms under IAS/IFRS and their definitions should be carefully reviewed and understood by investors.
Investors should be aware that Luxottica Group’s method of calculating EBITDA may differ from methods used by other companies. The Company recognizes that the usefulness of EBITDA has certain limitations, including:
* EBITDA does not include interest expense. Because we have borrowed money in order to finance our operations, interest expense is a necessary element of our costs and ability to generate profits and cash flows.
Therefore, any measure that excludes interest expense may have material limitations;
* EBITDA does not include depreciation and amortization expense. Because we use capital assets, depreciation and amortization expense is a necessary element of our costs and ability to generate profits.
Therefore, any measure that excludes depreciation and expense may have material limitations;
* EBITDA does not include provision for income taxes. Because the payment of income taxes is a necessary element of our costs, any measure that excludes tax expense may have material limitations;
* EBITDA does not reflect cash expenditures or future requirements for capital expenditures or contractual commitments;
* EBITDA does not reflect changes in, or cash requirements for, working capital needs;
* EBITDA does not allow us to analyze the effect of certain recurring and non-recurring items that materially affect our net income or loss.
We compensate for the foregoing limitations by using EBITDA as a comparative tool, together with IAS/IFRS measurements, to assist in the evaluation of our operating performance and leverage.
See the tables on the following pages for a reconciliation of EBITDA to net income, which is the most directly comparable IAS/IFRS financial measure, as well as the calculation of EBITDA margin on net sales.
14. Non-IAS/IFRS Measure: EBITDA and EBITDA margin
Millions of Euro
3Q 2010 3Q 2009 9M 2010 9M 2009 FY09
LTM September
30, 2010
Net income/(loss) 101.9 75.8 347.1 269.9 299.1 376.3
(+)
Net income attributable to non-controlling interest 0.8 1.0 4.2 5.0 5.8 5.0
(+)
Provision for income taxes 58.2 36.1 186.2 145.3 159.9 200.8
(+)
Other (income)/expense 25.5 26.6 78.5 76.9 106.3 108.0
(+)
Depreciation & amortization 77.0 70.2 225.4 214.2 285.4 296.7
(+)
EBITDA 263.5 209.8 841.5 711.3 856.5 986.7
(=)
Net sales 1,464.7 1,223.3 4,451.5 3,937.2 5,094.3 5,608.6
(/)
EBITDA margin 18.0% 17.1% 18.9% 18.1% 16.8% 17.6%
(=)
15. Non-IAS/IFRS Measure: Net Debt to EBITDA ratio
Net debt to EBITDA ratio: Net debt means the sum of bank overdrafts, current portion of long-term debt and long-term debt, less cash. EBITDA represents net income before non-controlling interest, taxes, other income/expense, depreciation and amortization.
The Company believes that EBITDA is useful to both management and investors in evaluating the Company’s operating performance compared with that of other companies in its industry.
Our calculation of EBITDA allows us to compare our operating results with those of other companies without giving effect to financing, income taxes and the accounting effects of capital spending,
which items may vary for different companies for reasons unrelated to the overall operating performance of a company’s business. The ratio of net debt to EBITDA is a measure used by management to assess
the Company’s level of leverage, which affects our ability to refinance our debt as it matures and incur additional indebtedness to invest in new business opportunities.
The ratio also allows management to assess the cost of existing debt since it affects the interest rates charged by the Company’s lenders.
EBITDA and ratio of net debt to EBITDA are not measures of performance under International Financial Reporting Standards as issued by the International Accounting Standards Board (IAS/IFRS).
We include them in this presentation in order to:
* improve transparency for investors;
* assist investors in their assessment of the Company’s operating performance and its ability to refinance its debt as it matures and incur additional indebtedness to invest in new business opportunities;
* assist investors in their assessment of the Company’s cost of debt;
* ensure that these measures are fully understood in light of how the Company evaluates its operating results and leverage;
* properly define the metrics used and confirm their calculation; and
* share these measures with all investors at the same time.
EBITDA and ratio of net debt to EBITDA are not meant to be considered in isolation or as a substitute for items appearing on our financial statements prepared in accordance with IAS/IFRS.
Rather, these non-IAS/IFRS measures should be used as a supplement to IAS/IFRS results to assist the reader in better understanding the operational performance of the Company.
The Company cautions that these measures are not defined terms under IAS/IFRS and their definitions should be carefully reviewed and understood by investors.
Investors should be aware that Luxottica Group’s method of calculating EBITDA and the ratio of net debt to EBITDA may differ from methods used by other companies.
The Company recognizes that the usefulness of EBITDA and the ratio of net debt to EBITDA as evaluative tools may have certain limitations, including:
* EBITDA does not include interest expense. Because we have borrowed money in order to finance our operations, interest expense is a necessary element of our costs and ability to generate profits and cash flows.
Therefore, any measure that excludes interest expense may have material limitations;
* EBITDA does not include depreciation and amortization expense. Because we use capital assets, depreciation and amortization expense is a necessary element of our costs and ability to generate profits.
Therefore, any measure that excludes depreciation and expense may have material limitations;
* EBITDA does not include provision for income taxes. Because the payment of income taxes is a necessary element of our costs, any measure that excludes tax expense may have material limitations;
* EBITDA does not reflect cash expenditures or future requirements for capital expenditures or contractual commitments;
* EBITDA does not reflect changes in, or cash requirements for, working capital needs;
* EBITDA does not allow us to analyze the effect of certain recurring and non-recurring items that materially affect our net income or loss; and
* The ratio of net debt to EBITDA is net of cash and cash equivalents, restricted cash and short-term investments, thereby reducing our debt position.
Because we may not be able to use our cash to reduce our debt on a dollar-for-dollar basis, this measure may have material limitations.
We compensate for the foregoing limitations by using EBITDA and the ratio of net debt to EBITDA as two of several comparative tools, together with IAS/IFRS measurements, to assist in the evaluation of our operating performance and leverage.
See the tables on the following pages for a reconciliation of net debt to long-term debt, which is the most directly comparable IAS/IFRS financial measure, as well as the calculation of the ratio of net debt to EBITDA.
For a reconciliation of EBITDA to net income, which is the most directly comparable IAS/IFRS financial measure, see the tables on the preceding pages.
16. Non-IAS/IFRS Measure: Net debt and Net debt / EBITDA
Millions of Euro
September 30, 2010 Dec 31, 2009
Long-term debt 2,394.6 2,401.8
(+)
Current portion of long-term debt (+) 135.1 166.3
(+)
Bank overdrafts (+) 222.0 149.0
Cash (-) (482.9) (380.1)
Net debt (=) 2,268.8 2,336.9
LTM EBITDA 986.7 856.5
Net debt/LTM EBITDA 2.3x 2.7x
Net debt @ avg. exchange rates
(1)
2,274.7 2,381.7
Net debt @ avg. exchange rates
(1)
/LTM EBITDA 2.3x 2.8x
1. Net debt figures are calculated using the average exchange rates used to calculate the EBITDA figures
17. Non-IAS/IFRS Measures: Free Cash Flow
Free cash flow net represents net income before non-controlling interest, taxes, other income/espense,depreciation and amortization (i.e. EBITDA – see table on the earlier page) plus or minus the decrease/(increase)
in working capital over the prior period, less capital expenditures, plus or minus interest income/(expense) and extraordinary items, minus taxes paid. The Company believes that free cash flow is useful to both management
and investors in evaluating the Company’s operating performance compared with other companies in its industry. In particular, our calculation of free cash flow provides a clearer picture of the
Company’s ability to generate net cash from operations, which is used for mandatory debt service requirements, to fund discretionary investments, pay dividends or pursue other strategic opportunities.
Free cash flow is not a measure of performance under International Financial Reporting Standards as issued by the International Accounting Standards Board (IAS/IFRS).
We include it in this presentation in order to:
* Improve transparency for investors;
* Assist investors in their assessment of the Company’s operating performance and its ability to generate cash from operations in excess of its cash expenses;
* Ensure that this measure is fully understood in light of how the Company evaluates its operating results;
* Properly define the metrics used and confirm their calculation; and
* Share this measure with all investors at the same time.
Free cash flow is not meant to be considered in isolation or as a substitute for items appearing on our financial statements prepared in accordance with IAS/IFRS.
Rather, this non-IAS/IFRS measure should be used as a supplement to IAS/IFRS results to assist the reader in better understanding the operational performance of the Company.
The Company cautions that this measure is not a defined term under IAS/IFRS and its definition should be carefully reviewed and understood by investors.
Investors should be aware that Luxottica Group’s method of calculation of free cash flow may differ from methods used by other companies.
The Company recognizes that the usefulness of free cash flow as an evaluative tool may have certain limitations, including:
• The manner in which the Company calculates free cash flow may differ from that of other companies, which limits its usefulness as a comparative measure;
• Free cash flow does not represent the total increase or decrease in the net debt balance for the period since it excludes, among other things, cash
used for funding discretionary investments and to pursue strategic opportunities during the period and any impact of the exchange rate changes; and
• Free cash flow can be subject to adjustment at the Company’s discretion if the Company takes steps or adopts policies that increase or diminish its current liabilities and/or changes to working capital.
We compensate for the foregoing limitations by using free cash flow as one of several comparative tools, together with IAS/IFRS measurements, to assist in the evaluation of our operating performance.
See the table on the following page for a reconciliation of free cash flow to EBITDA and the table on the earlier page for a reconciliation of EBITDA to net income,
which is the most directly comparable IAS/IFRS financial measure.
18. Non-IAS/IFRS Measure: Free cash flow
Millions of Euro
3Q 2010
EBITDA
(1)
263.5
Δ working capital 90.7
Capex (56.4)
Operating cash flow 297.8
Financial charges
(2)
(24.4)
Taxes (20.1)
Extraordinary charges
(3)
(1.1)
Free cash flow 252.2
1. EBITDA is not an IAS/IFRS measure; please see table on the earlier page for a reconciliation of EBITDA to net income
2. Equals interest income minus interest expense
3. Equals extraordinary income minus extraordinary expense