K bank fx & rates strategies expect higher floating rates
1. Economics /
.Mean S FX & Rates Strategies
KBank Strategy
Expect higher floating rates FX / Rates
17 February 2011
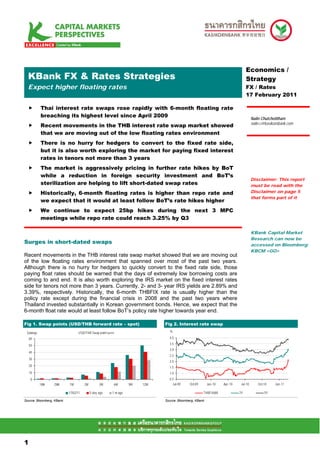
Thai interest rate swaps rose rapidly with 6-month floating rate
breaching its highest level since April 2009 Nalin Chutchotitham
nalin.c@kasikornbank.com
Recent movements in the THB interest rate swap market showed
that we are moving out of the low floating rates environment
There is no hurry for hedgers to convert to the fixed rate side,
but it is also worth exploring the market for paying fixed interest
rates in tenors not more than 3 years
The market is aggressively pricing in further rate hikes by BoT
while a reduction in foreign security investment and BoT’s
Disclaimer: This report
sterilization are helping to lift short-dated swap rates must be read with the
Historically, 6-month floating rates is higher than repo rate and Disclaimer on page 5
that forms part of it
we expect that it would at least follow BoT’s rate hikes higher
We continue to expect 25bp hikes during the next 3 MPC
meetings while repo rate could reach 3.25% by Q3
KBank Capital Market
Research can now be
Surges in short-dated swaps accessed on Bloomberg:
KBCM <GO>
Recent movements in the THB interest rate swap market showed that we are moving out
of the low floating rates environment that spanned over most of the past two years.
Although there is no hurry for hedgers to quickly convert to the fixed rate side, those
paying float rates should be warned that the days of extremely low borrowing costs are
coming to and end. It is also worth exploring the IRS market on the fixed interest rates
side for tenors not more than 3 years. Currently, 2- and 3- year IRS yields are 2.89% and
3.39%, respectively. Historically, the 6-month THBFIX rate is usually higher than the
policy rate except during the financial crisis in 2008 and the past two years where
Thailand invested substantially in Korean government bonds. Hence, we expect that the
6-month float rate would at least follow BoT’s policy rate higher towards year end.
Fig 1. Swap points (USD/THB forward rate – spot) Fig 2. Interest rate swap
Satangs USD/THB Swap point curve %
60 4.0
50 3.5
3.0
40
2.5
30
2.0
20 1.5
10 1.0
0 0.5
1Wk 2Wk 1M 2M 3M 6M 9M 12M Jul-09 Oct-09 Jan-10 Apr-10 Jul-10 Oct-10 Jan-11
17/02/11 5-day ago 1-m ago THBFIX6M 2Y 5Y
Source: Bloomberg, KBank Source: Bloomberg, KBank
11
1
2. Thomson Reuters calculation methodology for THB interest rate fixing
THBFIX = ( { ( [1+(Fwd/Spot)] x [1+(Sibor x Days/360)] ) -1} x 365/Days)x100
Note – The formula above is derived from an economic concept called the interest rate parity condition. It states that, under no-arbitrage condition, (1
+ i$) = (F/S)(1+ ic) where i$ and ic are the interest rates of two countries and F and S are the forward and spot exchange rates between them. Such a
condition says that returns for depositing money in either currency would not be different, given the stated foreign exchange rates and interest rates.
Source: Reuters
Table 1. Factors affecting the surge in short-term rates
Factors Effects
Recent comments from the BoT had been more hawkish, especially after the minutes of
January’s MPC meeting showed some members of the MPC contemplated 50bp hike in future
policy rate moves.
Inflation is the key theme in global recovery now, especially for the Asian economies where
output gaps had started to close and many of the developing economies have higher
sensitivity to food price inflation as compared to the developed economies.
Expectation of monetary
tightening The changing of forward rate of USD/THB does not only reflect market’s expectation of
USD/THB value in the future alone. In fact, it is used very often to reflect a view on short-term
interest rate changes. This is because the THBFIX rates are calculated using 3 variables – the
USD Sibor, USD/THB spot rate and USD/THB forward rates. Taking the view that USD Sibor
rates would see little change going forward (the Federal Reserve likely to keep its policy rate
unchanged for at least another year) but that BoT’s policy rate would rise by 75-100bp in the
next 6 months or so, the market quotes higher forward rates for USD/THB, indicating
increasing borrowing cost for Thai baht relative to previous periods.
The BoT has recently increased its presence in the FX swap market as an alternative to
issuing short-term central bank bills to absorb liquidity in the market after intervention in the
USD/THB spot market. What the BoT does is putting back U.S. dollar liquidity into the market
BoT FX intervention by swapping out USD for THB i.e. sell-buy USD/THB. The result of such transactions is an
increase in the demand for buying USD in the future, lifting the forward points or swap points
higher. We notice further that the BoT’s foreign exchange forward position continued to
increase, although not at a rapid pace compared to last year.
The demand for hedging foreign exchange risk by exporters and importers in certain periods
can affect movements in the THBFIX rates as well, especially when the sell-buy and buy-sell
volume have substantial differences.
Exporters would usually have a demand to sell USD forward to hedge baht’s appreciation risk
Exporters and Importers while importers would buy USD forward in order to cap the price of the USD when needed to
FX hedging purchase products from abroad.
In the year 2010, demand from importers had been less due to a clearer declining direction of
the USD/THB. However, there had been continued demand from exporters to hedge their
revenue in baht terms, providing demand for selling the USD forward and thus helping to keep
USD/THB forward rates in range.
Investment by Thai residents in Korean bonds and a few other countries’ securities in the past
two years had been substantial. When mutual funds perform foreign security-buying and FX
hedging transactions, they create a demand for selling USD forward in the market. By saying
that, we may have skipped a few steps in asset-swap transaction but all in all, these
transactions helped to push USD/THB forward rates lower. (commercial banks borrow USD in
Thai residents’
the interbank market for mutual funds and return at a later date, causing an increased demand
investment in foreign
for buy-sell USD/THB transactions, especially for T/N to 3-month tenors)
securities
A figure below would show that the pick up in returns from investing in Korean government
bonds relative to investing in local government debt had diminished markedly. Hence, local
mutual funds had been repatriating the funds without further re-investment, causing a decline
in selling USD forward.
22
2
3. Fig 3. Policy rate vs. THBFIX 6m Fig 4. BoT forward position in FX and USD/THB
% $ bn
6.0 25 29
repo THBFIX6M
30
5.0 20
31
4.0 15 32
33
3.0 10 34
35
2.0 5
36
1.0 0 37
Feb-07 Aug-07 Feb-08 Aug-08 Feb-09 Aug-09 Feb-10 Aug-10 Feb-11
0.0
Jan-06 Jan-07 Jan-08 Jan-09 Jan-10 Jan-11 USD/THB (inverted, RHS) BoT Forward position (LHS)
Source: Bloomberg,, KBank Source: Bloomberg, KBank
Fig 5. Bond-swap spread still negative below 2Y Fig 6. IRS market over the past month
bp % % IRS yield curve change bp
80 5.0 5.0 160
60 4.5 140
4.0
40 4.0 120
3.0 100
20 3.5
80
0 3.0 2.0 60
-20 2.5 40
1.0
-40 2.0 20
tenor (yrs)
-60 1.5 0.0 0
0.3 0.5 0.8 1.0 2.0 3.0 4.0 5.0 6.0 7.0 8.0 9.0 10.0 12.0 14.0 15.0 0.1 0.2 0.3 0.5 0.8 1.0 2.0 3.0 4.0 5.0 7.0 12.0 10.0 15.0 20.0 yrs
Spread (right axis) Bond curve IRS curve Change (right axis, bps) 17-Feb-11 17-Jan-11
Source: Bloomberg, KBank Source: Bloomberg, KBank
Fig 7. Expected returns in KRW bond investment Fig 8. Market expectation of policy rate hikes in Asia
% bp expected change in short-term rate next 12m (bp) CPI % yoy %
9 250 10
8 Philippines
7 200 8
6
5 Indonesia
4 150 6
Thailand South Korea
3
2 100 4
Australia India
1
Taiwan Hong Kong China
0
50 Malaysia 2
Jan-08 Jul-08 Jan-09 Jul-09 Jan-10 Jul-10 Jan-11 Japan Singapore
1Y Thai bond yield Approximate return on 1Y KRW ASW 0 0
Source: Bloomberg, KBank Source: Bloomberg, KBank
33
3
5. Disclaimer
For private circulation only. The foregoing is for informational purposes only and not to be considered as an offer to buy or
sell, or a solicitation of an offer to buy or sell any security. Although the information herein was obtained from sources we
believe to be reliable, we do not guarantee its accuracy nor do we assume responsibility for any error or mistake contained
herein. Further information on the securities referred to herein may be obtained upon request.
55
5

![Thomson Reuters calculation methodology for THB interest rate fixing
THBFIX = ( { ( [1+(Fwd/Spot)] x [1+(Sibor x Days/360)] ) -1} x 365/Days)x100
Note – The formula above is derived from an economic concept called the interest rate parity condition. It states that, under no-arbitrage condition, (1
+ i$) = (F/S)(1+ ic) where i$ and ic are the interest rates of two countries and F and S are the forward and spot exchange rates between them. Such a
condition says that returns for depositing money in either currency would not be different, given the stated foreign exchange rates and interest rates.
Source: Reuters
Table 1. Factors affecting the surge in short-term rates
Factors Effects
Recent comments from the BoT had been more hawkish, especially after the minutes of
January’s MPC meeting showed some members of the MPC contemplated 50bp hike in future
policy rate moves.
Inflation is the key theme in global recovery now, especially for the Asian economies where
output gaps had started to close and many of the developing economies have higher
sensitivity to food price inflation as compared to the developed economies.
Expectation of monetary
tightening The changing of forward rate of USD/THB does not only reflect market’s expectation of
USD/THB value in the future alone. In fact, it is used very often to reflect a view on short-term
interest rate changes. This is because the THBFIX rates are calculated using 3 variables – the
USD Sibor, USD/THB spot rate and USD/THB forward rates. Taking the view that USD Sibor
rates would see little change going forward (the Federal Reserve likely to keep its policy rate
unchanged for at least another year) but that BoT’s policy rate would rise by 75-100bp in the
next 6 months or so, the market quotes higher forward rates for USD/THB, indicating
increasing borrowing cost for Thai baht relative to previous periods.
The BoT has recently increased its presence in the FX swap market as an alternative to
issuing short-term central bank bills to absorb liquidity in the market after intervention in the
USD/THB spot market. What the BoT does is putting back U.S. dollar liquidity into the market
BoT FX intervention by swapping out USD for THB i.e. sell-buy USD/THB. The result of such transactions is an
increase in the demand for buying USD in the future, lifting the forward points or swap points
higher. We notice further that the BoT’s foreign exchange forward position continued to
increase, although not at a rapid pace compared to last year.
The demand for hedging foreign exchange risk by exporters and importers in certain periods
can affect movements in the THBFIX rates as well, especially when the sell-buy and buy-sell
volume have substantial differences.
Exporters would usually have a demand to sell USD forward to hedge baht’s appreciation risk
Exporters and Importers while importers would buy USD forward in order to cap the price of the USD when needed to
FX hedging purchase products from abroad.
In the year 2010, demand from importers had been less due to a clearer declining direction of
the USD/THB. However, there had been continued demand from exporters to hedge their
revenue in baht terms, providing demand for selling the USD forward and thus helping to keep
USD/THB forward rates in range.
Investment by Thai residents in Korean bonds and a few other countries’ securities in the past
two years had been substantial. When mutual funds perform foreign security-buying and FX
hedging transactions, they create a demand for selling USD forward in the market. By saying
that, we may have skipped a few steps in asset-swap transaction but all in all, these
transactions helped to push USD/THB forward rates lower. (commercial banks borrow USD in
Thai residents’
the interbank market for mutual funds and return at a later date, causing an increased demand
investment in foreign
for buy-sell USD/THB transactions, especially for T/N to 3-month tenors)
securities
A figure below would show that the pick up in returns from investing in Korean government
bonds relative to investing in local government debt had diminished markedly. Hence, local
mutual funds had been repatriating the funds without further re-investment, causing a decline
in selling USD forward.
22
2](data:image/gif;base64,R0lGODlhAQABAIAAAAAAAP///yH5BAEAAAAALAAAAAABAAEAAAIBRAA7)