SlideShare a Scribd company logo
1 of 22
Download to read offline
POPUL ATION REFERENCE BUREAU
2016 WORLD POPULATION DATA SHEET
WITH A SPECIAL FOCUS ON HUMAN NEEDS
AND SUSTAINABLE RESOURCES
18%
The percentage of energy
consumed globally from
renewable sources,
including hydro power.
7.4
billion
The world population
in 2016.
526
Average global population
per square kilometer of
arable land—239 in more
developed countries, 697
in less developed.
I N F O R M | E M P O W E R | A D V A N C E | w w w . p r b . o r g
View the Digital Data Sheet at www.worldpopdata.org
© 2016 Population Reference Bureau See notes on page 20 2016 WORLD POPULATION DATA SHEET 2
NOTE: 2016 data refer to latest data available.
COUNTRY, 2050
POPULATION
(MILLIONS)
India 1,708
China 1,344
United States 398
Nigeria 398
Indonesia 360
Pakistan 344
Brazil 226
Congo, Dem. Rep. 214
Bangladesh 202
Egypt 169
COUNTRY, 2016
POPULATION
(MILLIONS)
China 1,378
India 1,329
United States 324
Indonesia 259
Brazil 206
Pakistan 203
Nigeria 187
Bangladesh 163
Russia 144
Mexico 129
HIGHEST
Niger 7.6
South Sudan 6.7
Congo, Dem. Rep. 6.5
Chad 6.4
Somalia 6.4
Burundi 6.1
Angola 6.0
Mali 6.0
Mozambique 5.9
Uganda 5.8
LOWEST
Korea, South 1.2
Romania 1.2
Singapore 1.2
Taiwan 1.2
Bosnia-Herzegovina 1.3
Greece 1.3
Moldova 1.3
Poland 1.3
Portugal 1.3
Spain 1.3
Most Populous Countries
Highest and Lowest Total Fertility Rates, 2016
© 2016 Population Reference Bureau See notes on page 20 2016 WORLD POPULATION DATA SHEET 3
WORLD
MORE DEVELOPED
COUNTRIES
LESS DEVELOPED
COUNTRIES
Population 7,418,151,841 1,254,309,821 6,163,842,020
Births per
Year 147,183,065 13,714,857 133,468,215
Day 403,241 37,575 365,666
Minute 280 26 254
Deaths per
Year 57,387,752 12,580,616 44,807,108
Day 157,227 34,467 122,759
Minute 109 24 85
Natural
increase per
Year 89,795,313 1,134,242 88,661,107
Day 246,015 3,108 242,907
Minute 171 2 169
Infant
deaths per
Year 5,226,233 65,229 5,160,998
Day 14,318 179 14,140
Minute 10 0.1 10
Population Clock, 2016
© 2016 Population Reference Bureau  2016 WORLD POPULATION DATA SHEET 4
W O R L D P O P U L AT I O N H I G H L I G H T S
FOCUS ON HUMAN NEEDS AND SUSTAINABLE RESOURCES
U.S. Air Quality Improvements Led by Metro Areas
Particulate matter (PM) in the air is composed of dust, dirt, soot, smoke, and liquid droplets. Fine PM (particles smaller than 2.5
micrometers, known as PM2.5) can lodge deeply in the lungs and is hazardous to humans and to the environment. Numerous studies
have linked PM2.5 to serious health problems including irregular heartbeat, asthma, heart attack, and premature death. Particulate
matter can also pollute waterways and damage forests and crops. Air quality in the United States has improved since passage of the
Clean Air Act of 1963 and its major amendments in 1970, 1977, and 1990. Stricter emissions regulations have reduced PM2.5 pollution
nationwide, but rates of improvement have been fastest in metropolitan areas and manufacturing-dependent counties, which have
higher levels of particulate pollution from motor vehicles, power plants, and industrial activity. Although rates of improvement have been
slower in rural, mining, and agricultural areas, PM2.5 pollution remains lower than in metropolitan areas or manufacturing-dependent
counties. And while air quality has improved, U.S. public health experts believe there is no safe level of exposure to particulate matter.
Annual Average Ambient Concentration of Fine Particulate Matter (PM 2.5) in Micrograms per Cubic Meter,
Averages Across U.S. Counties
11.9
9.3
13.2
10.2
8.4
9.6
8.1
14.1
10.5
12.7
9.9
11.1
8.9
Mid to Small Metro Non-Metro/
Rural
Large MetroFarm-
Dependent
Mining-
Dependent
Manufacturing-
Dependent
National Average
2001 2011
10.0
Notes: Large Metro is defined as 1 million population or more. Mid to Small Metro is defined as metropolitan area with less than 1 million population.
Sources: U.S. Environmental Protection Agency; PRB analysis of data from Centers for Disease Control and Prevention (CDC); and U.S. Department of Agriculture,
Economic Research Service.
Middle-I
Worldwide, the hi
adoption of pollut
nations is to ensu
particulate air pol
from manufacturi
the World Health
currently is over fi
Trend in Annua
Averages Acros
1990
Upper-Middle
Lower-Middle
Low
High
27
30
21
18
WHO Recom
10
GNI per Capita:
Note: Country level PM
aggregated to income
Sources: Michael Bra
79-88; World Bank; an
Summary of Risk Asse
Municipal
OPULATION
(MILLIONS)
1,708
1,344
398
398
360
344
226
214
202
169
DEVELOPED
COUNTRIES
163,842,020
133,468,215
365,666
254
1.2
1.2
1.2
1.2
1.3
1.3
1.3
1.3
1.3
1.3
W O R L D P O P U L AT I O N
FO CUS ON HUM A N NEEDS A N D SUS T
© 2016 Population Reference Bureau  2016 WORLD POPULATION DATA SHEET 5
W O R L D P O P U L AT I O N H I G H L I G H T S
FOCUS ON HUMAN NEEDS AND SUSTAINABLE RESOURCES
2.5
s studies
culate
ge of the
.5 pollution
have
have been
pendent
e matter.
8.9
n-Metro/
Rural
ure,
Middle-Income Countries Face Biggest Air Pollution Challenge
Worldwide, the highest national-level concentrations of PM2.5 are in middle-income countries such as China and Bangladesh where
adoption of pollution control measures has lagged behind rapid industrialization. The challenge for both low-income and middle-income
nations is to ensure people have clean air to breathe without hindering development. As depicted in the accompanying U.S. graphic,
particulate air pollution in many of the world’s high-income countries has declined with shifts towards more efficient energy use and away
from manufacturing. However, no group of countries is immune to the dangers of air pollution; even the high-income average surpasses
the World Health Organization’s target of limiting the presence of PM2.5 to no more than 10 micrograms per cubic meter of air. China
currently is over five times this level, while France exceeds the recommended level by 40 percent.
Trend in Annual Average Ambient Concentration of Fine Particular Matter (PM2.5) in Micrograms per Cubic Meter,
Averages Across Countries by Income Category
1990 1995 2000 2005 2010 2013
Upper-Middle
Lower-Middle
Low
High
27
36
39
20
15
30
21
18
WHO Recommended Limit
10 10
GNI per Capita: Low-Income
$1,045 or Less
Lower Middle-Income
$1,046 to $4,125
Upper Middle-Income
$4,126 to $12,735
High-Income
$12,736 or More
Note: Country level PM2.5 estimates are calculated using satellite-based estimates, chemical transport model simulations, and ground measurements. Country estimates are
aggregated to income level groups by the World Bank.
Sources: Michael Brauer et al., “Ambient Air Pollution Exposure Estimation for the Global Burden of Disease 2013,” Environmental Science  Technology 50, no. 1 (2016):
79-88; World Bank; and World Health Organization, WHO Air Quality Guidelines for Particulate Matter, Ozone, Nitrogen Dioxide, and Sulfur Dioxide: Global Update 2005,
Summary of Risk Assessment.
L AT I O N H I G H L I G H T S
EEDS A N D SUS TA IN A BL E RE SOURCE S
© 2016 Population Reference Bureau  2016 WORLD POPULATION DATA SHEET 6
W O R L D P O P U L AT I O N H I G H L I G H T S
FOCUS ON HUMAN NEEDS AND SUSTAINABLE RESOURCES
SAN FRANCISCO, UNITED STATES
100 • 100 • 48
608
ATHENS, GREECE
100 • 100 • 24
584
ROTTERDAM, NETHERLANDS
100 • 100 • 23
551
BUENOS AIRES, ARGENTINA
96 • 97 • 8
430
GUADALAJARA, MEXICO
95 • 97 • 8
429
ADELAIDE, AUSTRALIA
100 • 100 • 54
417
BAHRAIN, BAHRAIN
100 • 100 • 8 400
SOFIA, BULGARIA
100 • 100 • 11
370
SINGAPORE, SINGAPORE
100 • 100 • 20
318
QUEZON CITY, PHILIPPINES
99 • 98 • 39257
JAKARTA, INDONESIA
95 • 84 • 10253
MONROVIA, LIBERIA
37 • 70 • 8225
LAHORE, PAKISTAN
77 • 18 • 35219
LUSAKA, ZAMBIA
63 • 45 • 14
BISHKEK, KYRGYZSTAN
83 • 0 • 18
BANGALORE, INDIA
75 • 73 • 32
201
200
200
DHAKA, BANGLADESH
55 • 55 • 15
193
KAMPALA, UGANDA
50 • 100 • 11
183
LEGEND
SOFIA, BULGARIA
100 • 100 • 11
370
Waste Collection Coverage (% of city population)
Controlled Disposal (% of collected waste properly managed)
Recycling Rate (% of total waste generated)
The volume of Annual Municipal Solid Waste (kg per
capita) is indicated by both the size of the circle and
the value in each circle.
World Bank income category of the
country where the city is located.
LOW HIGHLOWER-
MIDDLE
UPPER-
MIDDLE
Municipal Waste Volumes per Capita Rise With Income
Proper municipal waste disposal is a public health and environmental priority as urban populations grow. City residents without regular refuse collection services risk exposure to
contaminants that spread into soil, streets, and water. Uncontrolled dumpsites taint water tables and release airborne toxins as unsorted refuse is burned. Global municipal waste
data show that per capita volumes tend to rise with average income levels but negative impacts lessen as wealthier cities improve waste processing systems. While some cities in
lower-income countries have expanded collection coverage, many still lag in proper waste processing—or controlled disposal. Collection in Lahore, Pakistan covers 77 percent of the
population but only 18 percent of collections go to a controlled disposal facility. Lusaka, Zambia has 63 percent coverage and a 45 percent rate of controlled disposal. Recycling rates
reach relatively high levels in some lower-income countries, often due to informal recycling networks.
Sources: David C. Wilson, et al., “‘Wasteaware’
Benchmark Indicators for Integrated Sustainable
Waste Management in Cities,” Waste Management
35, no. 1 (2015): 329-43; United Nations
Environment Programme and International Solid
Waste Association, Global Waste Management
Outlook, David C. Wilson, ed.
© 2016 Population Reference Bureau  2016 WORLD POPULATION DATA SHEET 7
W O R L D P O P U L AT I O N H I G H L I G H T S
FOCUS ON HUMAN NEEDS AND SUSTAINABLE RESOURCES
al Land Protected
rial land under protected
national Union for
re defines a protected
fined geographical space,
d, and managed, through
e means, to achieve
vation of nature with
m services and cultural
ea includes total land
rs. Data are calculated
base on Protected
by mdgs.un.org.
are Kilometer
opulation divided
ters of arable land.
d by the UN Food and
ion (FAO) to include
orary agricultural crops
eas are counted only
adows for mowing or
market and kitchen
mporarily fallow (less
a for the percent
and the square
ry are from the FAO.
BUENOS AIRES, ARGENTINA
96 • 97 • 8
430 SOFIA, BULGARIA
100 • 100 • 11
Waste Collection Coverage (% of city p
Controlled Disposal (% of collected
Recycling Rate (% of total waste
the value in each circle.
More People Have Improved Access to Water and Sanitation
Access to safe drinking water and basic sanitation is fundamental to sustainable development and human health. Progress on
water in the past 25 years has brought access to piped water close to home (the definition of improved access) to 91 percent of
the world’s population, up from 76 percent in 1990. Of those remaining without improved access, nearly half are in sub-Saharan
Africa. Sanitation status has been more varied, yet progress is clear. Whereas some countries, like Chile, already had good access
that is now almost universal, other countries have made more progress on sanitation than water, such as Angola. Still, more than
2.4 billion people, mostly in eastern and southern Asia and sub-Saharan Africa, do not have access to improved sanitation facilities.
And urban-rural gaps are sharp: Eighty-two percent of urban dwellers, but only 51 percent of rural residents, use improved
sanitation facilities. Most developed countries have nearly universal access to water and sanitation.
Percent of Population With Improved Access to Sanitation and Water, 1990 and 2014, Select Countries
Chile
Vietnam
India
Kyrgyzstan
Ethiopia
Angola
3 28
13 57
22 52
46 49
71 94
17 40
75 90
91 93
90 99
85 99
63 98
36 78
Water 1990 Water 2014 Sanitation 1990 Sanitation 2014
Source: UNICEF and World Health Organization, 25 Years: Progress on Sanitation and Drinking Water, 2015 Update and MDG Assessment.
Aquacult
Seafood is an imp
changes in ocean
Fund estimates th
enforce sustainabl
of 19 kilograms pe
of fish consumed
Trend in Annual
20%
40%
60%
80%
100%
19721970
Fish Supply by Sou
0%
Sources: Food and Ag
d Population Data
in English and
b.org. Also online:
igital Data Sheet
ive data map and
about countries’
ion growth
lications
le for bulk orders):
prb.org.
@prb.org.
00-877-9881.
3937.
necticut Ave., NW,
hington, DC 20009.
PRB demographers
nd Kristin Bietsch.
nce Bureau.
d.
aiwan Nans0410/
© 2016 Population Reference Bureau  2016 WORLD POPULATION DATA SHEET 8
W O R L D P O P U L AT I O N H I G H L I G H T S
FOCUS ON HUMAN NEEDS AND SUSTAINABLE RESOURCES
ADELAIDE, AUSTRALIA
100 • 100 • 54
417
SOFIA, BULGARIA
100 • 100 • 11
370
Waste Collection Coverage (% of city population)
Controlled Disposal (% of collected waste properly managed)
Recycling Rate (% of total waste generated)
capita) is indicated by both the size of the circle and
the value in each circle.
country where the city is located.
LOW HIGHLOWER-
MIDDLE
UPPER-
MIDDLE
tion
n
t of
ran
ccess
han
cilities.
94
93
99
99
98
Aquaculture Meets Fish Demand as Ocean Catches Decline
Seafood is an important protein source for about 3 billion people worldwide. Population growth, new ocean fishing technologies, and
changes in ocean ecosystems have placed strains on wild fish stocks. Total ocean catches peaked in the late 1990s and the World Wildlife
Fund estimates that the oceans contain half the number of fish they did in 1970. Declining catches also reflect national and global efforts to
enforce sustainable catch limits. Strong growth in aquaculture has allowed per capita fish consumption to rise steadily, to a global average
of 19 kilograms per person in 2012 from about 10 kilograms in the 1960s. In 2012, aquaculture was the source for about half (49 percent)
of fish consumed by humans, up from 5 percent in 1962.
Trend in Annual World Fish Supply by Source and Fish Consumption per Capita, 1970-2012
20%
40%
60%
80%
100%
2012201020082006200420022000199819961994199219901988198619841982198019781976197419721970
4
8
12
16
20
CATCH
AQUACULTURE
Fish Supply by Source Fish Consumption (kg per capita)
0% 0
World Fish Consumption Over Time (kg per capita per year)
Sources: Food and Agriculture Organization, Fisheries and Aquaculture Department.
© 2016 Population Reference Bureau  2016 WORLD POPULATION DATA SHEET 9
W O R L D P O P U L AT I O N H I G H L I G H T S
FOCUS ON HUMAN NEEDS AND SUSTAINABLE RESOURCES
728MILLION
Projected 2050 population
of Europe,down from
740 million in 2016.
50%Percentage of the
population in Niger that is
less than 15 years old.
$1,760
Gross national income
per capita of Haiti.
38Infant deaths per 1,000
live births in Bangladesh.
3.5The total fertility rate (lifetime
births per woman) in Egypt.
2.8MILLION
Metric tons of carbon emitted
by China in 2013,almost
four times the level of 1992.
54%Percentage of the
world’s population living
in urban areas.
34%Percentage of people in the
least-developed countries with
access to electricity,compared
to 85 percent globally.
© 2016 Population Reference Bureau See notes on page 20 2016 WORLD POPULATION DATA SHEET 10
Population
mid-2016
(millions)
Births
per 1,000
Population
Deaths
per 1,000
Population
Net
Migration
Rate per
1,000
Population Infant
Mortality
Ratea
Total
Fertility
Rateb
Percent
of Population
GNI
per Capita
($US)
Percent
Urban
Percent of Married
Women 15-49 Using
Contraceptionc
Life Expectancy
at Birth (years)
Ma
Dea
100,0
mid-2030
(millions)
mid-2050
(millions)
Ages
15
Ages
65+ 2015
All
Methods
Modern
Methods Males Females 2
WORLD 7,418 20 8 — 8,539 9,869 36 2.5 26 8 15,415 54 62 56 70 74
MORE DEVELOPED 1,254 11 10 3 1,298 1,322 5 1.7 16 18 39,963 78 70 62 76 82
LESS DEVELOPED 6,164 22 7 -0 7,241 8,548 39 2.6 28 7 10,214 49 61 55 68 72
LESS DEVELOPED (Excl. China) 4,778 24 7 -0 5,821 7,195 43 2.9 31 5 8,936 47 54 46 67 70
LEAST DEVELOPED 962 33 9 -1 1,318 1,923 59 4.3 41 4 2,424 32 36 32 61 64
AFRICA 1,203 36 10 -1 1,681 2,527 57 4.7 41 4 4,802 41 35 30 59 62
SUB-SAHARAN AFRICA 974 37 11 -0 1,388 2,128 62 5.0 43 3 3,606 39 31 26 57 59
NORTHERN AFRICA 229 29 6 -1 293 400 29 3.4 32 5 9,798 51 52 46 69 73
Algeria 40.8 26 5 0 50.6 63.2 21 3.1 29 6 14,280 71 57 48 73 78
Egypt 93.5 31 6 -1 121.6 168.8 22 3.5 31 4 10,690 43 58 57 70 73
Libya 6.3 20 5 -10 7.4 8.4 23 2.4 30 5 15,140 79 42 20 69 75
Morocco 34.7 20 6 -2 38.1 38.8 24 2.4 25 6 7,680 60 67 57 73 75
Sudan 42.1 37 8 -3 61.7 105.0 51 5.2 43 3 4,080 34 12 12 61 64
Tunisia 11.3 20 7 -1 13.1 14.9 17 2.4 24 8 11,060 68 62 50 73 77
Western Saharae 0.6 18 6 8 0.7 0.9 35 2.1 26 3 — 81 — — 67 71
WESTERN AFRICA 359 39 11 -1 515 800 64 5.4 44 3 4,135 45 18 13 55 56
Benin 10.8 36 9 -0 16.6 24.0 66 4.7 45 3 2,100 44 18 12 58 61
Burkina Faso 19.0 41 10 -1 28.2 47.0 65 5.7 49 3 1,640 30 21 20 57 60
Cape Verde 0.5 21 5 -4 0.6 0.7 19 2.3 28 6 6,390 66 61 57 71 80
Côte d’Ivoire 23.9 37 13 0 33.0 50.1 69 4.9 42 3 3,240 54 18 12 51 53
Gambia 2.1 41 9 -1 3.2 5.1 45 5.6 46 2 1,580 60 9 8 59 62
Ghana 28.2 33 8 -1 37.1 50.4 41 4.2 39 5 4,070 54 35 29 60 63
Guinea 11.2 37 10 -0 18.3 27.5 67 5.1 43 3 1,120 37 6 5 58 59
Guinea-Bissau 1.9 37 12 -1 2.5 3.6 88 4.9 43 3 1,450 49 16 14 54 57
Liberia 4.6 35 9 -1 6.4 9.4 54 4.7 42 3 720 50 20 19 60 62
Mali 17.3 44 13 -3 26.1 43.6 56 6.0 47 3 2,360 40 16 15 54 54
Mauritania 4.2 31 8 -1 5.7 8.0 72 4.2 40 3 3,710 60 11 10 62 65
Niger 19.7 49 9 -0 34.3 68.9 56 7.6 50 3 950 22 14 12 61 62
Nigeria 186.5 39 13 -0 261.9 397.5 69 5.5 43 3 5,800 48 15 10 53 53
Senegal 14.8 38 6 -1 21.6 34.4 39 5.0 44 4 2,390 45 23 21 65 68
Sierra Leone 6.6 37 14 -1 8.9 12.6 89 4.9 42 3 1,560 40 17 16 50 52 1,
Togo 7.5 36 9 -0 10.9 17.4 47 4.7 42 3 1,320 38 20 17 59 61
EASTERN AFRICA 394 36 9 -1 561 844 51 4.8 43 3 2,019 26 40 37 60 64
Burundi 11.1 42 10 0 17.2 30.4 63 6.1 46 2 730 12 32 30 58 61
Comoros 0.8 33 7 -3 1.0 1.4 36 4.3 40 3 1,430 28 19 14 62 65
Djibouti 0.9 25 9 -3 1.1 1.2 53 3.2 33 4 — 77 19 18 60 64
Eritrea 5.4 34 7 -5 7.3 10.4 43 4.2 43 3 — 23 8 7 62 66
Ethiopia 101.7 30 7 -0 132.9 168.6 47 4.2 41 3 1,620 20 37 36 62 66
Kenya 45.4 31 7 -0 63.7 88.2 39 3.9 42 3 3,060 26 66 63 60 65
Madagascar 23.7 33 7 0 32.9 47.1 36 4.3 41 3 1,400 35 40 33 64 67
Malawi 17.2 34 10 -0 23.4 32.2 42 4.4 40 4 1,140 16 59 58 62 64
Mauritius 1.3 10 8 -1 1.2 1.1 13.6 1.4 20 9 19,290 41 76 39 71 78
Mayotte 0.2 33 3 -0 0.3 0.5 4 4.0 44 3 — 47 — — 75 78
Mozambique 27.2 45 14 0 41.9 74.4 81 5.9 45 3 1,170 32 12 11 52 56
Reunion 0.8 17 5 -7 1.0 1.1 7 2.5 24 10 — 95 67 64 77 84
Rwanda 11.9 34 7 -1 16.4 23.6 32 4.2 41 3 1,720 29 53 48 62 66
Seychelles 0.09 17 7 1 0.1 0.1 13.4 2.4 22 8 25,760 54 — — 70 79
Somalia 11.1 44 12 -6 16.5 27.0 76 6.4 47 3 — 40 15 1 54 57
South Sudan 12.7 37 12 10 17.8 25.9 74 6.7 42 3 1,630 19 4 1 55 57
Tanzania 54.2 37 7 -1 81.5 134.8 43 5.2 45 3 2,620 30 38 32 64 66
Uganda 36.6 43 10 -4 58.1 101.5 53 5.8 48 3 1,780 20 34 30 62 64
POPULATION, HEALTH, AND ENVIRONMENT DATA AND ESTIMATES FOR THE COUNTRIES AND REGIONS OF THE WORLD
© 2016 Population Reference Bureau See notes on page 20 2016 WORLD POPULATION DATA SHEET 11
Ethiopia 101.7 30 7 -0 132.9 168.6 47 4.2 41 3 1,620 20 37 36 62 66
Kenya 45.4 31 7 -0 63.7 88.2 39 3.9 42 3 3,060 26 66 63 60 65
Madagascar 23.7 33 7 0 32.9 47.1 36 4.3 41 3 1,400 35 40 33 64 67
Malawi 17.2 34 10 -0 23.4 32.2 42 4.4 40 4 1,140 16 59 58 62 64
Mauritius 1.3 10 8 -1 1.2 1.1 13.6 1.4 20 9 19,290 41 76 39 71 78
Mayotte 0.2 33 3 -0 0.3 0.5 4 4.0 44 3 — 47 — — 75 78
Mozambique 27.2 45 14 0 41.9 74.4 81 5.9 45 3 1,170 32 12 11 52 56
Reunion 0.8 17 5 -7 1.0 1.1 7 2.5 24 10 — 95 67 64 77 84
Rwanda 11.9 34 7 -1 16.4 23.6 32 4.2 41 3 1,720 29 53 48 62 66
Seychelles 0.09 17 7 1 0.1 0.1 13.4 2.4 22 8 25,760 54 — — 70 79
Somalia 11.1 44 12 -6 16.5 27.0 76 6.4 47 3 — 40 15 1 54 57
South Sudan 12.7 37 12 10 17.8 25.9 74 6.7 42 3 1,630 19 4 1 55 57
Tanzania 54.2 37 7 -1 81.5 134.8 43 5.2 45 3 2,620 30 38 32 64 66
Uganda 36.6 43 10 -4 58.1 101.5 53 5.8 48 3 1,780 20 34 30 62 64
Zambia 15.9 43 13 -0 24.1 41.0 52 5.3 46 3 3,700 40 49 45 51 56
Zimbabwe 16.0 36 10 -3 22.2 33.2 50 4.0 42 3 1,700 33 66 66 56 59
MIDDLE AFRICA 157 44 14 -0 238 396 88 6.0 45 3 2,617 47 21 11 51 54
Angola 25.8 45 14 1 39.4 65.5 93 6.0 48 2 6,450 62 18 12 51 54
Cameroon 24.4 38 10 -0 34.4 51.9 55 4.9 43 3 3,080 54 34 21 56 59
Central African Republic 5.0 34 14 0 6.7 9.7 90 4.4 39 4 600 40 15 9 49 53
Chad 14.5 47 14 1 22.7 38.5 87 6.4 48 2 2,110 22 6 5 51 53
Congo 4.9 37 10 -7 6.7 10.2 48 4.7 41 3 6,300 65 30 18 57 60
Congo, Dem. Rep. 79.8 46 16 -0 124.2 213.8 97 6.5 46 3 720 42 21 8 49 52
Equatorial Guinea 0.9 35 11 5 1.3 2.0 67 4.9 39 3 16,450 40 13 10 56 59
Gabon 1.8 32 9 1 2.4 3.5 43 4.1 37 5 18,810 87 31 19 64 65
Sao Tome and Principe 0.2 33 7 -6 0.3 0.3 38 4.4 42 4 3,160 67 41 37 64 68
SOUTHERN AFRICA 64 23 10 3 74 88 36 2.5 31 5 12,404 62 60 59 60 63
Botswana 2.2 25 8 2 2.7 3.3 31 2.8 33 5 15,600 57 53 51 62 67
Lesotho 2.2 29 15 -2 2.6 3.4 59 3.3 36 5 3,160 27 60 60 50 50
Namibia 2.5 29 7 0 3.3 4.7 39 3.6 34 4 10,380 47 56 55 62 67
South Africa 55.7 22 10 3 63.4 75.2 34 2.4 30 5 12,830 65 60 60 60 64
Swaziland 1.3 29 14 -1 1.5 1.8 50 3.3 37 4 8,040 21 66 66 50 48
AMERICAS 998 15 7 1 1,117 1,221 14 2.0 23 10 30,077 80 73 68 74 80
NORTHERN AMERICA 360 12 8 4 401 445 6 1.8 19 15 55,179 81 74 68 77 81
Canada 36.2 11 8 6 41.0 46.9 4.4 1.6 16 16 43,970 82 74 72 79 84
United States 323.9 12 8 4 359.4 398.3 5.8 1.8 19 15 56,430 81 74 68 76 81
LATIN AMERICA AND THE CARIBBEAN 637 17 6 -1 716 775 17 2.1 26 8 14,512 80 73 67 72 79
CENTRAL AMERICA 175 19 5 -1 205 232 16 2.3 29 6 14,896 74 72 65 74 79
Belize 0.4 22 6 4 0.5 0.6 14 2.5 36 4 7,880 45 55 52 71 77
Costa Rica 4.9 15 4 1 5.6 6.1 8.0 1.8 23 7 14,880 77 76 75 77 82
El Salvador 6.4 18 7 -7 6.7 6.7 17 2.0 27 8 8,220 67 72 68 68 78
Guatemala 16.6 24 5 -1 21.3 27.6 28 3.1 40 5 7,510 52 61 49 69 76
Honduras 8.2 22 5 -2 10.2 12.6 26 2.5 32 5 4,740 55 73 64 71 76
Mexico 128.6 19 5 -1 148.1 163.8 13 2.2 28 6 17,150 79 72 66 74 79
Nicaragua 6.3 20 5 -4 7.5 9.1 19 2.4 30 5 5,050 59 80 76 72 78
Panama 4.0 19 5 2 4.8 5.7 14 2.4 27 8 20,710 67 63 60 75 81
CARIBBEAN 43 17 8 -4 47 49 28 2.3 26 9 — 70 62 58 71 76
Antigua and Barbuda 0.09 12 6 -0 0.1 0.1 16 1.5 24 7 22,220 24 — — 74 80
Bahamas 0.4 14 6 4 0.4 0.5 14 1.8 26 6 22,930 83 — — 72 78
Barbados 0.3 12 9 2 0.3 0.3 12 1.7 19 14 15,930 32 59 55 73 78
Cuba 11.2 11 9 -2 11.1 10.2 4.2 1.7 16 14 — 77 74 72 78 82
Curaçao 0.2 12 9 10 0.2 0.2 10.2 1.9 19 16 — 89 — — 75 81
Dominica 0.07 14 9 -1 0.08 0.07 20 2.1 22 10 10,420 70 — — 72 77
Dominican Republic 10.6 20 6 -3 12.1 13.2 31 2.4 30 7 13,570 79 70 68 71 77
Grenada 0.1 17 8 -2 0.1 0.1 15 2.1 26 7 12,520 36 — — 74 79
Guadeloupe 0.4 12 8 -1 0.4 0.4 8.8 2.2 22 15 — 98 — — 76 83
Haiti 11.1 26 8 -3 13.3 16.2 42 3.2 35 4 1,760 59 34 31 61 65
Jamaica 2.7 14 6 -5 2.8 2.6 17 2.0 24 9 8,860 55 72 68 73 78
Martinique 0.4 12 9 -3 0.4 0.3 7 2.1 18 18 — 89 — — 78 84
Puerto Rico 3.4 10 9 -19 3.4 3.1 7.0 1.4 17 18 24,030 99 84 72 76 83
St. Kitts-Nevis 0.05 14 8 7 0.06 0.07 13 1.8 21 8 23,700 32 — — 73 78
Saint Lucia 0.2 12 6 2 0.2 0.2 18 1.5 22 9 10,820 18 56 52 75 82
Population
mid-2016
(millions)
Births
per 1,000
Population
Deaths
per 1,000
Population
Net
Migration
Rate per
1,000
Population Infant
Mortality
Ratea
Total
Fertility
Rateb
Percent
of Population
GNI
per Capita
($US)
Percent
Urban
Percent of Married
Women 15-49 Using
Contraceptionc
Life Expectancy
at Birth (years)
Ma
Dea
100,0
mid-2030
(millions)
mid-2050
(millions)
Ages
15
Ages
65+ 2015
All
Methods
Modern
Methods Males Females 2
WORLD 7,418 20 8 — 8,539 9,869 36 2.5 26 8 15,415 54 62 56 70 74
MORE DEVELOPED 1,254 11 10 3 1,298 1,322 5 1.7 16 18 39,963 78 70 62 76 82
LESS DEVELOPED 6,164 22 7 -0 7,241 8,548 39 2.6 28 7 10,214 49 61 55 68 72
LESS DEVELOPED (Excl. China) 4,778 24 7 -0 5,821 7,195 43 2.9 31 5 8,936 47 54 46 67 70
LEAST DEVELOPED 962 33 9 -1 1,318 1,923 59 4.3 41 4 2,424 32 36 32 61 64
AFRICA 1,203 36 10 -1 1,681 2,527 57 4.7 41 4 4,802 41 35 30 59 62
SUB-SAHARAN AFRICA 974 37 11 -0 1,388 2,128 62 5.0 43 3 3,606 39 31 26 57 59
NORTHERN AFRICA 229 29 6 -1 293 400 29 3.4 32 5 9,798 51 52 46 69 73
Algeria 40.8 26 5 0 50.6 63.2 21 3.1 29 6 14,280 71 57 48 73 78
Egypt 93.5 31 6 -1 121.6 168.8 22 3.5 31 4 10,690 43 58 57 70 73
Libya 6.3 20 5 -10 7.4 8.4 23 2.4 30 5 15,140 79 42 20 69 75
Morocco 34.7 20 6 -2 38.1 38.8 24 2.4 25 6 7,680 60 67 57 73 75
Sudan 42.1 37 8 -3 61.7 105.0 51 5.2 43 3 4,080 34 12 12 61 64
Tunisia 11.3 20 7 -1 13.1 14.9 17 2.4 24 8 11,060 68 62 50 73 77
Western Saharae 0.6 18 6 8 0.7 0.9 35 2.1 26 3 — 81 — — 67 71
WESTERN AFRICA 359 39 11 -1 515 800 64 5.4 44 3 4,135 45 18 13 55 56
Benin 10.8 36 9 -0 16.6 24.0 66 4.7 45 3 2,100 44 18 12 58 61
Burkina Faso 19.0 41 10 -1 28.2 47.0 65 5.7 49 3 1,640 30 21 20 57 60
Cape Verde 0.5 21 5 -4 0.6 0.7 19 2.3 28 6 6,390 66 61 57 71 80
Côte d’Ivoire 23.9 37 13 0 33.0 50.1 69 4.9 42 3 3,240 54 18 12 51 53
Gambia 2.1 41 9 -1 3.2 5.1 45 5.6 46 2 1,580 60 9 8 59 62
Ghana 28.2 33 8 -1 37.1 50.4 41 4.2 39 5 4,070 54 35 29 60 63
Guinea 11.2 37 10 -0 18.3 27.5 67 5.1 43 3 1,120 37 6 5 58 59
Guinea-Bissau 1.9 37 12 -1 2.5 3.6 88 4.9 43 3 1,450 49 16 14 54 57
Liberia 4.6 35 9 -1 6.4 9.4 54 4.7 42 3 720 50 20 19 60 62
Mali 17.3 44 13 -3 26.1 43.6 56 6.0 47 3 2,360 40 16 15 54 54
Mauritania 4.2 31 8 -1 5.7 8.0 72 4.2 40 3 3,710 60 11 10 62 65
Niger 19.7 49 9 -0 34.3 68.9 56 7.6 50 3 950 22 14 12 61 62
Nigeria 186.5 39 13 -0 261.9 397.5 69 5.5 43 3 5,800 48 15 10 53 53
Senegal 14.8 38 6 -1 21.6 34.4 39 5.0 44 4 2,390 45 23 21 65 68
Sierra Leone 6.6 37 14 -1 8.9 12.6 89 4.9 42 3 1,560 40 17 16 50 52 1,
Togo 7.5 36 9 -0 10.9 17.4 47 4.7 42 3 1,320 38 20 17 59 61
EASTERN AFRICA 394 36 9 -1 561 844 51 4.8 43 3 2,019 26 40 37 60 64
Burundi 11.1 42 10 0 17.2 30.4 63 6.1 46 2 730 12 32 30 58 61
Comoros 0.8 33 7 -3 1.0 1.4 36 4.3 40 3 1,430 28 19 14 62 65
Djibouti 0.9 25 9 -3 1.1 1.2 53 3.2 33 4 — 77 19 18 60 64
Eritrea 5.4 34 7 -5 7.3 10.4 43 4.2 43 3 — 23 8 7 62 66
Ethiopia 101.7 30 7 -0 132.9 168.6 47 4.2 41 3 1,620 20 37 36 62 66
Kenya 45.4 31 7 -0 63.7 88.2 39 3.9 42 3 3,060 26 66 63 60 65
Madagascar 23.7 33 7 0 32.9 47.1 36 4.3 41 3 1,400 35 40 33 64 67
Malawi 17.2 34 10 -0 23.4 32.2 42 4.4 40 4 1,140 16 59 58 62 64
Mauritius 1.3 10 8 -1 1.2 1.1 13.6 1.4 20 9 19,290 41 76 39 71 78
Mayotte 0.2 33 3 -0 0.3 0.5 4 4.0 44 3 — 47 — — 75 78
Mozambique 27.2 45 14 0 41.9 74.4 81 5.9 45 3 1,170 32 12 11 52 56
Reunion 0.8 17 5 -7 1.0 1.1 7 2.5 24 10 — 95 67 64 77 84
Rwanda 11.9 34 7 -1 16.4 23.6 32 4.2 41 3 1,720 29 53 48 62 66
Seychelles 0.09 17 7 1 0.1 0.1 13.4 2.4 22 8 25,760 54 — — 70 79
Somalia 11.1 44 12 -6 16.5 27.0 76 6.4 47 3 — 40 15 1 54 57
South Sudan 12.7 37 12 10 17.8 25.9 74 6.7 42 3 1,630 19 4 1 55 57
Tanzania 54.2 37 7 -1 81.5 134.8 43 5.2 45 3 2,620 30 38 32 64 66
Uganda 36.6 43 10 -4 58.1 101.5 53 5.8 48 3 1,780 20 34 30 62 64
Zambia 15.9 43 13 -0 24.1 41.0 52 5.3 46 3 3,700 40 49 45 51 56
POPULATION, HEALTH, AND ENVIRONMENT DATA AND ESTIMATES FOR THE COUNTRIES AND REGIONS OF THE WORLD
© 2016 Population Reference Bureau See notes on page 20 2016 WORLD POPULATION DATA SHEET 12
Barbados 0.3 12 9 2 0.3 0.3 12 1.7 19 14 15,930 32 59 55 73 78
Cuba 11.2 11 9 -2 11.1 10.2 4.2 1.7 16 14 — 77 74 72 78 82
Curaçao 0.2 12 9 10 0.2 0.2 10.2 1.9 19 16 — 89 — — 75 81
Dominica 0.07 14 9 -1 0.08 0.07 20 2.1 22 10 10,420 70 — — 72 77
Dominican Republic 10.6 20 6 -3 12.1 13.2 31 2.4 30 7 13,570 79 70 68 71 77
Grenada 0.1 17 8 -2 0.1 0.1 15 2.1 26 7 12,520 36 — — 74 79
Guadeloupe 0.4 12 8 -1 0.4 0.4 8.8 2.2 22 15 — 98 — — 76 83
Haiti 11.1 26 8 -3 13.3 16.2 42 3.2 35 4 1,760 59 34 31 61 65
Jamaica 2.7 14 6 -5 2.8 2.6 17 2.0 24 9 8,860 55 72 68 73 78
Martinique 0.4 12 9 -3 0.4 0.3 7 2.1 18 18 — 89 — — 78 84
Puerto Rico 3.4 10 9 -19 3.4 3.1 7.0 1.4 17 18 24,030 99 84 72 76 83
St. Kitts-Nevis 0.05 14 8 7 0.06 0.07 13 1.8 21 8 23,700 32 — — 73 78
Saint Lucia 0.2 12 6 2 0.2 0.2 18 1.5 22 9 10,820 18 56 52 75 82
St. Vincent and the Grenadines 0.1 16 7 -8 0.1 0.1 20 2.0 25 7 11,000 51 — — 71 75
Trinidad and Tobago 1.4 14 8 -1 1.4 1.3 13 1.7 21 9 29,630 8 42 38 71 78
SOUTH AMERICA 419 16 6 -0 465 494 17 2.1 25 8 14,628 83 75 69 72 79
Argentina 43.6 18 8 1 49.1 55.2 10.8 2.3 25 11 — 92 55 53 73 80
Bolivia 11.0 24 6 -2 13.3 16.5 36 3.0 33 5 6,840 68 61 35 68 74
Brazil 206.1 14 6 0 223.1 226.3 18 1.8 23 8 15,020 86 80 77 72 79
Chile 18.2 14 6 2 20.3 21.7 7.4 1.8 20 11 21,740 83 64 — 77 82
Colombia 48.8 16 6 -1 53.3 55.0 15 2.3 27 7 13,520 76 79 73 72 79
Ecuador 16.5 21 5 -0 19.7 23.2 20 2.5 29 7 11,190 64 73 60 73 79
French Guiana 0.3 26 3 -2 0.4 0.6 9 3.5 34 5 — 84 — — 77 83
Guyana 0.8 20 8 -7 0.8 0.8 32 2.6 29 5 7,520 29 34 33 64 69
Paraguay 7.0 22 6 -3 8.2 9.3 28 2.6 32 5 8,670 60 79 70 71 75
Peru 31.5 20 6 -1 35.9 40.1 17 2.5 28 7 11,960 79 75 52 72 77
Suriname 0.5 18 7 -2 0.6 0.7 17 2.3 27 7 16,870 66 48 47 68 74
Uruguay 3.5 14 10 -1 3.6 3.7 9.3 1.9 21 14 20,360 95 77 75 74 81
Venezuela 31.0 20 5 -2 36.1 40.5 12.8 2.4 28 6 17,730 89 70 62 72 78
ASIA 4,437 18 7 -0 4,946 5,327 31 2.1 25 8 11,969 48 65 59 71 74
ASIA (Excl. China) 3,051 21 7 0 3,527 3,974 37 2.4 28 7 10,800 44 56 48 69 72
WESTERN ASIA 261 22 5 3 320 386 22 2.8 29 5 25,602 70 54 38 71 76
Armenia 3.0 14 9 -1 2.8 2.4 9 1.6 19 11 8,720 64 55 27 72 78
Azerbaijan 9.8 17 6 0 10.6 10.8 10 2.1 22 6 17,140 53 51 14 72 77
Bahrain 1.4 16 2 3 1.7 1.9 8 2.1 17 2 39,140 100 62 31 76 78
Cyprus 1.2 12 6 -12 1.3 1.4 5 1.4 17 12 30,840 67 — — 78 82
Georgia 4.0 13 11 -1 3.7 3.1 9 1.7 17 14 9,410 54 53 35 71 79
Iraq 38.1 32 4 2 53.4 76.5 37 4.2 40 3 14,850 70 52 34 67 72
Israel 8.2 21 5 1 10.3 13.8 3.1 3.1 28 11 34,940 92 — — 80 84
Jordan 8.2 27 4 -13 9.0 11.4 16 3.5 37 3 10,740 84 61 42 73 76
Kuwait 4.0 17 2 22 5.0 6.0 7 2.2 22 2 79,970 98 52 39 74 76
Lebanon 6.2 15 5 -1 5.5 5.6 8 1.7 25 7 14,120 88 58 34 76 78
Oman 4.4 21 2 39 5.1 6.0 8 2.9 21 3 37,340 75 30 19 75 78
Palestinian Territory 4.8 32 4 -2 6.5 8.8 18 4.1 40 3 5,070 75 57 44 71 75
Qatar 2.5 12 1 75 3.0 3.5 7 2.0 15 1 140,720 99 38 34 77 80
Saudi Arabia 31.7 22 4 3 39.9 50.0 15 2.8 30 3 54,730 83 24 — 73 75
Syria 17.2 22 4 -20 26.1 31.2 16 2.7 32 4 — 58 54 38 64 77
Turkey 79.5 17 5 7 88.4 93.5 11 2.1 24 8 19,360 73 74 47 75 79
United Arab Emirates 9.3 11 2 8 11.0 12.8 6 1.8 14 1 70,570 86 28 24 76 79
Yemen 27.5 33 7 -1 36.3 47.1 43 4.2 40 3 3,660 35 34 29 63 67
SOUTH CENTRAL ASIA 1,929 23 7 -0 2,254 2,563 43 2.5 30 5 6,326 35 54 46 67 70
CENTRAL ASIA 70 24 6 -1 82 96 32 2.7 29 5 10,898 40 54 50 68 75
Kazakhstan 17.8 23 8 -1 20.5 24.7 9 2.6 25 7 24,260 53 51 50 68 77
Kyrgyzstan 6.1 28 6 -1 8.2 11.6 20 3.8 33 4 3,300 36 42 40 67 74
Tajikistan 8.6 31 6 -3 11.1 14.2 38 3.6 35 3 3,320 26 28 26 66 73
Turkmenistan 5.4 21 8 -1 6.2 6.6 45 2.2 28 4 15,760 50 48 46 62 70
Uzbekistan 31.9 23 5 -1 36.2 39.0 43 2.5 29 5 6,110 36 65 59 71 76
SOUTH ASIA 1,859 23 7 -0 2,172 2,467 43 2.5 30 5 6,155 35 54 46 67 70
Afghanistan 33.4 37 8 1 45.5 62.4 68 5.3 44 2 1,990 27 22 20 59 62
Bangladesh 162.9 20 5 -2 186.5 202.2 38 2.3 33 6 3,550 34 62 54 71 73
Bhutan 0.8 19 6 2 0.9 1.0 44 2.1 31 5 7,610 39 66 65 69 70
India 1,328.9 22 7 0 1,530.0 1,708.0 40 2.3 29 6 6,020 33 54 47 67 70
Population
mid-2016
(millions)
Births
per 1,000
Population
Deaths
per 1,000
Population
Net
Migration
Rate per
1,000
Population Infant
Mortality
Ratea
Total
Fertility
Rateb
Percent
of Population
GNI
per Capita
($US)
Percent
Urban
Percent of Married
Women 15-49 Using
Contraceptionc
Life Expectancy
at Birth (years)
Ma
Dea
100,0
mid-2030
(millions)
mid-2050
(millions)
Ages
15
Ages
65+ 2015
All
Methods
Modern
Methods Males Females 2
WORLD 7,418 20 8 — 8,539 9,869 36 2.5 26 8 15,415 54 62 56 70 74
MORE DEVELOPED 1,254 11 10 3 1,298 1,322 5 1.7 16 18 39,963 78 70 62 76 82
LESS DEVELOPED 6,164 22 7 -0 7,241 8,548 39 2.6 28 7 10,214 49 61 55 68 72
LESS DEVELOPED (Excl. China) 4,778 24 7 -0 5,821 7,195 43 2.9 31 5 8,936 47 54 46 67 70
LEAST DEVELOPED 962 33 9 -1 1,318 1,923 59 4.3 41 4 2,424 32 36 32 61 64
AFRICA 1,203 36 10 -1 1,681 2,527 57 4.7 41 4 4,802 41 35 30 59 62
SUB-SAHARAN AFRICA 974 37 11 -0 1,388 2,128 62 5.0 43 3 3,606 39 31 26 57 59
NORTHERN AFRICA 229 29 6 -1 293 400 29 3.4 32 5 9,798 51 52 46 69 73
Algeria 40.8 26 5 0 50.6 63.2 21 3.1 29 6 14,280 71 57 48 73 78
Egypt 93.5 31 6 -1 121.6 168.8 22 3.5 31 4 10,690 43 58 57 70 73
Libya 6.3 20 5 -10 7.4 8.4 23 2.4 30 5 15,140 79 42 20 69 75
Morocco 34.7 20 6 -2 38.1 38.8 24 2.4 25 6 7,680 60 67 57 73 75
Sudan 42.1 37 8 -3 61.7 105.0 51 5.2 43 3 4,080 34 12 12 61 64
Tunisia 11.3 20 7 -1 13.1 14.9 17 2.4 24 8 11,060 68 62 50 73 77
Western Saharae 0.6 18 6 8 0.7 0.9 35 2.1 26 3 — 81 — — 67 71
WESTERN AFRICA 359 39 11 -1 515 800 64 5.4 44 3 4,135 45 18 13 55 56
Benin 10.8 36 9 -0 16.6 24.0 66 4.7 45 3 2,100 44 18 12 58 61
Burkina Faso 19.0 41 10 -1 28.2 47.0 65 5.7 49 3 1,640 30 21 20 57 60
Cape Verde 0.5 21 5 -4 0.6 0.7 19 2.3 28 6 6,390 66 61 57 71 80
Côte d’Ivoire 23.9 37 13 0 33.0 50.1 69 4.9 42 3 3,240 54 18 12 51 53
Gambia 2.1 41 9 -1 3.2 5.1 45 5.6 46 2 1,580 60 9 8 59 62
Ghana 28.2 33 8 -1 37.1 50.4 41 4.2 39 5 4,070 54 35 29 60 63
Guinea 11.2 37 10 -0 18.3 27.5 67 5.1 43 3 1,120 37 6 5 58 59
Guinea-Bissau 1.9 37 12 -1 2.5 3.6 88 4.9 43 3 1,450 49 16 14 54 57
Liberia 4.6 35 9 -1 6.4 9.4 54 4.7 42 3 720 50 20 19 60 62
Mali 17.3 44 13 -3 26.1 43.6 56 6.0 47 3 2,360 40 16 15 54 54
Mauritania 4.2 31 8 -1 5.7 8.0 72 4.2 40 3 3,710 60 11 10 62 65
Niger 19.7 49 9 -0 34.3 68.9 56 7.6 50 3 950 22 14 12 61 62
Nigeria 186.5 39 13 -0 261.9 397.5 69 5.5 43 3 5,800 48 15 10 53 53
Senegal 14.8 38 6 -1 21.6 34.4 39 5.0 44 4 2,390 45 23 21 65 68
Sierra Leone 6.6 37 14 -1 8.9 12.6 89 4.9 42 3 1,560 40 17 16 50 52 1,
Togo 7.5 36 9 -0 10.9 17.4 47 4.7 42 3 1,320 38 20 17 59 61
EASTERN AFRICA 394 36 9 -1 561 844 51 4.8 43 3 2,019 26 40 37 60 64
Burundi 11.1 42 10 0 17.2 30.4 63 6.1 46 2 730 12 32 30 58 61
Comoros 0.8 33 7 -3 1.0 1.4 36 4.3 40 3 1,430 28 19 14 62 65
Djibouti 0.9 25 9 -3 1.1 1.2 53 3.2 33 4 — 77 19 18 60 64
Eritrea 5.4 34 7 -5 7.3 10.4 43 4.2 43 3 — 23 8 7 62 66
Ethiopia 101.7 30 7 -0 132.9 168.6 47 4.2 41 3 1,620 20 37 36 62 66
Kenya 45.4 31 7 -0 63.7 88.2 39 3.9 42 3 3,060 26 66 63 60 65
Madagascar 23.7 33 7 0 32.9 47.1 36 4.3 41 3 1,400 35 40 33 64 67
Malawi 17.2 34 10 -0 23.4 32.2 42 4.4 40 4 1,140 16 59 58 62 64
Mauritius 1.3 10 8 -1 1.2 1.1 13.6 1.4 20 9 19,290 41 76 39 71 78
Mayotte 0.2 33 3 -0 0.3 0.5 4 4.0 44 3 — 47 — — 75 78
Mozambique 27.2 45 14 0 41.9 74.4 81 5.9 45 3 1,170 32 12 11 52 56
Reunion 0.8 17 5 -7 1.0 1.1 7 2.5 24 10 — 95 67 64 77 84
Rwanda 11.9 34 7 -1 16.4 23.6 32 4.2 41 3 1,720 29 53 48 62 66
Seychelles 0.09 17 7 1 0.1 0.1 13.4 2.4 22 8 25,760 54 — — 70 79
Somalia 11.1 44 12 -6 16.5 27.0 76 6.4 47 3 — 40 15 1 54 57
South Sudan 12.7 37 12 10 17.8 25.9 74 6.7 42 3 1,630 19 4 1 55 57
Tanzania 54.2 37 7 -1 81.5 134.8 43 5.2 45 3 2,620 30 38 32 64 66
Uganda 36.6 43 10 -4 58.1 101.5 53 5.8 48 3 1,780 20 34 30 62 64
Zambia 15.9 43 13 -0 24.1 41.0 52 5.3 46 3 3,700 40 49 45 51 56
POPULATION, HEALTH, AND ENVIRONMENT DATA AND ESTIMATES FOR THE COUNTRIES AND REGIONS OF THE WORLD
© 2016 Population Reference Bureau See notes on page 20 2016 WORLD POPULATION DATA SHEET 13
Yemen 27.5 33 7 -1 36.3 47.1 43 4.2 40 3 3,660 35 34 29 63 67
SOUTH CENTRAL ASIA 1,929 23 7 -0 2,254 2,563 43 2.5 30 5 6,326 35 54 46 67 70
CENTRAL ASIA 70 24 6 -1 82 96 32 2.7 29 5 10,898 40 54 50 68 75
Kazakhstan 17.8 23 8 -1 20.5 24.7 9 2.6 25 7 24,260 53 51 50 68 77
Kyrgyzstan 6.1 28 6 -1 8.2 11.6 20 3.8 33 4 3,300 36 42 40 67 74
Tajikistan 8.6 31 6 -3 11.1 14.2 38 3.6 35 3 3,320 26 28 26 66 73
Turkmenistan 5.4 21 8 -1 6.2 6.6 45 2.2 28 4 15,760 50 48 46 62 70
Uzbekistan 31.9 23 5 -1 36.2 39.0 43 2.5 29 5 6,110 36 65 59 71 76
SOUTH ASIA 1,859 23 7 -0 2,172 2,467 43 2.5 30 5 6,155 35 54 46 67 70
Afghanistan 33.4 37 8 1 45.5 62.4 68 5.3 44 2 1,990 27 22 20 59 62
Bangladesh 162.9 20 5 -2 186.5 202.2 38 2.3 33 6 3,550 34 62 54 71 73
Bhutan 0.8 19 6 2 0.9 1.0 44 2.1 31 5 7,610 39 66 65 69 70
India 1,328.9 22 7 0 1,530.0 1,708.0 40 2.3 29 6 6,020 33 54 47 67 70
Iran 79.5 19 5 -1 87.9 91.6 14 1.8 24 5 17,400 72 77 57 74 77
Maldives 0.4 18 3 1 0.5 0.6 8 2.5 27 5 11,310 46 35 27 76 78
Nepal 28.4 22 7 -1 33.3 36.4 33 2.3 31 6 2,500 20 50 47 66 69
Pakistan 203.4 30 7 -1 265.6 344.0 67 3.7 36 4 5,350 39 35 26 66 67
Sri Lanka 21.2 16 6 -4 21.9 21.2 8 2.1 25 8 11,480 18 68 52 72 78
SOUTHEAST ASIA 633 19 7 -0 730 824 27 2.4 27 6 11,298 48 62 54 68 73
Brunei 0.4 16 3 2 0.5 0.5 8 1.9 23 4 — 77 — — 77 81
Cambodia 15.8 24 6 -2 19.0 22.5 26 2.6 32 4 3,290 21 56 39 61 66
Indonesia 259.4 20 7 -1 305.7 359.8 30 2.5 28 5 10,680 54 61 60 69 73
Laos 7.1 26 7 -3 8.7 10.4 55 3.0 35 4 5,380 39 50 42 65 68
Malaysia 30.8 17 5 2 36.1 40.7 6 2.0 25 6 26,140 75 49 32 72 77
Myanmar 52.4 19 8 -1 58.1 61.3 61 2.3 28 5 — 34 46 46 64 68
Philippines 102.6 23 7 -1 124.0 148.7 22 2.8 32 5 8,900 44 55 38 65 72
Singapore 5.6 8 4 8 6.3 6.6 1.7 1.2 15 12 81,190 100 62 55 80 85
Thailand 65.3 12 8 -1 66.8 63.3 10 1.6 18 11 15,210 50 79 77 72 79
Timor-Leste 1.3 37 7 -9 1.6 2.3 45 5.7 42 6 3,820 33 22 21 67 70
Vietnam 92.7 16 7 1 103.2 108.2 15 2.1 24 7 5,690 34 76 57 71 76
EAST ASIA 1,614 12 7 -0 1,643 1,554 10 1.6 17 12 17,048 60 82 81 75 79
China 1,378.0 12 7 -0 1,411.2 1,343.9 11 1.6 17 10 14,160 56 85 84 75 78
China, Hong Kong SARf 7.4 8 6 6 8.0 8.2 1.4 1.2 11 16 57,650 100 75 72 81 87
China, Macao SARf 0.7 11 3 9 0.7 0.8 2 1.1 12 9 120,890 100 — — 80 86
Japan 125.3 8 10 0 116.7 100.6 1.9 1.5 13 27 38,870 94 54 44 80 87
Korea, North 25.1 15 9 -0 26.7 27.0 25 2.0 21 10 — 61 71 65 66 74
Korea, South 50.8 9 5 0 52.2 48.1 3.0 1.2 14 14 34,700 82 80 70 79 86
Mongolia 3.1 27 6 0 3.8 4.6 15 3.1 27 4 11,070 67 55 48 65 75
Taiwan 23.5 9 7 0 23.3 20.5 4.0 1.2 14 13 — 77 71 — 77 83
EUROPE 740 11 11 2 744 728 5 1.6 16 17 32,614 74 71 61 75 81
EUROPEAN UNION 506 10 10 3 518 515 4 1.6 16 19 37,646 75 72 65 78 83
NORTHERN EUROPE 103 12 9 3 112 120 4 1.8 18 17 42,265 81 81 78 79 83
Channel Islands 0.2 10 8 4 0.2 0.2 2.9 1.6 15 16 — 32 — — 80 85
Denmark 5.7 10 9 9 6.2 6.3 3.5 1.7 17 19 47,810 88 — — 79 82
Estonia 1.3 11 12 2 1.3 1.2 2.4 1.6 16 19 27,510 69 63 58 72 82
Finland 5.5 10 10 2 5.8 5.9 1.7 1.6 16 20 40,840 84 77 75 78 85
Iceland 0.3 12 7 3 0.4 0.4 2.0 1.8 20 14 46,120 94 — — 81 84
Ireland 4.7 14 6 -3 5.1 5.7 3.1 1.9 22 13 46,410 63 65 61 79 83
Latvia 2.0 11 14 -4 1.6 1.5 4.2 1.6 15 19 24,220 68 68 56 69 80
Lithuania 2.9 11 14 -8 2.7 2.4 4.1 1.6 15 19 26,660 67 63 50 69 80
Norway 5.2 11 8 6 5.9 6.6 2.4 1.7 18 16 64,590 81 88 82 80 84
Sweden 9.9 12 9 8 11.5 12.6 2.5 1.8 17 20 47,390 86 75 65 80 84
United Kingdom 65.6 12 9 3 71.0 77.0 3.9 1.8 18 17 40,550 83 84 84 79 83
WESTERN EUROPE 193 10 10 8 201 205 3 1.7 16 19 46,052 79 71 68 79 84
Austria 8.8 10 10 13 9.2 9.7 3.0 1.5 14 18 47,510 66 70 68 79 84
Belgium 11.3 11 10 4 12.0 12.8 3.5 1.7 17 18 44,100 98 70 69 79 84
France 64.6 12 9 1 68.5 72.3 3.5 1.9 18 18 40,470 80 76 74 79 85
Germany 82.6 9 11 14 83.3 81.0 3.3 1.5 13 21 48,260 75 66 62 78 83
Liechtenstein 0.04 10 7 4 0.04 0.04 3.3 1.6 15 16 — 14 — — 81 84
Luxembourg 0.6 11 7 20 0.7 0.7 3.2 1.5 16 14 70,750 90 — — 80 85
Monaco 0.04 7 6 21 0.04 0.05 — 1.5 13 24 — 100 — — — —
Netherlands 17.0 10 9 3 17.8 18.1 3.6 1.7 17 18 48,400 90 69 67 80 83
Switzerland 8.4 10 8 9 9.5 10.3 3.9 1.5 15 18 61,930 84 82 78 81 85
Population
mid-2016
(millions)
Births
per 1,000
Population
Deaths
per 1,000
Population
Net
Migration
Rate per
1,000
Population Infant
Mortality
Ratea
Total
Fertility
Rateb
Percent
of Population
GNI
per Capita
($US)
Percent
Urban
Percent of Married
Women 15-49 Using
Contraceptionc
Life Expectancy
at Birth (years)
Ma
Dea
100,0
mid-2030
(millions)
mid-2050
(millions)
Ages
15
Ages
65+ 2015
All
Methods
Modern
Methods Males Females 2
WORLD 7,418 20 8 — 8,539 9,869 36 2.5 26 8 15,415 54 62 56 70 74
MORE DEVELOPED 1,254 11 10 3 1,298 1,322 5 1.7 16 18 39,963 78 70 62 76 82
LESS DEVELOPED 6,164 22 7 -0 7,241 8,548 39 2.6 28 7 10,214 49 61 55 68 72
LESS DEVELOPED (Excl. China) 4,778 24 7 -0 5,821 7,195 43 2.9 31 5 8,936 47 54 46 67 70
LEAST DEVELOPED 962 33 9 -1 1,318 1,923 59 4.3 41 4 2,424 32 36 32 61 64
AFRICA 1,203 36 10 -1 1,681 2,527 57 4.7 41 4 4,802 41 35 30 59 62
SUB-SAHARAN AFRICA 974 37 11 -0 1,388 2,128 62 5.0 43 3 3,606 39 31 26 57 59
NORTHERN AFRICA 229 29 6 -1 293 400 29 3.4 32 5 9,798 51 52 46 69 73
Algeria 40.8 26 5 0 50.6 63.2 21 3.1 29 6 14,280 71 57 48 73 78
Egypt 93.5 31 6 -1 121.6 168.8 22 3.5 31 4 10,690 43 58 57 70 73
Libya 6.3 20 5 -10 7.4 8.4 23 2.4 30 5 15,140 79 42 20 69 75
Morocco 34.7 20 6 -2 38.1 38.8 24 2.4 25 6 7,680 60 67 57 73 75
Sudan 42.1 37 8 -3 61.7 105.0 51 5.2 43 3 4,080 34 12 12 61 64
Tunisia 11.3 20 7 -1 13.1 14.9 17 2.4 24 8 11,060 68 62 50 73 77
Western Saharae 0.6 18 6 8 0.7 0.9 35 2.1 26 3 — 81 — — 67 71
WESTERN AFRICA 359 39 11 -1 515 800 64 5.4 44 3 4,135 45 18 13 55 56
Benin 10.8 36 9 -0 16.6 24.0 66 4.7 45 3 2,100 44 18 12 58 61
Burkina Faso 19.0 41 10 -1 28.2 47.0 65 5.7 49 3 1,640 30 21 20 57 60
Cape Verde 0.5 21 5 -4 0.6 0.7 19 2.3 28 6 6,390 66 61 57 71 80
Côte d’Ivoire 23.9 37 13 0 33.0 50.1 69 4.9 42 3 3,240 54 18 12 51 53
Gambia 2.1 41 9 -1 3.2 5.1 45 5.6 46 2 1,580 60 9 8 59 62
Ghana 28.2 33 8 -1 37.1 50.4 41 4.2 39 5 4,070 54 35 29 60 63
Guinea 11.2 37 10 -0 18.3 27.5 67 5.1 43 3 1,120 37 6 5 58 59
Guinea-Bissau 1.9 37 12 -1 2.5 3.6 88 4.9 43 3 1,450 49 16 14 54 57
Liberia 4.6 35 9 -1 6.4 9.4 54 4.7 42 3 720 50 20 19 60 62
Mali 17.3 44 13 -3 26.1 43.6 56 6.0 47 3 2,360 40 16 15 54 54
Mauritania 4.2 31 8 -1 5.7 8.0 72 4.2 40 3 3,710 60 11 10 62 65
Niger 19.7 49 9 -0 34.3 68.9 56 7.6 50 3 950 22 14 12 61 62
Nigeria 186.5 39 13 -0 261.9 397.5 69 5.5 43 3 5,800 48 15 10 53 53
Senegal 14.8 38 6 -1 21.6 34.4 39 5.0 44 4 2,390 45 23 21 65 68
Sierra Leone 6.6 37 14 -1 8.9 12.6 89 4.9 42 3 1,560 40 17 16 50 52 1,
Togo 7.5 36 9 -0 10.9 17.4 47 4.7 42 3 1,320 38 20 17 59 61
EASTERN AFRICA 394 36 9 -1 561 844 51 4.8 43 3 2,019 26 40 37 60 64
Burundi 11.1 42 10 0 17.2 30.4 63 6.1 46 2 730 12 32 30 58 61
Comoros 0.8 33 7 -3 1.0 1.4 36 4.3 40 3 1,430 28 19 14 62 65
Djibouti 0.9 25 9 -3 1.1 1.2 53 3.2 33 4 — 77 19 18 60 64
Eritrea 5.4 34 7 -5 7.3 10.4 43 4.2 43 3 — 23 8 7 62 66
Ethiopia 101.7 30 7 -0 132.9 168.6 47 4.2 41 3 1,620 20 37 36 62 66
Kenya 45.4 31 7 -0 63.7 88.2 39 3.9 42 3 3,060 26 66 63 60 65
Madagascar 23.7 33 7 0 32.9 47.1 36 4.3 41 3 1,400 35 40 33 64 67
Malawi 17.2 34 10 -0 23.4 32.2 42 4.4 40 4 1,140 16 59 58 62 64
Mauritius 1.3 10 8 -1 1.2 1.1 13.6 1.4 20 9 19,290 41 76 39 71 78
Mayotte 0.2 33 3 -0 0.3 0.5 4 4.0 44 3 — 47 — — 75 78
Mozambique 27.2 45 14 0 41.9 74.4 81 5.9 45 3 1,170 32 12 11 52 56
Reunion 0.8 17 5 -7 1.0 1.1 7 2.5 24 10 — 95 67 64 77 84
Rwanda 11.9 34 7 -1 16.4 23.6 32 4.2 41 3 1,720 29 53 48 62 66
Seychelles 0.09 17 7 1 0.1 0.1 13.4 2.4 22 8 25,760 54 — — 70 79
Somalia 11.1 44 12 -6 16.5 27.0 76 6.4 47 3 — 40 15 1 54 57
South Sudan 12.7 37 12 10 17.8 25.9 74 6.7 42 3 1,630 19 4 1 55 57
Tanzania 54.2 37 7 -1 81.5 134.8 43 5.2 45 3 2,620 30 38 32 64 66
Uganda 36.6 43 10 -4 58.1 101.5 53 5.8 48 3 1,780 20 34 30 62 64
Zambia 15.9 43 13 -0 24.1 41.0 52 5.3 46 3 3,700 40 49 45 51 56
POPULATION, HEALTH, AND ENVIRONMENT DATA AND ESTIMATES FOR THE COUNTRIES AND REGIONS OF THE WORLD
© 2016 Population Reference Bureau See notes on page 20 2016 WORLD POPULATION DATA SHEET 14
Lithuania 2.9 11 14 -8 2.7 2.4 4.1 1.6 15 19 26,660 67 63 50 69 80
Norway 5.2 11 8 6 5.9 6.6 2.4 1.7 18 16 64,590 81 88 82 80 84
Sweden 9.9 12 9 8 11.5 12.6 2.5 1.8 17 20 47,390 86 75 65 80 84
United Kingdom 65.6 12 9 3 71.0 77.0 3.9 1.8 18 17 40,550 83 84 84 79 83
WESTERN EUROPE 193 10 10 8 201 205 3 1.7 16 19 46,052 79 71 68 79 84
Austria 8.8 10 10 13 9.2 9.7 3.0 1.5 14 18 47,510 66 70 68 79 84
Belgium 11.3 11 10 4 12.0 12.8 3.5 1.7 17 18 44,100 98 70 69 79 84
France 64.6 12 9 1 68.5 72.3 3.5 1.9 18 18 40,470 80 76 74 79 85
Germany 82.6 9 11 14 83.3 81.0 3.3 1.5 13 21 48,260 75 66 62 78 83
Liechtenstein 0.04 10 7 4 0.04 0.04 3.3 1.6 15 16 — 14 — — 81 84
Luxembourg 0.6 11 7 20 0.7 0.7 3.2 1.5 16 14 70,750 90 — — 80 85
Monaco 0.04 7 6 21 0.04 0.05 — 1.5 13 24 — 100 — — — —
Netherlands 17.0 10 9 3 17.8 18.1 3.6 1.7 17 18 48,400 90 69 67 80 83
Switzerland 8.4 10 8 9 9.5 10.3 3.9 1.5 15 18 61,930 84 82 78 81 85
EASTERN EUROPE 293 12 13 -1 281 261 6 1.6 16 15 21,212 69 69 57 68 78
Belarus 9.5 13 13 2 9.3 9.1 3.0 1.8 16 14 16,840 78 63 51 68 78
Bulgaria 7.1 9 15 -1 6.6 5.8 6.6 1.5 14 20 16,790 73 69 40 71 78
Czech Republic 10.6 11 11 2 10.8 11.1 2.5 1.6 15 18 30,420 73 86 78 76 82
Hungary 9.8 9 13 -0 9.7 9.4 4.1 1.4 14 18 24,630 71 81 71 72 79
Moldova 3.6 11 11 1 3.4 2.8 10 1.3 16 10 5,350 42 60 42 68 76
Poland 38.4 10 10 -0 37.3 33.9 4.0 1.3 15 16 25,400 60 — — 74 82
Romania 19.8 9 12 -27 17.4 13.9 7.5 1.2 16 15 20,900 55 70 50 72 79
Russiag 144.3 13 13 2 142.6 136.4 6.5 1.8 17 14 23,790 74 68 55 66 77
Slovakia 5.4 10 10 1 5.4 4.9 5.1 1.4 15 14 28,200 54 80 66 73 80
Ukraineg 42.7 10 14 0 39.1 33.6 8.1 1.5 15 16 7,810 70 68 61 66 76
SOUTHERN EUROPE 150 9 10 0 150 143 4 1.4 15 19 30,960 70 66 48 79 84
Albania 2.9 11 8 -6 2.8 2.4 7.1 1.7 18 13 11,140 58 69 10 76 80
Andorra 0.08 9 4 8 0.08 0.07 3.4 1.2 15 14 — 85 — — — —
Bosnia-Herzegovina 3.5 8 9 -0 3.3 2.8 6 1.3 15 14 10,610 40 46 12 74 79
Croatia 4.2 9 13 -4 3.9 3.5 5.0 1.5 15 19 21,730 59 — — 74 81
Greece 10.8 8 10 1 10.4 9.2 3.8 1.3 15 19 26,790 78 76 46 78 84
Italy 60.6 8 11 2 63.5 63.5 3.2 1.4 14 22 35,850 69 63 41 80 85
Kosovoh 1.8 17 5 -31 1.8 1.8 12 2.3 24 8 9,840 38 66 14 74 79
Macedoniai 2.1 11 10 0 2.1 1.9 9 1.5 17 13 13,570 57 40 13 73 77
Malta 0.4 10 8 7 0.4 0.4 5.7 1.4 14 18 27,390 95 86 46 80 84
Montenegro 0.6 12 10 -3 0.7 0.7 4.6 1.6 18 14 15,890 64 23 15 74 79
Portugal 10.3 8 11 -1 9.9 9.1 3.0 1.3 14 20 28,590 64 87 82 77 83
San Marino 0.03 8 7 6 0.03 0.03 2.3 1.5 15 18 — 94 — — 84 89
Serbia 7.1 9 15 2 6.4 5.3 4.6 1.5 14 18 12,800 60 58 18 73 78
Slovenia 2.1 10 10 0 2.0 1.9 2.1 1.6 15 18 30,830 50 79 63 78 84
Spain 43.3 9 9 -1 42.4 39.8 2.8 1.3 15 18 34,490 80 66 62 80 85
OCEANIA 40 17 7 7 51 66 20 2.3 24 12 32,456 70 62 58 75 80
Australia 24.1 13 7 9 30.9 41.3 3.4 1.8 19 15 44,570 89 72 68 80 84
Federated States of Micronesia 0.1 23 5 -14 0.1 0.1 29 3.4 34 4 3,600 22 — 70 68 72
Fiji 0.9 18 9 -6 0.9 1.0 14 3.1 29 6 8,700 51 29 — 67 73
French Polynesia 0.3 16 5 -0 0.3 0.3 6.0 2.0 24 7 — 56 — — 75 79
Guam 0.2 21 5 -6 0.2 0.3 9.4 3.0 26 8 — 94 67 58 76 82
Kiribati 0.1 30 8 -3 0.1 0.2 45 3.9 35 4 4,150 54 22 18 63 68
Marshall Islands 0.06 27 4 -17 0.06 0.08 22 4.1 41 2 4,710 74 45 42 71 72
Nauru 0.01 34 8 -8 0.01 0.01 18 3.9 37 13 — 100 36 23 63 70
New Caledonia 0.3 17 5 6 0.3 0.4 4 2.3 24 8 — 70 — — 74 80
New Zealand 4.7 13 7 14 5.3 5.9 4.1 2.0 20 15 35,680 86 75 72 80 83
Palau 0.02 13 9 0 0.02 0.02 12 2.1 20 6 14,700 87 33 30 70 76
Papua New Guinea 8.2 28 8 0 10.5 13.9 46 3.7 39 3 2,800 13 32 24 61 65
Samoa 0.2 28 5 -28 0.2 0.2 15 5.1 38 6 5,720 18 27 24 73 76
Solomon Islands 0.7 30 5 0 0.9 1.2 22 4.0 39 3 2,180 20 35 27 66 73
Tonga 0.1 26 7 -19 0.1 0.1 17 4.1 37 6 5,290 24 34 28 74 78
Tuvalu 0.01 25 9 -3 0.01 0.01 10 3.6 33 5 5,430 60 30 22 67 72
Vanuatu 0.3 32 5 0 0.4 0.6 28 4.2 40 4 3,040 26 49 36 72 75
Population
mid-2016
(millions)
Births per
1,000
Population
Deaths
per 1,000
Population
Net
Migration
Rate per
1,000
mid-2030
(millions)
mid-2050
(millions)
Infant
Mortality
Ratea
Total
Fertility
Rateb
Ages
15
Ages
65+
GNI per
Capita
($US) 2015
Percent
Urban
All
Methods
Modern
Methods
Males Females 2
Population Percent of Percent of Married Life Expectancy Ma
Population
mid-2016
(millions)
Births
per 1,000
Population
Deaths
per 1,000
Population
Net
Migration
Rate per
1,000
Population Infant
Mortality
Ratea
Total
Fertility
Rateb
Percent
of Population
GNI
per Capita
($US)
Percent
Urban
Percent of Married
Women 15-49 Using
Contraceptionc
Life Expectancy
at Birth (years)
Ma
Dea
100,0
mid-2030
(millions)
mid-2050
(millions)
Ages
15
Ages
65+ 2015
All
Methods
Modern
Methods Males Females 2
WORLD 7,418 20 8 — 8,539 9,869 36 2.5 26 8 15,415 54 62 56 70 74
MORE DEVELOPED 1,254 11 10 3 1,298 1,322 5 1.7 16 18 39,963 78 70 62 76 82
LESS DEVELOPED 6,164 22 7 -0 7,241 8,548 39 2.6 28 7 10,214 49 61 55 68 72
LESS DEVELOPED (Excl. China) 4,778 24 7 -0 5,821 7,195 43 2.9 31 5 8,936 47 54 46 67 70
LEAST DEVELOPED 962 33 9 -1 1,318 1,923 59 4.3 41 4 2,424 32 36 32 61 64
AFRICA 1,203 36 10 -1 1,681 2,527 57 4.7 41 4 4,802 41 35 30 59 62
SUB-SAHARAN AFRICA 974 37 11 -0 1,388 2,128 62 5.0 43 3 3,606 39 31 26 57 59
NORTHERN AFRICA 229 29 6 -1 293 400 29 3.4 32 5 9,798 51 52 46 69 73
Algeria 40.8 26 5 0 50.6 63.2 21 3.1 29 6 14,280 71 57 48 73 78
Egypt 93.5 31 6 -1 121.6 168.8 22 3.5 31 4 10,690 43 58 57 70 73
Libya 6.3 20 5 -10 7.4 8.4 23 2.4 30 5 15,140 79 42 20 69 75
Morocco 34.7 20 6 -2 38.1 38.8 24 2.4 25 6 7,680 60 67 57 73 75
Sudan 42.1 37 8 -3 61.7 105.0 51 5.2 43 3 4,080 34 12 12 61 64
Tunisia 11.3 20 7 -1 13.1 14.9 17 2.4 24 8 11,060 68 62 50 73 77
Western Saharae 0.6 18 6 8 0.7 0.9 35 2.1 26 3 — 81 — — 67 71
WESTERN AFRICA 359 39 11 -1 515 800 64 5.4 44 3 4,135 45 18 13 55 56
Benin 10.8 36 9 -0 16.6 24.0 66 4.7 45 3 2,100 44 18 12 58 61
Burkina Faso 19.0 41 10 -1 28.2 47.0 65 5.7 49 3 1,640 30 21 20 57 60
Cape Verde 0.5 21 5 -4 0.6 0.7 19 2.3 28 6 6,390 66 61 57 71 80
Côte d’Ivoire 23.9 37 13 0 33.0 50.1 69 4.9 42 3 3,240 54 18 12 51 53
Gambia 2.1 41 9 -1 3.2 5.1 45 5.6 46 2 1,580 60 9 8 59 62
Ghana 28.2 33 8 -1 37.1 50.4 41 4.2 39 5 4,070 54 35 29 60 63
Guinea 11.2 37 10 -0 18.3 27.5 67 5.1 43 3 1,120 37 6 5 58 59
Guinea-Bissau 1.9 37 12 -1 2.5 3.6 88 4.9 43 3 1,450 49 16 14 54 57
Liberia 4.6 35 9 -1 6.4 9.4 54 4.7 42 3 720 50 20 19 60 62
Mali 17.3 44 13 -3 26.1 43.6 56 6.0 47 3 2,360 40 16 15 54 54
Mauritania 4.2 31 8 -1 5.7 8.0 72 4.2 40 3 3,710 60 11 10 62 65
Niger 19.7 49 9 -0 34.3 68.9 56 7.6 50 3 950 22 14 12 61 62
Nigeria 186.5 39 13 -0 261.9 397.5 69 5.5 43 3 5,800 48 15 10 53 53
Senegal 14.8 38 6 -1 21.6 34.4 39 5.0 44 4 2,390 45 23 21 65 68
Sierra Leone 6.6 37 14 -1 8.9 12.6 89 4.9 42 3 1,560 40 17 16 50 52 1,
Togo 7.5 36 9 -0 10.9 17.4 47 4.7 42 3 1,320 38 20 17 59 61
EASTERN AFRICA 394 36 9 -1 561 844 51 4.8 43 3 2,019 26 40 37 60 64
Burundi 11.1 42 10 0 17.2 30.4 63 6.1 46 2 730 12 32 30 58 61
Comoros 0.8 33 7 -3 1.0 1.4 36 4.3 40 3 1,430 28 19 14 62 65
Djibouti 0.9 25 9 -3 1.1 1.2 53 3.2 33 4 — 77 19 18 60 64
Eritrea 5.4 34 7 -5 7.3 10.4 43 4.2 43 3 — 23 8 7 62 66
Ethiopia 101.7 30 7 -0 132.9 168.6 47 4.2 41 3 1,620 20 37 36 62 66
Kenya 45.4 31 7 -0 63.7 88.2 39 3.9 42 3 3,060 26 66 63 60 65
Madagascar 23.7 33 7 0 32.9 47.1 36 4.3 41 3 1,400 35 40 33 64 67
Malawi 17.2 34 10 -0 23.4 32.2 42 4.4 40 4 1,140 16 59 58 62 64
Mauritius 1.3 10 8 -1 1.2 1.1 13.6 1.4 20 9 19,290 41 76 39 71 78
Mayotte 0.2 33 3 -0 0.3 0.5 4 4.0 44 3 — 47 — — 75 78
Mozambique 27.2 45 14 0 41.9 74.4 81 5.9 45 3 1,170 32 12 11 52 56
Reunion 0.8 17 5 -7 1.0 1.1 7 2.5 24 10 — 95 67 64 77 84
Rwanda 11.9 34 7 -1 16.4 23.6 32 4.2 41 3 1,720 29 53 48 62 66
Seychelles 0.09 17 7 1 0.1 0.1 13.4 2.4 22 8 25,760 54 — — 70 79
Somalia 11.1 44 12 -6 16.5 27.0 76 6.4 47 3 — 40 15 1 54 57
South Sudan 12.7 37 12 10 17.8 25.9 74 6.7 42 3 1,630 19 4 1 55 57
Tanzania 54.2 37 7 -1 81.5 134.8 43 5.2 45 3 2,620 30 38 32 64 66
Uganda 36.6 43 10 -4 58.1 101.5 53 5.8 48 3 1,780 20 34 30 62 64
Zambia 15.9 43 13 -0 24.1 41.0 52 5.3 46 3 3,700 40 49 45 51 56
POPULATION, HEALTH, AND ENVIRONMENT DATA AND ESTIMATES FOR THE COUNTRIES AND REGIONS OF THE WORLD
© 2016 Population Reference Bureau See notes on page 20 2016 WORLD POPULATION DATA SHEET 15
ercent
pulation
GNI
per Capita
($US)
Percent
Urban
Percent of Married
Women 15-49 Using
Contraceptionc
Life Expectancy
at Birth (years)
Maternal
Deaths per
100,000 Births
Percent Ages 15-49
With HIV/AIDS
Carbon Emissions
(million metric tons)
Percent of
Population
With Access to
Electricity
Percent of Total
Energy Consumption
From Renewable
Sourcesd
Percent of
Terrestrial Land
Under Protected
Area Status
Population
per Square
Kilometer
of Arable Land
Ages
65+ 2015
All
Methods
Modern
Methods Males Females 2015
Males
2015
Females
2015 1992 2013 2012 2013 2014
8 15,415 54 62 56 70 74 216 — — 6,110 9,776 85 18 15 526
18 39,963 78 70 62 76 82 12 — — 3,730 3,556 100 — 14 238
7 10,214 49 61 55 68 72 239 — — 2,169 5,678 81 — 16 697
5 8,936 47 54 46 67 70 267 — — 1,424 2,870 75 — 15 614
4 2,424 32 36 32 61 64 437 1.6 2.2 20 76 34 — 13 550
4 4,802 41 35 30 59 62 490 3.2 4.7 189 346 45 — 14 514
3 3,606 39 31 26 57 59 557 4.0 6.0 124 209 35 — 16 502
5 9,798 51 52 46 69 73 126 0.1 0.1 66 136 88 — 6 571
6 14,280 71 57 48 73 78 140 0.1 0.1 22.1 36.6 100 0 8 545
4 10,690 43 58 57 70 73 33 0.1 0.1 22.2 58.1 100 5 11 3,415
5 15,140 79 42 20 69 75 9 — — 10.2 13.9 100 2 0 368
6 7,680 60 67 57 73 75 121 0.1 0.1 7.1 16.0 100 11 34 431
3 4,080 34 12 12 61 64 311 0.3 0.2 — 4.2 33 64 2 245
8 11,060 68 62 50 73 77 62 0.1 0.1 4.1 7.5 100 13 5 396
3 — 81 — — 67 71 — — — — — — — 0 —
3 4,135 45 18 13 55 56 674 1.9 2.7 23 41 47 — 13 421
3 2,100 44 18 12 58 61 405 0.9 1.2 0.2 1.6 38 51 28 400
3 1,640 30 21 20 57 60 371 0.6 1.0 0.2 0.8 13 80 15 306
6 6,390 66 61 57 71 80 42 0.9 1.1 0.0 0.1 71 21 3 961
3 3,240 54 18 12 51 53 645 2.5 3.8 1.3 2.5 56 74 23 823
2 1,580 60 9 8 59 62 706 1.4 2.2 0.1 0.1 35 49 4 474
5 4,070 54 35 29 60 63 319 1.3 2.0 1.1 4.0 64 49 15 601
3 1,120 37 6 5 58 59 679 1.2 2.0 0.3 0.6 26 76 29 361
3 1,450 49 16 14 54 57 549 — — 0.0 0.1 61 89 16 629
3 720 50 20 19 60 62 725 0.8 1.4 0.1 0.3 10 89 3 923
3 2,360 40 16 15 54 54 587 1.0 1.5 0.1 0.3 26 84 8 269
3 3,710 60 11 10 62 65 602 0.5 0.6 0.3 0.7 22 33 1 926
3 950 22 14 12 61 62 553 0.4 0.5 0.2 0.5 14 81 18 124
3 5,800 48 15 10 53 53 814 2.5 3.7 17.5 26.1 56 86 14 549
4 2,390 45 23 21 65 68 315 0.4 0.6 0.9 2.3 56 51 25 455
3 1,560 40 17 16 50 52 1,360 1.0 1.6 0.1 0.3 14 80 11 415
3 1,320 38 20 17 59 61 368 1.9 2.9 0.2 0.6 31 73 25 283
3 2,019 26 40 37 60 64 434 — — 11 22 22 — 19 575
2 730 12 32 30 58 61 712 0.8 1.3 0.1 0.1 7 97 7 925
3 1,430 28 19 14 62 65 335 — — 0.0 0.0 69 47 10 1,240
4 — 77 19 18 60 64 229 1.3 1.8 0.1 0.2 53 34 1 44,980
3 — 23 8 7 62 66 501 0.4 0.8 0.2 0.2 36 80 5 776
3 1,620 20 37 36 62 66 353 — — 0.8 2.9 27 93 18 673
3 3,060 26 66 63 60 65 510 4.8 7.0 1.5 3.6 23 79 12 783
3 1,400 35 40 33 64 67 353 0.4 0.3 0.3 0.8 15 79 5 676
4 1,140 16 59 58 62 64 634 7.1 11.1 0.2 0.3 10 79 17 453
9 19,290 41 76 39 71 78 53 1.3 0.5 0.5 1.0 100 3 5 1,685
3 — 47 — — 75 78 — — — — — — — 0 2,665
3 1,170 32 12 11 52 56 489 8.7 12.3 0.3 1.1 20 88 17 481
10 — 95 67 64 77 84 — — — 0.4 1.2 — — 76 2,381
3 1,720 29 53 48 62 66 290 2.3 3.5 0.1 0.2 18 87 9 1,006
8 25,760 54 — — 70 79 — — — 0.0 0.2 100 1 42 117,072
3 — 40 15 1 54 57 732 0.5 0.5 0.0 0.2 33 94 1 1,007
3 1,630 19 4 1 55 57 789 2.0 2.9 — 0.4 5 — 21 —
3 2,620 30 38 32 64 66 398 3.7 5.6 0.6 2.9 15 88 32 402
3 1,780 20 34 30 62 64 343 5.9 8.3 0.2 1.3 18 90 16 530
3 3,700 40 49 45 51 56 224 10.9 15.0 0.7 1.0 22 88 38 431
Population
mid-2016
(millions)
Births
per 1,000
Population
Deaths
per 1,000
Population
Net
Migration
Rate per
1,000
Population Infant
Mortality
Ratea
Total
Fertility
Rateb
Percent
of Population
GNI
per Capita
($US)
Percent
Urban
Percent of Married
Women 15-49 Using
Contraceptionc
Life Expectancy
at Birth (years)
Ma
Dea
100,0
mid-2030
(millions)
mid-2050
(millions)
Ages
15
Ages
65+ 2015
All
Methods
Modern
Methods Males Females 2
WORLD 7,418 20 8 — 8,539 9,869 36 2.5 26 8 15,415 54 62 56 70 74
MORE DEVELOPED 1,254 11 10 3 1,298 1,322 5 1.7 16 18 39,963 78 70 62 76 82
LESS DEVELOPED 6,164 22 7 -0 7,241 8,548 39 2.6 28 7 10,214 49 61 55 68 72
LESS DEVELOPED (Excl. China) 4,778 24 7 -0 5,821 7,195 43 2.9 31 5 8,936 47 54 46 67 70
LEAST DEVELOPED 962 33 9 -1 1,318 1,923 59 4.3 41 4 2,424 32 36 32 61 64
AFRICA 1,203 36 10 -1 1,681 2,527 57 4.7 41 4 4,802 41 35 30 59 62
SUB-SAHARAN AFRICA 974 37 11 -0 1,388 2,128 62 5.0 43 3 3,606 39 31 26 57 59
NORTHERN AFRICA 229 29 6 -1 293 400 29 3.4 32 5 9,798 51 52 46 69 73
Algeria 40.8 26 5 0 50.6 63.2 21 3.1 29 6 14,280 71 57 48 73 78
Egypt 93.5 31 6 -1 121.6 168.8 22 3.5 31 4 10,690 43 58 57 70 73
Libya 6.3 20 5 -10 7.4 8.4 23 2.4 30 5 15,140 79 42 20 69 75
Morocco 34.7 20 6 -2 38.1 38.8 24 2.4 25 6 7,680 60 67 57 73 75
Sudan 42.1 37 8 -3 61.7 105.0 51 5.2 43 3 4,080 34 12 12 61 64
Tunisia 11.3 20 7 -1 13.1 14.9 17 2.4 24 8 11,060 68 62 50 73 77
Western Saharae 0.6 18 6 8 0.7 0.9 35 2.1 26 3 — 81 — — 67 71
WESTERN AFRICA 359 39 11 -1 515 800 64 5.4 44 3 4,135 45 18 13 55 56
Benin 10.8 36 9 -0 16.6 24.0 66 4.7 45 3 2,100 44 18 12 58 61
Burkina Faso 19.0 41 10 -1 28.2 47.0 65 5.7 49 3 1,640 30 21 20 57 60
Cape Verde 0.5 21 5 -4 0.6 0.7 19 2.3 28 6 6,390 66 61 57 71 80
Côte d’Ivoire 23.9 37 13 0 33.0 50.1 69 4.9 42 3 3,240 54 18 12 51 53
Gambia 2.1 41 9 -1 3.2 5.1 45 5.6 46 2 1,580 60 9 8 59 62
Ghana 28.2 33 8 -1 37.1 50.4 41 4.2 39 5 4,070 54 35 29 60 63
Guinea 11.2 37 10 -0 18.3 27.5 67 5.1 43 3 1,120 37 6 5 58 59
Guinea-Bissau 1.9 37 12 -1 2.5 3.6 88 4.9 43 3 1,450 49 16 14 54 57
Liberia 4.6 35 9 -1 6.4 9.4 54 4.7 42 3 720 50 20 19 60 62
Mali 17.3 44 13 -3 26.1 43.6 56 6.0 47 3 2,360 40 16 15 54 54
Mauritania 4.2 31 8 -1 5.7 8.0 72 4.2 40 3 3,710 60 11 10 62 65
Niger 19.7 49 9 -0 34.3 68.9 56 7.6 50 3 950 22 14 12 61 62
Nigeria 186.5 39 13 -0 261.9 397.5 69 5.5 43 3 5,800 48 15 10 53 53
Senegal 14.8 38 6 -1 21.6 34.4 39 5.0 44 4 2,390 45 23 21 65 68
Sierra Leone 6.6 37 14 -1 8.9 12.6 89 4.9 42 3 1,560 40 17 16 50 52 1,
Togo 7.5 36 9 -0 10.9 17.4 47 4.7 42 3 1,320 38 20 17 59 61
EASTERN AFRICA 394 36 9 -1 561 844 51 4.8 43 3 2,019 26 40 37 60 64
Burundi 11.1 42 10 0 17.2 30.4 63 6.1 46 2 730 12 32 30 58 61
Comoros 0.8 33 7 -3 1.0 1.4 36 4.3 40 3 1,430 28 19 14 62 65
Djibouti 0.9 25 9 -3 1.1 1.2 53 3.2 33 4 — 77 19 18 60 64
Eritrea 5.4 34 7 -5 7.3 10.4 43 4.2 43 3 — 23 8 7 62 66
Ethiopia 101.7 30 7 -0 132.9 168.6 47 4.2 41 3 1,620 20 37 36 62 66
Kenya 45.4 31 7 -0 63.7 88.2 39 3.9 42 3 3,060 26 66 63 60 65
Madagascar 23.7 33 7 0 32.9 47.1 36 4.3 41 3 1,400 35 40 33 64 67
Malawi 17.2 34 10 -0 23.4 32.2 42 4.4 40 4 1,140 16 59 58 62 64
Mauritius 1.3 10 8 -1 1.2 1.1 13.6 1.4 20 9 19,290 41 76 39 71 78
Mayotte 0.2 33 3 -0 0.3 0.5 4 4.0 44 3 — 47 — — 75 78
Mozambique 27.2 45 14 0 41.9 74.4 81 5.9 45 3 1,170 32 12 11 52 56
Reunion 0.8 17 5 -7 1.0 1.1 7 2.5 24 10 — 95 67 64 77 84
Rwanda 11.9 34 7 -1 16.4 23.6 32 4.2 41 3 1,720 29 53 48 62 66
Seychelles 0.09 17 7 1 0.1 0.1 13.4 2.4 22 8 25,760 54 — — 70 79
Somalia 11.1 44 12 -6 16.5 27.0 76 6.4 47 3 — 40 15 1 54 57
South Sudan 12.7 37 12 10 17.8 25.9 74 6.7 42 3 1,630 19 4 1 55 57
Tanzania 54.2 37 7 -1 81.5 134.8 43 5.2 45 3 2,620 30 38 32 64 66
Uganda 36.6 43 10 -4 58.1 101.5 53 5.8 48 3 1,780 20 34 30 62 64
Zambia 15.9 43 13 -0 24.1 41.0 52 5.3 46 3 3,700 40 49 45 51 56
POPULATION, HEALTH, AND ENVIRONMENT DATA AND ESTIMATES FOR THE COUNTRIES AND REGIONS OF THE WORLD
ercent
pulation
GNI
per Capita
($US)
Percent
Urban
Percent of Married
Women 15-49 Using
Contraceptionc
Life Expectancy
at Birth (years)
Maternal
Deaths per
100,000 Births
Percent Ages 15-49
With HIV/AIDS
Carbon Emissions
(million metric tons)
Percent of
Population
With Access to
Electricity
Percent of Total
Energy Consumption
From Renewable
Sourcesd
Percent of
Terrestrial Land
Under Protected
Area Status
Population
per Square
Kilometer
of Arable Land
Ages
65+ 2015
All
Methods
Modern
Methods Males Females 2015
Males
2015
Females
2015 1992 2013 2012 2013 2014
8 15,415 54 62 56 70 74 216 — — 6,110 9,776 85 18 15 526
18 39,963 78 70 62 76 82 12 — — 3,730 3,556 100 — 14 238
7 10,214 49 61 55 68 72 239 — — 2,169 5,678 81 — 16 697
5 8,936 47 54 46 67 70 267 — — 1,424 2,870 75 — 15 614
4 2,424 32 36 32 61 64 437 1.6 2.2 20 76 34 — 13 550
4 4,802 41 35 30 59 62 490 3.2 4.7 189 346 45 — 14 514
3 3,606 39 31 26 57 59 557 4.0 6.0 124 209 35 — 16 502
5 9,798 51 52 46 69 73 126 0.1 0.1 66 136 88 — 6 571
6 14,280 71 57 48 73 78 140 0.1 0.1 22.1 36.6 100 0 8 545
4 10,690 43 58 57 70 73 33 0.1 0.1 22.2 58.1 100 5 11 3,415
5 15,140 79 42 20 69 75 9 — — 10.2 13.9 100 2 0 368
6 7,680 60 67 57 73 75 121 0.1 0.1 7.1 16.0 100 11 34 431
3 4,080 34 12 12 61 64 311 0.3 0.2 — 4.2 33 64 2 245
8 11,060 68 62 50 73 77 62 0.1 0.1 4.1 7.5 100 13 5 396
3 — 81 — — 67 71 — — — — — — — 0 —
3 4,135 45 18 13 55 56 674 1.9 2.7 23 41 47 — 13 421
3 2,100 44 18 12 58 61 405 0.9 1.2 0.2 1.6 38 51 28 400
3 1,640 30 21 20 57 60 371 0.6 1.0 0.2 0.8 13 80 15 306
6 6,390 66 61 57 71 80 42 0.9 1.1 0.0 0.1 71 21 3 961
3 3,240 54 18 12 51 53 645 2.5 3.8 1.3 2.5 56 74 23 823
2 1,580 60 9 8 59 62 706 1.4 2.2 0.1 0.1 35 49 4 474
5 4,070 54 35 29 60 63 319 1.3 2.0 1.1 4.0 64 49 15 601
3 1,120 37 6 5 58 59 679 1.2 2.0 0.3 0.6 26 76 29 361
3 1,450 49 16 14 54 57 549 — — 0.0 0.1 61 89 16 629
3 720 50 20 19 60 62 725 0.8 1.4 0.1 0.3 10 89 3 923
3 2,360 40 16 15 54 54 587 1.0 1.5 0.1 0.3 26 84 8 269
3 3,710 60 11 10 62 65 602 0.5 0.6 0.3 0.7 22 33 1 926
3 950 22 14 12 61 62 553 0.4 0.5 0.2 0.5 14 81 18 124
3 5,800 48 15 10 53 53 814 2.5 3.7 17.5 26.1 56 86 14 549
4 2,390 45 23 21 65 68 315 0.4 0.6 0.9 2.3 56 51 25 455
3 1,560 40 17 16 50 52 1,360 1.0 1.6 0.1 0.3 14 80 11 415
3 1,320 38 20 17 59 61 368 1.9 2.9 0.2 0.6 31 73 25 283
3 2,019 26 40 37 60 64 434 — — 11 22 22 — 19 575
2 730 12 32 30 58 61 712 0.8 1.3 0.1 0.1 7 97 7 925
3 1,430 28 19 14 62 65 335 — — 0.0 0.0 69 47 10 1,240
4 — 77 19 18 60 64 229 1.3 1.8 0.1 0.2 53 34 1 44,980
3 — 23 8 7 62 66 501 0.4 0.8 0.2 0.2 36 80 5 776
3 1,620 20 37 36 62 66 353 — — 0.8 2.9 27 93 18 673
3 3,060 26 66 63 60 65 510 4.8 7.0 1.5 3.6 23 79 12 783
3 1,400 35 40 33 64 67 353 0.4 0.3 0.3 0.8 15 79 5 676
4 1,140 16 59 58 62 64 634 7.1 11.1 0.2 0.3 10 79 17 453
9 19,290 41 76 39 71 78 53 1.3 0.5 0.5 1.0 100 3 5 1,685
3 — 47 — — 75 78 — — — — — — — 0 2,665
3 1,170 32 12 11 52 56 489 8.7 12.3 0.3 1.1 20 88 17 481
10 — 95 67 64 77 84 — — — 0.4 1.2 — — 76 2,381
3 1,720 29 53 48 62 66 290 2.3 3.5 0.1 0.2 18 87 9 1,006
8 25,760 54 — — 70 79 — — — 0.0 0.2 100 1 42 117,072
3 — 40 15 1 54 57 732 0.5 0.5 0.0 0.2 33 94 1 1,007
3 1,630 19 4 1 55 57 789 2.0 2.9 — 0.4 5 — 21 —
3 2,620 30 38 32 64 66 398 3.7 5.6 0.6 2.9 15 88 32 402
3 1,780 20 34 30 62 64 343 5.9 8.3 0.2 1.3 18 90 16 530
3 3,700 40 49 45 51 56 224 10.9 15.0 0.7 1.0 22 88 38 431
© 2016 Population Reference Bureau See notes on page 20 2016 WORLD POPULATION DATA SHEET 16
3 1,620 20 37 36 62 66 353 — — 0.8 2.9 27 93 18 673
3 3,060 26 66 63 60 65 510 4.8 7.0 1.5 3.6 23 79 12 783
3 1,400 35 40 33 64 67 353 0.4 0.3 0.3 0.8 15 79 5 676
4 1,140 16 59 58 62 64 634 7.1 11.1 0.2 0.3 10 79 17 453
9 19,290 41 76 39 71 78 53 1.3 0.5 0.5 1.0 100 3 5 1,685
3 — 47 — — 75 78 — — — — — — — 0 2,665
3 1,170 32 12 11 52 56 489 8.7 12.3 0.3 1.1 20 88 17 481
10 — 95 67 64 77 84 — — — 0.4 1.2 — — 76 2,381
3 1,720 29 53 48 62 66 290 2.3 3.5 0.1 0.2 18 87 9 1,006
8 25,760 54 — — 70 79 — — — 0.0 0.2 100 1 42 117,072
3 — 40 15 1 54 57 732 0.5 0.5 0.0 0.2 33 94 1 1,007
3 1,630 19 4 1 55 57 789 2.0 2.9 — 0.4 5 — 21 —
3 2,620 30 38 32 64 66 398 3.7 5.6 0.6 2.9 15 88 32 402
3 1,780 20 34 30 62 64 343 5.9 8.3 0.2 1.3 18 90 16 530
3 3,700 40 49 45 51 56 224 10.9 15.0 0.7 1.0 22 88 38 431
3 1,700 33 66 66 56 59 443 12.1 17.2 4.6 3.8 40 76 27 400
3 2,617 47 21 11 51 54 653 1.6 2.3 5 15 26 — 14 607
2 6,450 62 18 12 51 54 477 1.8 2.6 1.4 8.9 37 57 7 527
3 3,080 54 34 21 56 59 596 3.6 5.3 1.0 1.9 54 78 11 393
4 600 40 15 9 49 53 882 3.0 4.3 0.1 0.1 11 78 18 278
2 2,110 22 6 5 51 53 856 1.6 2.5 0.0 0.2 6 91 18 296
3 6,300 65 30 18 57 60 442 — — 0.4 0.7 42 48 35 882
3 720 42 21 8 49 52 693 0.7 1.0 0.8 0.8 16 96 12 1,124
3 16,450 40 13 10 56 59 342 4.0 5.8 0.1 1.5 66 30 25 725
5 18,810 87 31 19 64 65 291 2.3 5.3 1.3 1.3 89 70 20 543
4 3,160 67 41 37 64 68 156 — — 0.0 0.0 60 43 0 2,279
5 12,404 62 60 59 60 63 166 15.1 23.7 85 132 80 — 22 456
5 15,600 57 53 51 62 67 129 17.8 26.8 0.8 1.5 53 24 29 819
5 3,160 27 60 60 50 50 487 18.9 26.6 — 0.6 21 4 1 872
4 10,380 47 56 55 62 67 265 10.7 15.9 0.3 0.8 47 33 38 317
5 12,830 65 60 60 60 64 138 14.9 23.6 83.9 128.5 85 17 9 445
4 8,040 21 66 66 50 48 389 23.2 34.2 0.1 0.3 42 39 4 745
10 30,077 80 73 68 74 80 52 — — 1,743 2,054 98 — 19 270
15 55,179 81 74 68 77 81 13 — — 1,460 1,544 100 — 15 182
16 43,970 82 74 72 79 84 7 — — 120.3 129.7 100 21 9 79
15 56,430 81 74 68 76 81 14 — — 1,339.3 1,414.3 100 8 14 213
8 14,512 80 73 67 72 79 67 0.6 0.3 283 509 96 — 23 371
6 14,896 74 72 65 74 79 54 0.5 0.2 96 147 95 — 16 624
4 7,880 45 55 52 71 77 28 1.6 1.5 0.1 0.1 100 27 37 485
7 14,880 77 76 75 77 82 25 0.5 0.2 1.0 2.1 100 39 27 2,108
8 8,220 67 72 68 68 78 54 0.7 0.4 0.9 1.7 94 34 8 878
5 7,510 52 61 49 69 76 88 0.7 0.4 1.6 3.7 79 66 32 1,651
5 4,740 55 73 64 71 76 129 0.4 0.3 0.8 2.5 82 53 22 804
6 17,150 79 72 66 74 79 38 0.4 0.1 89.6 133.2 99 9 13 560
5 5,050 59 80 76 72 78 150 0.4 0.1 0.7 1.2 78 53 37 421
8 20,710 67 63 60 75 81 94 0.9 0.4 1.2 2.8 91 23 21 718
9 — 70 62 58 71 76 175 1.1 1.1 22 37 82 — 14 806
7 22,220 24 — — 74 80 — — — 0.1 0.1 91 — 5 2,323
6 22,930 83 — — 72 78 80 4.2 2.3 0.5 0.8 100 2 13 4,781
14 15,930 32 59 55 73 78 27 2.1 1.0 0.3 0.4 91 9 0 2,564
14 — 77 74 72 78 82 39 0.4 0.2 8.6 10.7 100 19 12 355
16 — 89 — — 75 81 — — — — 1.4 91 — — —
10 10,420 70 — — 72 77 — — — 0.0 0.0 93 12 22 1,213
7 13,570 79 70 68 71 77 92 1.1 1.0 3.0 6.0 98 13 23 1,329
7 12,520 36 — — 74 79 27 — — 0.0 0.1 91 10 2 3,719
15 — 98 — — 76 83 — — — 0.4 0.6 — — 66 1,948
4 1,760 59 34 31 61 65 359 1.3 2.1 0.2 0.7 38 83 0 1,037
9 8,860 55 72 68 73 78 89 2.0 1.3 2.1 2.1 93 15 16 2,277
18 — 89 — — 78 84 — — — 0.6 0.7 — — 62 3,055
18 24,030 99 84 72 76 83 14 — — — — 91 1 10 5,598
8 23,700 32 — — 73 78 — — — — 0.1 91 — 3 990
9 10,820 18 56 52 75 82 48 — — 0.1 0.1 91 2 17 5,911
Ethiopia 101.7 30 7 -0 132.9 168.6 47 4.2 41 3 1,620 20 37 36 62 66
Kenya 45.4 31 7 -0 63.7 88.2 39 3.9 42 3 3,060 26 66 63 60 65
Madagascar 23.7 33 7 0 32.9 47.1 36 4.3 41 3 1,400 35 40 33 64 67
Malawi 17.2 34 10 -0 23.4 32.2 42 4.4 40 4 1,140 16 59 58 62 64
Mauritius 1.3 10 8 -1 1.2 1.1 13.6 1.4 20 9 19,290 41 76 39 71 78
Mayotte 0.2 33 3 -0 0.3 0.5 4 4.0 44 3 — 47 — — 75 78
Mozambique 27.2 45 14 0 41.9 74.4 81 5.9 45 3 1,170 32 12 11 52 56
Reunion 0.8 17 5 -7 1.0 1.1 7 2.5 24 10 — 95 67 64 77 84
Rwanda 11.9 34 7 -1 16.4 23.6 32 4.2 41 3 1,720 29 53 48 62 66
Seychelles 0.09 17 7 1 0.1 0.1 13.4 2.4 22 8 25,760 54 — — 70 79
Somalia 11.1 44 12 -6 16.5 27.0 76 6.4 47 3 — 40 15 1 54 57
South Sudan 12.7 37 12 10 17.8 25.9 74 6.7 42 3 1,630 19 4 1 55 57
Tanzania 54.2 37 7 -1 81.5 134.8 43 5.2 45 3 2,620 30 38 32 64 66
Uganda 36.6 43 10 -4 58.1 101.5 53 5.8 48 3 1,780 20 34 30 62 64
Zambia 15.9 43 13 -0 24.1 41.0 52 5.3 46 3 3,700 40 49 45 51 56
Zimbabwe 16.0 36 10 -3 22.2 33.2 50 4.0 42 3 1,700 33 66 66 56 59
MIDDLE AFRICA 157 44 14 -0 238 396 88 6.0 45 3 2,617 47 21 11 51 54
Angola 25.8 45 14 1 39.4 65.5 93 6.0 48 2 6,450 62 18 12 51 54
Cameroon 24.4 38 10 -0 34.4 51.9 55 4.9 43 3 3,080 54 34 21 56 59
Central African Republic 5.0 34 14 0 6.7 9.7 90 4.4 39 4 600 40 15 9 49 53
Chad 14.5 47 14 1 22.7 38.5 87 6.4 48 2 2,110 22 6 5 51 53
Congo 4.9 37 10 -7 6.7 10.2 48 4.7 41 3 6,300 65 30 18 57 60
Congo, Dem. Rep. 79.8 46 16 -0 124.2 213.8 97 6.5 46 3 720 42 21 8 49 52
Equatorial Guinea 0.9 35 11 5 1.3 2.0 67 4.9 39 3 16,450 40 13 10 56 59
Gabon 1.8 32 9 1 2.4 3.5 43 4.1 37 5 18,810 87 31 19 64 65
Sao Tome and Principe 0.2 33 7 -6 0.3 0.3 38 4.4 42 4 3,160 67 41 37 64 68
SOUTHERN AFRICA 64 23 10 3 74 88 36 2.5 31 5 12,404 62 60 59 60 63
Botswana 2.2 25 8 2 2.7 3.3 31 2.8 33 5 15,600 57 53 51 62 67
Lesotho 2.2 29 15 -2 2.6 3.4 59 3.3 36 5 3,160 27 60 60 50 50
Namibia 2.5 29 7 0 3.3 4.7 39 3.6 34 4 10,380 47 56 55 62 67
South Africa 55.7 22 10 3 63.4 75.2 34 2.4 30 5 12,830 65 60 60 60 64
Swaziland 1.3 29 14 -1 1.5 1.8 50 3.3 37 4 8,040 21 66 66 50 48
AMERICAS 998 15 7 1 1,117 1,221 14 2.0 23 10 30,077 80 73 68 74 80
NORTHERN AMERICA 360 12 8 4 401 445 6 1.8 19 15 55,179 81 74 68 77 81
Canada 36.2 11 8 6 41.0 46.9 4.4 1.6 16 16 43,970 82 74 72 79 84
United States 323.9 12 8 4 359.4 398.3 5.8 1.8 19 15 56,430 81 74 68 76 81
LATIN AMERICA AND THE CARIBBEAN 637 17 6 -1 716 775 17 2.1 26 8 14,512 80 73 67 72 79
CENTRAL AMERICA 175 19 5 -1 205 232 16 2.3 29 6 14,896 74 72 65 74 79
Belize 0.4 22 6 4 0.5 0.6 14 2.5 36 4 7,880 45 55 52 71 77
Costa Rica 4.9 15 4 1 5.6 6.1 8.0 1.8 23 7 14,880 77 76 75 77 82
El Salvador 6.4 18 7 -7 6.7 6.7 17 2.0 27 8 8,220 67 72 68 68 78
Guatemala 16.6 24 5 -1 21.3 27.6 28 3.1 40 5 7,510 52 61 49 69 76
Honduras 8.2 22 5 -2 10.2 12.6 26 2.5 32 5 4,740 55 73 64 71 76
Mexico 128.6 19 5 -1 148.1 163.8 13 2.2 28 6 17,150 79 72 66 74 79
Nicaragua 6.3 20 5 -4 7.5 9.1 19 2.4 30 5 5,050 59 80 76 72 78
Panama 4.0 19 5 2 4.8 5.7 14 2.4 27 8 20,710 67 63 60 75 81
CARIBBEAN 43 17 8 -4 47 49 28 2.3 26 9 — 70 62 58 71 76
Antigua and Barbuda 0.09 12 6 -0 0.1 0.1 16 1.5 24 7 22,220 24 — — 74 80
Bahamas 0.4 14 6 4 0.4 0.5 14 1.8 26 6 22,930 83 — — 72 78
Barbados 0.3 12 9 2 0.3 0.3 12 1.7 19 14 15,930 32 59 55 73 78
Cuba 11.2 11 9 -2 11.1 10.2 4.2 1.7 16 14 — 77 74 72 78 82
Curaçao 0.2 12 9 10 0.2 0.2 10.2 1.9 19 16 — 89 — — 75 81
Dominica 0.07 14 9 -1 0.08 0.07 20 2.1 22 10 10,420 70 — — 72 77
Dominican Republic 10.6 20 6 -3 12.1 13.2 31 2.4 30 7 13,570 79 70 68 71 77
Grenada 0.1 17 8 -2 0.1 0.1 15 2.1 26 7 12,520 36 — — 74 79
Guadeloupe 0.4 12 8 -1 0.4 0.4 8.8 2.2 22 15 — 98 — — 76 83
Haiti 11.1 26 8 -3 13.3 16.2 42 3.2 35 4 1,760 59 34 31 61 65
Jamaica 2.7 14 6 -5 2.8 2.6 17 2.0 24 9 8,860 55 72 68 73 78
Martinique 0.4 12 9 -3 0.4 0.3 7 2.1 18 18 — 89 — — 78 84
Puerto Rico 3.4 10 9 -19 3.4 3.1 7.0 1.4 17 18 24,030 99 84 72 76 83
St. Kitts-Nevis 0.05 14 8 7 0.06 0.07 13 1.8 21 8 23,700 32 — — 73 78
Saint Lucia 0.2 12 6 2 0.2 0.2 18 1.5 22 9 10,820 18 56 52 75 82
POPULATION, HEALTH, AND ENVIRONMENT DATA AND ESTIMATES FOR THE COUNTRIES AND REGIONS OF THE WORLD
ercent
pulation
GNI
per Capita
($US)
Percent
Urban
Percent of Married
Women 15-49 Using
Contraceptionc
Life Expectancy
at Birth (years)
Maternal
Deaths per
100,000 Births
Percent Ages 15-49
With HIV/AIDS
Carbon Emissions
(million metric tons)
Percent of
Population
With Access to
Electricity
Percent of Total
Energy Consumption
From Renewable
Sourcesd
Percent of
Terrestrial Land
Under Protected
Area Status
Population
per Square
Kilometer
of Arable Land
Ages
65+ 2015
All
Methods
Modern
Methods Males Females 2015
Males
2015
Females
2015 1992 2013 2012 2013 2014
8 15,415 54 62 56 70 74 216 — — 6,110 9,776 85 18 15 526
18 39,963 78 70 62 76 82 12 — — 3,730 3,556 100 — 14 238
7 10,214 49 61 55 68 72 239 — — 2,169 5,678 81 — 16 697
5 8,936 47 54 46 67 70 267 — — 1,424 2,870 75 — 15 614
4 2,424 32 36 32 61 64 437 1.6 2.2 20 76 34 — 13 550
4 4,802 41 35 30 59 62 490 3.2 4.7 189 346 45 — 14 514
3 3,606 39 31 26 57 59 557 4.0 6.0 124 209 35 — 16 502
5 9,798 51 52 46 69 73 126 0.1 0.1 66 136 88 — 6 571
6 14,280 71 57 48 73 78 140 0.1 0.1 22.1 36.6 100 0 8 545
4 10,690 43 58 57 70 73 33 0.1 0.1 22.2 58.1 100 5 11 3,415
5 15,140 79 42 20 69 75 9 — — 10.2 13.9 100 2 0 368
6 7,680 60 67 57 73 75 121 0.1 0.1 7.1 16.0 100 11 34 431
3 4,080 34 12 12 61 64 311 0.3 0.2 — 4.2 33 64 2 245
8 11,060 68 62 50 73 77 62 0.1 0.1 4.1 7.5 100 13 5 396
3 — 81 — — 67 71 — — — — — — — 0 —
3 4,135 45 18 13 55 56 674 1.9 2.7 23 41 47 — 13 421
3 2,100 44 18 12 58 61 405 0.9 1.2 0.2 1.6 38 51 28 400
3 1,640 30 21 20 57 60 371 0.6 1.0 0.2 0.8 13 80 15 306
6 6,390 66 61 57 71 80 42 0.9 1.1 0.0 0.1 71 21 3 961
3 3,240 54 18 12 51 53 645 2.5 3.8 1.3 2.5 56 74 23 823
2 1,580 60 9 8 59 62 706 1.4 2.2 0.1 0.1 35 49 4 474
5 4,070 54 35 29 60 63 319 1.3 2.0 1.1 4.0 64 49 15 601
3 1,120 37 6 5 58 59 679 1.2 2.0 0.3 0.6 26 76 29 361
3 1,450 49 16 14 54 57 549 — — 0.0 0.1 61 89 16 629
3 720 50 20 19 60 62 725 0.8 1.4 0.1 0.3 10 89 3 923
3 2,360 40 16 15 54 54 587 1.0 1.5 0.1 0.3 26 84 8 269
3 3,710 60 11 10 62 65 602 0.5 0.6 0.3 0.7 22 33 1 926
3 950 22 14 12 61 62 553 0.4 0.5 0.2 0.5 14 81 18 124
3 5,800 48 15 10 53 53 814 2.5 3.7 17.5 26.1 56 86 14 549
4 2,390 45 23 21 65 68 315 0.4 0.6 0.9 2.3 56 51 25 455
3 1,560 40 17 16 50 52 1,360 1.0 1.6 0.1 0.3 14 80 11 415
3 1,320 38 20 17 59 61 368 1.9 2.9 0.2 0.6 31 73 25 283
3 2,019 26 40 37 60 64 434 — — 11 22 22 — 19 575
2 730 12 32 30 58 61 712 0.8 1.3 0.1 0.1 7 97 7 925
3 1,430 28 19 14 62 65 335 — — 0.0 0.0 69 47 10 1,240
4 — 77 19 18 60 64 229 1.3 1.8 0.1 0.2 53 34 1 44,980
3 — 23 8 7 62 66 501 0.4 0.8 0.2 0.2 36 80 5 776
3 1,620 20 37 36 62 66 353 — — 0.8 2.9 27 93 18 673
3 3,060 26 66 63 60 65 510 4.8 7.0 1.5 3.6 23 79 12 783
3 1,400 35 40 33 64 67 353 0.4 0.3 0.3 0.8 15 79 5 676
4 1,140 16 59 58 62 64 634 7.1 11.1 0.2 0.3 10 79 17 453
9 19,290 41 76 39 71 78 53 1.3 0.5 0.5 1.0 100 3 5 1,685
3 — 47 — — 75 78 — — — — — — — 0 2,665
3 1,170 32 12 11 52 56 489 8.7 12.3 0.3 1.1 20 88 17 481
10 — 95 67 64 77 84 — — — 0.4 1.2 — — 76 2,381
3 1,720 29 53 48 62 66 290 2.3 3.5 0.1 0.2 18 87 9 1,006
8 25,760 54 — — 70 79 — — — 0.0 0.2 100 1 42 117,072
3 — 40 15 1 54 57 732 0.5 0.5 0.0 0.2 33 94 1 1,007
3 1,630 19 4 1 55 57 789 2.0 2.9 — 0.4 5 — 21 —
3 2,620 30 38 32 64 66 398 3.7 5.6 0.6 2.9 15 88 32 402
3 1,780 20 34 30 62 64 343 5.9 8.3 0.2 1.3 18 90 16 530
3 3,700 40 49 45 51 56 224 10.9 15.0 0.7 1.0 22 88 38 431
© 2016 Population Reference Bureau See notes on page 20 2016 WORLD POPULATION DATA SHEET 17
14 15,930 32 59 55 73 78 27 2.1 1.0 0.3 0.4 91 9 0 2,564
14 — 77 74 72 78 82 39 0.4 0.2 8.6 10.7 100 19 12 355
16 — 89 — — 75 81 — — — — 1.4 91 — — —
10 10,420 70 — — 72 77 — — — 0.0 0.0 93 12 22 1,213
7 13,570 79 70 68 71 77 92 1.1 1.0 3.0 6.0 98 13 23 1,329
7 12,520 36 — — 74 79 27 — — 0.0 0.1 91 10 2 3,719
15 — 98 — — 76 83 — — — 0.4 0.6 — — 66 1,948
4 1,760 59 34 31 61 65 359 1.3 2.1 0.2 0.7 38 83 0 1,037
9 8,860 55 72 68 73 78 89 2.0 1.3 2.1 2.1 93 15 16 2,277
18 — 89 — — 78 84 — — — 0.6 0.7 — — 62 3,055
18 24,030 99 84 72 76 83 14 — — — — 91 1 10 5,598
8 23,700 32 — — 73 78 — — — — 0.1 91 — 3 990
9 10,820 18 56 52 75 82 48 — — 0.1 0.1 91 2 17 5,911
7 11,000 51 — — 71 75 45 — — 0.0 0.1 76 5 22 2,207
9 29,630 8 42 38 71 78 63 1.2 1.3 5.7 12.7 100 0 32 5,420
8 14,628 83 75 69 72 79 63 0.6 0.3 165 324 98 — 25 302
11 — 92 55 53 73 80 52 0.5 0.3 33.1 51.8 100 9 7 110
5 6,840 68 61 35 68 74 206 0.4 0.2 1.8 5.4 91 28 25 248
8 15,020 86 80 77 72 79 44 0.7 0.4 60.2 137.4 100 44 28 271
11 21,740 83 64 — 77 82 22 0.5 0.1 8.9 22.7 100 30 18 1,390
7 13,520 76 79 73 72 79 64 0.7 0.3 16.9 24.4 97 26 23 2,899
7 11,190 64 73 60 73 79 64 0.4 0.2 6.1 11.9 97 13 26 1,384
5 — 84 — — 77 83 — — — 0.2 0.2 — — 52 2,084
5 7,520 29 34 33 64 69 229 1.4 1.6 0.3 0.5 79 36 9 181
5 8,670 60 79 70 71 75 132 0.6 0.3 0.7 1.4 98 63 7 156
7 11,960 79 75 52 72 77 68 0.5 0.2 5.6 15.6 91 28 31 758
7 16,870 66 48 47 68 74 155 1.1 1.1 0.6 0.6 100 19 15 913
14 20,360 95 77 75 74 81 15 0.7 0.2 1.4 2.1 100 46 3 150
6 17,730 89 70 62 72 78 95 0.7 0.4 28.9 50.6 100 11 54 1,149
8 11,969 48 65 59 71 74 122 — — 2,002 5,158 89 — 13 919
7 10,800 44 56 48 69 72 147 — — 1,258 2,350 84 — 11 810
5 25,602 70 54 38 71 76 86 — — 227 468 94 — 15 682
11 8,720 64 55 27 72 78 25 0.3 0.1 1.5 1.5 100 7 25 668
6 17,140 53 51 14 72 77 25 0.2 0.1 15.3 9.7 100 3 14 507
2 39,140 100 62 31 76 78 15 — — 3.0 8.7 98 — 3 90,404
12 30,840 67 — — 78 82 7 — — 1.4 1.6 100 8 18 1,473
14 9,410 54 53 35 71 79 36 0.6 0.2 4.2 2.0 100 29 8 882
3 14,850 70 52 34 67 72 50 — — 16.8 45.8 100 2 0 763
11 34,940 92 — — 80 84 5 — — 11.7 19.4 100 9 20 2,869
3 10,740 84 61 42 73 76 58 — — 3.3 6.8 100 3 2 3,543
2 79,970 98 52 39 74 76 4 — — 5.8 26.7 98 — 18 38,196
7 14,120 88 58 34 76 78 15 0.1 0.1 2.8 6.2 100 5 3 4,726
3 37,340 75 30 19 75 78 17 — — 3.3 16.7 98 — 11 11,541
3 5,070 75 57 44 71 75 45 — — — 0.7 98 — 0 10,441
1 140,720 99 38 34 77 80 13 — — 7.3 23.2 98 — 3 17,556
3 54,730 83 24 — 73 75 12 — — 77.9 147.6 98 0 31 1,033
4 — 58 54 38 64 77 68 — — 11.7 9.8 96 2 1 369
8 19,360 73 74 47 75 79 16 — — 41.8 88.2 100 13 0 386
1 70,570 86 28 24 76 79 6 — — 15.9 46.1 98 0 19 24,712
3 3,660 35 34 29 63 67 385 0.1 0.1 3.9 6.9 48 1 1 2,200
5 6,326 35 54 46 67 70 171 — — 398 918 80 — 6 744
5 10,898 40 54 50 68 75 33 0.3 0.1 118 122 100 — 5 184
7 24,260 53 51 50 68 77 12 0.3 0.1 73.6 71.7 100 1 3 61
4 3,300 36 42 40 67 74 76 0.3 0.1 3.1 2.7 100 22 7 477
3 3,320 26 28 26 66 73 32 0.4 0.2 2.0 1.0 100 58 22 1,005
4 15,760 50 48 46 62 70 42 — — 9.0 18.2 100 — 3 280
5 6,110 36 65 59 71 76 36 0.2 0.1 30.4 28.2 100 2 3 724
5 6,155 35 54 46 67 70 176 — — 280 796 78 — 7 840
2 1,990 27 22 20 59 62 396 0.1 0.1 0.4 5.8 43 11 0 429
6 3,550 34 62 54 71 73 176 0.1 0.1 4.8 18.8 60 38 5 2,122
5 7,610 39 66 65 69 70 148 — — 0.1 0.2 76 90 47 769
6 6,020 33 54 47 67 70 174 — — 190.6 554.9 79 39 5 846
POPULATION, HEALTH, AND ENVIRONMENT DATA AND ESTIMATES FOR THE COUNTRIES AND REGIONS OF THE WORLD
ercent
pulation
GNI
per Capita
($US)
Percent
Urban
Percent of Married
Women 15-49 Using
Contraceptionc
Life Expectancy
at Birth (years)
Maternal
Deaths per
100,000 Births
Percent Ages 15-49
With HIV/AIDS
Carbon Emissions
(million metric tons)
Percent of
Population
With Access to
Electricity
Percent of Total
Energy Consumption
From Renewable
Sourcesd
Percent of
Terrestrial Land
Under Protected
Area Status
Population
per Square
Kilometer
of Arable Land
Ages
65+ 2015
All
Methods
Modern
Methods Males Females 2015
Males
2015
Females
2015 1992 2013 2012 2013 2014
8 15,415 54 62 56 70 74 216 — — 6,110 9,776 85 18 15 526
18 39,963 78 70 62 76 82 12 — — 3,730 3,556 100 — 14 238
7 10,214 49 61 55 68 72 239 — — 2,169 5,678 81 — 16 697
5 8,936 47 54 46 67 70 267 — — 1,424 2,870 75 — 15 614
4 2,424 32 36 32 61 64 437 1.6 2.2 20 76 34 — 13 550
4 4,802 41 35 30 59 62 490 3.2 4.7 189 346 45 — 14 514
3 3,606 39 31 26 57 59 557 4.0 6.0 124 209 35 — 16 502
5 9,798 51 52 46 69 73 126 0.1 0.1 66 136 88 — 6 571
6 14,280 71 57 48 73 78 140 0.1 0.1 22.1 36.6 100 0 8 545
4 10,690 43 58 57 70 73 33 0.1 0.1 22.2 58.1 100 5 11 3,415
5 15,140 79 42 20 69 75 9 — — 10.2 13.9 100 2 0 368
6 7,680 60 67 57 73 75 121 0.1 0.1 7.1 16.0 100 11 34 431
3 4,080 34 12 12 61 64 311 0.3 0.2 — 4.2 33 64 2 245
8 11,060 68 62 50 73 77 62 0.1 0.1 4.1 7.5 100 13 5 396
3 — 81 — — 67 71 — — — — — — — 0 —
3 4,135 45 18 13 55 56 674 1.9 2.7 23 41 47 — 13 421
3 2,100 44 18 12 58 61 405 0.9 1.2 0.2 1.6 38 51 28 400
3 1,640 30 21 20 57 60 371 0.6 1.0 0.2 0.8 13 80 15 306
6 6,390 66 61 57 71 80 42 0.9 1.1 0.0 0.1 71 21 3 961
3 3,240 54 18 12 51 53 645 2.5 3.8 1.3 2.5 56 74 23 823
2 1,580 60 9 8 59 62 706 1.4 2.2 0.1 0.1 35 49 4 474
5 4,070 54 35 29 60 63 319 1.3 2.0 1.1 4.0 64 49 15 601
3 1,120 37 6 5 58 59 679 1.2 2.0 0.3 0.6 26 76 29 361
3 1,450 49 16 14 54 57 549 — — 0.0 0.1 61 89 16 629
3 720 50 20 19 60 62 725 0.8 1.4 0.1 0.3 10 89 3 923
3 2,360 40 16 15 54 54 587 1.0 1.5 0.1 0.3 26 84 8 269
3 3,710 60 11 10 62 65 602 0.5 0.6 0.3 0.7 22 33 1 926
3 950 22 14 12 61 62 553 0.4 0.5 0.2 0.5 14 81 18 124
3 5,800 48 15 10 53 53 814 2.5 3.7 17.5 26.1 56 86 14 549
4 2,390 45 23 21 65 68 315 0.4 0.6 0.9 2.3 56 51 25 455
3 1,560 40 17 16 50 52 1,360 1.0 1.6 0.1 0.3 14 80 11 415
3 1,320 38 20 17 59 61 368 1.9 2.9 0.2 0.6 31 73 25 283
3 2,019 26 40 37 60 64 434 — — 11 22 22 — 19 575
2 730 12 32 30 58 61 712 0.8 1.3 0.1 0.1 7 97 7 925
3 1,430 28 19 14 62 65 335 — — 0.0 0.0 69 47 10 1,240
4 — 77 19 18 60 64 229 1.3 1.8 0.1 0.2 53 34 1 44,980
3 — 23 8 7 62 66 501 0.4 0.8 0.2 0.2 36 80 5 776
3 1,620 20 37 36 62 66 353 — — 0.8 2.9 27 93 18 673
3 3,060 26 66 63 60 65 510 4.8 7.0 1.5 3.6 23 79 12 783
3 1,400 35 40 33 64 67 353 0.4 0.3 0.3 0.8 15 79 5 676
4 1,140 16 59 58 62 64 634 7.1 11.1 0.2 0.3 10 79 17 453
9 19,290 41 76 39 71 78 53 1.3 0.5 0.5 1.0 100 3 5 1,685
3 — 47 — — 75 78 — — — — — — — 0 2,665
3 1,170 32 12 11 52 56 489 8.7 12.3 0.3 1.1 20 88 17 481
10 — 95 67 64 77 84 — — — 0.4 1.2 — — 76 2,381
3 1,720 29 53 48 62 66 290 2.3 3.5 0.1 0.2 18 87 9 1,006
8 25,760 54 — — 70 79 — — — 0.0 0.2 100 1 42 117,072
3 — 40 15 1 54 57 732 0.5 0.5 0.0 0.2 33 94 1 1,007
3 1,630 19 4 1 55 57 789 2.0 2.9 — 0.4 5 — 21 —
3 2,620 30 38 32 64 66 398 3.7 5.6 0.6 2.9 15 88 32 402
3 1,780 20 34 30 62 64 343 5.9 8.3 0.2 1.3 18 90 16 530
Barbados 0.3 12 9 2 0.3 0.3 12 1.7 19 14 15,930 32 59 55 73 78
Cuba 11.2 11 9 -2 11.1 10.2 4.2 1.7 16 14 — 77 74 72 78 82
Curaçao 0.2 12 9 10 0.2 0.2 10.2 1.9 19 16 — 89 — — 75 81
Dominica 0.07 14 9 -1 0.08 0.07 20 2.1 22 10 10,420 70 — — 72 77
Dominican Republic 10.6 20 6 -3 12.1 13.2 31 2.4 30 7 13,570 79 70 68 71 77
Grenada 0.1 17 8 -2 0.1 0.1 15 2.1 26 7 12,520 36 — — 74 79
Guadeloupe 0.4 12 8 -1 0.4 0.4 8.8 2.2 22 15 — 98 — — 76 83
Haiti 11.1 26 8 -3 13.3 16.2 42 3.2 35 4 1,760 59 34 31 61 65
Jamaica 2.7 14 6 -5 2.8 2.6 17 2.0 24 9 8,860 55 72 68 73 78
Martinique 0.4 12 9 -3 0.4 0.3 7 2.1 18 18 — 89 — — 78 84
Puerto Rico 3.4 10 9 -19 3.4 3.1 7.0 1.4 17 18 24,030 99 84 72 76 83
St. Kitts-Nevis 0.05 14 8 7 0.06 0.07 13 1.8 21 8 23,700 32 — — 73 78
Saint Lucia 0.2 12 6 2 0.2 0.2 18 1.5 22 9 10,820 18 56 52 75 82
St. Vincent and the Grenadines 0.1 16 7 -8 0.1 0.1 20 2.0 25 7 11,000 51 — — 71 75
Trinidad and Tobago 1.4 14 8 -1 1.4 1.3 13 1.7 21 9 29,630 8 42 38 71 78
SOUTH AMERICA 419 16 6 -0 465 494 17 2.1 25 8 14,628 83 75 69 72 79
Argentina 43.6 18 8 1 49.1 55.2 10.8 2.3 25 11 — 92 55 53 73 80
Bolivia 11.0 24 6 -2 13.3 16.5 36 3.0 33 5 6,840 68 61 35 68 74
Brazil 206.1 14 6 0 223.1 226.3 18 1.8 23 8 15,020 86 80 77 72 79
Chile 18.2 14 6 2 20.3 21.7 7.4 1.8 20 11 21,740 83 64 — 77 82
Colombia 48.8 16 6 -1 53.3 55.0 15 2.3 27 7 13,520 76 79 73 72 79
Ecuador 16.5 21 5 -0 19.7 23.2 20 2.5 29 7 11,190 64 73 60 73 79
French Guiana 0.3 26 3 -2 0.4 0.6 9 3.5 34 5 — 84 — — 77 83
Guyana 0.8 20 8 -7 0.8 0.8 32 2.6 29 5 7,520 29 34 33 64 69
Paraguay 7.0 22 6 -3 8.2 9.3 28 2.6 32 5 8,670 60 79 70 71 75
Peru 31.5 20 6 -1 35.9 40.1 17 2.5 28 7 11,960 79 75 52 72 77
Suriname 0.5 18 7 -2 0.6 0.7 17 2.3 27 7 16,870 66 48 47 68 74
Uruguay 3.5 14 10 -1 3.6 3.7 9.3 1.9 21 14 20,360 95 77 75 74 81
Venezuela 31.0 20 5 -2 36.1 40.5 12.8 2.4 28 6 17,730 89 70 62 72 78
ASIA 4,437 18 7 -0 4,946 5,327 31 2.1 25 8 11,969 48 65 59 71 74
ASIA (Excl. China) 3,051 21 7 0 3,527 3,974 37 2.4 28 7 10,800 44 56 48 69 72
WESTERN ASIA 261 22 5 3 320 386 22 2.8 29 5 25,602 70 54 38 71 76
Armenia 3.0 14 9 -1 2.8 2.4 9 1.6 19 11 8,720 64 55 27 72 78
Azerbaijan 9.8 17 6 0 10.6 10.8 10 2.1 22 6 17,140 53 51 14 72 77
Bahrain 1.4 16 2 3 1.7 1.9 8 2.1 17 2 39,140 100 62 31 76 78
Cyprus 1.2 12 6 -12 1.3 1.4 5 1.4 17 12 30,840 67 — — 78 82
Georgia 4.0 13 11 -1 3.7 3.1 9 1.7 17 14 9,410 54 53 35 71 79
Iraq 38.1 32 4 2 53.4 76.5 37 4.2 40 3 14,850 70 52 34 67 72
Israel 8.2 21 5 1 10.3 13.8 3.1 3.1 28 11 34,940 92 — — 80 84
Jordan 8.2 27 4 -13 9.0 11.4 16 3.5 37 3 10,740 84 61 42 73 76
Kuwait 4.0 17 2 22 5.0 6.0 7 2.2 22 2 79,970 98 52 39 74 76
Lebanon 6.2 15 5 -1 5.5 5.6 8 1.7 25 7 14,120 88 58 34 76 78
Oman 4.4 21 2 39 5.1 6.0 8 2.9 21 3 37,340 75 30 19 75 78
Palestinian Territory 4.8 32 4 -2 6.5 8.8 18 4.1 40 3 5,070 75 57 44 71 75
Qatar 2.5 12 1 75 3.0 3.5 7 2.0 15 1 140,720 99 38 34 77 80
Saudi Arabia 31.7 22 4 3 39.9 50.0 15 2.8 30 3 54,730 83 24 — 73 75
Syria 17.2 22 4 -20 26.1 31.2 16 2.7 32 4 — 58 54 38 64 77
Turkey 79.5 17 5 7 88.4 93.5 11 2.1 24 8 19,360 73 74 47 75 79
United Arab Emirates 9.3 11 2 8 11.0 12.8 6 1.8 14 1 70,570 86 28 24 76 79
Yemen 27.5 33 7 -1 36.3 47.1 43 4.2 40 3 3,660 35 34 29 63 67
SOUTH CENTRAL ASIA 1,929 23 7 -0 2,254 2,563 43 2.5 30 5 6,326 35 54 46 67 70
CENTRAL ASIA 70 24 6 -1 82 96 32 2.7 29 5 10,898 40 54 50 68 75
Kazakhstan 17.8 23 8 -1 20.5 24.7 9 2.6 25 7 24,260 53 51 50 68 77
Kyrgyzstan 6.1 28 6 -1 8.2 11.6 20 3.8 33 4 3,300 36 42 40 67 74
Tajikistan 8.6 31 6 -3 11.1 14.2 38 3.6 35 3 3,320 26 28 26 66 73
Turkmenistan 5.4 21 8 -1 6.2 6.6 45 2.2 28 4 15,760 50 48 46 62 70
Uzbekistan 31.9 23 5 -1 36.2 39.0 43 2.5 29 5 6,110 36 65 59 71 76
SOUTH ASIA 1,859 23 7 -0 2,172 2,467 43 2.5 30 5 6,155 35 54 46 67 70
Afghanistan 33.4 37 8 1 45.5 62.4 68 5.3 44 2 1,990 27 22 20 59 62
Bangladesh 162.9 20 5 -2 186.5 202.2 38 2.3 33 6 3,550 34 62 54 71 73
Bhutan 0.8 19 6 2 0.9 1.0 44 2.1 31 5 7,610 39 66 65 69 70
India 1,328.9 22 7 0 1,530.0 1,708.0 40 2.3 29 6 6,020 33 54 47 67 70
ercent
pulation
GNI
per Capita
($US)
Percent
Urban
Percent of Married
Women 15-49 Using
Contraceptionc
Life Expectancy
at Birth (years)
Maternal
Deaths per
100,000 Births
Percent Ages 15-49
With HIV/AIDS
Carbon Emissions
(million metric tons)
Percent of
Population
With Access to
Electricity
Percent of Total
Energy Consumption
From Renewable
Sourcesd
Percent of
Terrestrial Land
Under Protected
Area Status
Population
per Square
Kilometer
of Arable Land
Ages
65+ 2015
All
Methods
Modern
Methods Males Females 2015
Males
2015
Females
2015 1992 2013 2012 2013 2014
8 15,415 54 62 56 70 74 216 — — 6,110 9,776 85 18 15 526
18 39,963 78 70 62 76 82 12 — — 3,730 3,556 100 — 14 238
7 10,214 49 61 55 68 72 239 — — 2,169 5,678 81 — 16 697
5 8,936 47 54 46 67 70 267 — — 1,424 2,870 75 — 15 614
4 2,424 32 36 32 61 64 437 1.6 2.2 20 76 34 — 13 550
4 4,802 41 35 30 59 62 490 3.2 4.7 189 346 45 — 14 514
3 3,606 39 31 26 57 59 557 4.0 6.0 124 209 35 — 16 502
5 9,798 51 52 46 69 73 126 0.1 0.1 66 136 88 — 6 571
6 14,280 71 57 48 73 78 140 0.1 0.1 22.1 36.6 100 0 8 545
4 10,690 43 58 57 70 73 33 0.1 0.1 22.2 58.1 100 5 11 3,415
5 15,140 79 42 20 69 75 9 — — 10.2 13.9 100 2 0 368
6 7,680 60 67 57 73 75 121 0.1 0.1 7.1 16.0 100 11 34 431
3 4,080 34 12 12 61 64 311 0.3 0.2 — 4.2 33 64 2 245
8 11,060 68 62 50 73 77 62 0.1 0.1 4.1 7.5 100 13 5 396
3 — 81 — — 67 71 — — — — — — — 0 —
3 4,135 45 18 13 55 56 674 1.9 2.7 23 41 47 — 13 421
3 2,100 44 18 12 58 61 405 0.9 1.2 0.2 1.6 38 51 28 400
3 1,640 30 21 20 57 60 371 0.6 1.0 0.2 0.8 13 80 15 306
6 6,390 66 61 57 71 80 42 0.9 1.1 0.0 0.1 71 21 3 961
3 3,240 54 18 12 51 53 645 2.5 3.8 1.3 2.5 56 74 23 823
2 1,580 60 9 8 59 62 706 1.4 2.2 0.1 0.1 35 49 4 474
5 4,070 54 35 29 60 63 319 1.3 2.0 1.1 4.0 64 49 15 601
3 1,120 37 6 5 58 59 679 1.2 2.0 0.3 0.6 26 76 29 361
3 1,450 49 16 14 54 57 549 — — 0.0 0.1 61 89 16 629
3 720 50 20 19 60 62 725 0.8 1.4 0.1 0.3 10 89 3 923
3 2,360 40 16 15 54 54 587 1.0 1.5 0.1 0.3 26 84 8 269
3 3,710 60 11 10 62 65 602 0.5 0.6 0.3 0.7 22 33 1 926
3 950 22 14 12 61 62 553 0.4 0.5 0.2 0.5 14 81 18 124
3 5,800 48 15 10 53 53 814 2.5 3.7 17.5 26.1 56 86 14 549
4 2,390 45 23 21 65 68 315 0.4 0.6 0.9 2.3 56 51 25 455
3 1,560 40 17 16 50 52 1,360 1.0 1.6 0.1 0.3 14 80 11 415
3 1,320 38 20 17 59 61 368 1.9 2.9 0.2 0.6 31 73 25 283
3 2,019 26 40 37 60 64 434 — — 11 22 22 — 19 575
2 730 12 32 30 58 61 712 0.8 1.3 0.1 0.1 7 97 7 925
3 1,430 28 19 14 62 65 335 — — 0.0 0.0 69 47 10 1,240
4 — 77 19 18 60 64 229 1.3 1.8 0.1 0.2 53 34 1 44,980
3 — 23 8 7 62 66 501 0.4 0.8 0.2 0.2 36 80 5 776
3 1,620 20 37 36 62 66 353 — — 0.8 2.9 27 93 18 673
3 3,060 26 66 63 60 65 510 4.8 7.0 1.5 3.6 23 79 12 783
3 1,400 35 40 33 64 67 353 0.4 0.3 0.3 0.8 15 79 5 676
4 1,140 16 59 58 62 64 634 7.1 11.1 0.2 0.3 10 79 17 453
9 19,290 41 76 39 71 78 53 1.3 0.5 0.5 1.0 100 3 5 1,685
3 — 47 — — 75 78 — — — — — — — 0 2,665
3 1,170 32 12 11 52 56 489 8.7 12.3 0.3 1.1 20 88 17 481
10 — 95 67 64 77 84 — — — 0.4 1.2 — — 76 2,381
3 1,720 29 53 48 62 66 290 2.3 3.5 0.1 0.2 18 87 9 1,006
8 25,760 54 — — 70 79 — — — 0.0 0.2 100 1 42 117,072
3 — 40 15 1 54 57 732 0.5 0.5 0.0 0.2 33 94 1 1,007
3 1,630 19 4 1 55 57 789 2.0 2.9 — 0.4 5 — 21 —
3 2,620 30 38 32 64 66 398 3.7 5.6 0.6 2.9 15 88 32 402
3 1,780 20 34 30 62 64 343 5.9 8.3 0.2 1.3 18 90 16 530
3 3,700 40 49 45 51 56 224 10.9 15.0 0.7 1.0 22 88 38 431
© 2016 Population Reference Bureau See notes on page 20 2016 WORLD POPULATION DATA SHEET 18
3 3,660 35 34 29 63 67 385 0.1 0.1 3.9 6.9 48 1 1 2,200
5 6,326 35 54 46 67 70 171 — — 398 918 80 — 6 744
5 10,898 40 54 50 68 75 33 0.3 0.1 118 122 100 — 5 184
7 24,260 53 51 50 68 77 12 0.3 0.1 73.6 71.7 100 1 3 61
4 3,300 36 42 40 67 74 76 0.3 0.1 3.1 2.7 100 22 7 477
3 3,320 26 28 26 66 73 32 0.4 0.2 2.0 1.0 100 58 22 1,005
4 15,760 50 48 46 62 70 42 — — 9.0 18.2 100 — 3 280
5 6,110 36 65 59 71 76 36 0.2 0.1 30.4 28.2 100 2 3 724
5 6,155 35 54 46 67 70 176 — — 280 796 78 — 7 840
2 1,990 27 22 20 59 62 396 0.1 0.1 0.4 5.8 43 11 0 429
6 3,550 34 62 54 71 73 176 0.1 0.1 4.8 18.8 60 38 5 2,122
5 7,610 39 66 65 69 70 148 — — 0.1 0.2 76 90 47 769
6 6,020 33 54 47 67 70 174 — — 190.6 554.9 79 39 5 846
5 17,400 72 77 57 74 77 25 0.2 0.1 62.4 168.3 100 1 7 534
5 11,310 46 35 27 76 78 68 — — 0.1 0.3 100 3 1 10,616
6 2,500 20 50 47 66 69 258 0.3 0.2 0.4 1.8 76 85 23 1,345
4 5,350 39 35 26 66 67 178 0.1 0.1 19.9 41.8 94 45 11 668
8 11,480 18 68 52 72 78 30 0.1 0.1 1.4 4.4 89 61 23 1,628
6 11,298 48 62 54 68 73 110 0.6 0.4 142 368 90 — 14 907
4 — 77 — — 77 81 23 — — 1.4 2.1 76 0 44 8,472
4 3,290 21 56 39 61 66 161 0.6 0.7 0.4 1.5 31 73 26 381
5 10,680 54 61 60 69 73 126 0.6 0.4 55.2 130.7 96 37 15 1,104
4 5,380 39 50 42 65 68 197 — — 0.1 0.6 70 87 17 475
6 26,140 75 49 32 72 77 40 0.7 0.1 20.5 64.5 100 7 18 3,228
5 — 34 46 46 64 68 178 1.0 0.5 1.3 3.4 52 79 7 487
5 8,900 44 55 38 65 72 114 0.1 0.1 13.3 26.8 88 29 11 1,835
12 81,190 100 62 55 80 85 10 — — 13.7 13.8 100 1 6 982,641
11 15,210 50 79 77 72 79 20 1.3 1.0 29.9 82.7 100 23 19 389
6 3,820 33 22 21 67 70 215 — — — 0.1 42 43 9 817
7 5,690 34 76 57 71 76 54 0.7 0.3 5.9 41.6 99 36 7 1,446
12 17,048 60 82 81 75 79 27 — — 1,235 3,405 99 — 17 1,396
10 14,160 56 85 84 75 78 27 — — 735.2 2,795.1 100 18 17 1,296
16 57,650 100 75 72 81 87 — — — 9.0 12.3 100 1 42 237,245
9 120,890 100 — — 80 86 — — — 0.3 0.6 91 0 0 —
27 38,870 94 54 44 80 87 5 — — 306.5 339.1 100 4 19 2,958
10 — 61 71 65 66 74 82 — — 63.5 13.7 30 16 3 1,069
14 34,700 82 80 70 79 86 11 — — 77.5 161.6 100 2 8 3,396
4 11,070 67 55 48 65 75 44 0.1 0.1 3.0 11.3 90 3 17 546
13 — 77 71 — 77 83 — — — 39.7 71.3 — — — 3,949
17 32,614 74 71 61 75 81 13 — — 1,884 1,560 100 — 14 266
19 37,646 75 72 65 78 83 8 — — 1,088 930 100 — 25 467
17 42,265 81 81 78 79 83 8 — — 228 197 100 — 20 525
16 — 32 — — 80 85 — — — — — 100 — — 3,944
19 47,810 88 — — 79 82 6 — — 14.8 10.4 100 28 18 238
19 27,510 69 63 58 72 82 9 — — 6.5 5.4 100 25 21 208
20 40,840 84 77 75 78 85 3 — — 12.9 12.6 100 39 15 247
14 46,120 94 — — 81 84 3 — — 0.5 0.5 100 78 17 276
13 46,410 63 65 61 79 83 8 — — 8.5 9.5 100 7 14 419
19 24,220 68 68 56 69 80 18 0.9 0.4 3.9 1.9 100 40 18 163
19 26,660 67 63 50 69 80 10 — — 6.0 3.4 100 24 17 125
16 64,590 81 88 82 80 84 5 — — 8.7 16.3 100 58 29 650
20 47,390 86 75 65 80 84 4 — — 13.9 12.1 100 50 15 381
17 40,550 83 84 84 79 83 9 — — 151.7 124.8 100 4 28 1,047
19 46,052 79 71 68 79 84 7 — — 448 400 100 — 28 571
18 47,510 66 70 68 79 84 4 — — 15.5 17.0 100 34 28 647
18 44,100 98 70 69 79 84 7 — — 30.5 25.5 100 7 23 1,384
18 40,470 80 76 74 79 85 8 — — 99.8 90.9 100 13 25 353
21 48,260 75 66 62 78 83 6 — — 243.2 206.5 100 12 37 696
16 — 14 — — 81 84 — — — — 0.0 100 — 44 1,454
14 70,750 90 — — 80 85 10 — — 2.9 2.8 100 4 35 933
24 — 100 — — — — — — — — — 100 — 53 226
18 48,400 90 69 67 80 83 7 — — 44.2 46.4 100 5 12 1,639
18 61,930 84 82 78 81 85 5 — — 11.7 11.0 100 23 10 2,078
Yemen 27.5 33 7 -1 36.3 47.1 43 4.2 40 3 3,660 35 34 29 63 67
SOUTH CENTRAL ASIA 1,929 23 7 -0 2,254 2,563 43 2.5 30 5 6,326 35 54 46 67 70
CENTRAL ASIA 70 24 6 -1 82 96 32 2.7 29 5 10,898 40 54 50 68 75
Kazakhstan 17.8 23 8 -1 20.5 24.7 9 2.6 25 7 24,260 53 51 50 68 77
Kyrgyzstan 6.1 28 6 -1 8.2 11.6 20 3.8 33 4 3,300 36 42 40 67 74
Tajikistan 8.6 31 6 -3 11.1 14.2 38 3.6 35 3 3,320 26 28 26 66 73
Turkmenistan 5.4 21 8 -1 6.2 6.6 45 2.2 28 4 15,760 50 48 46 62 70
Uzbekistan 31.9 23 5 -1 36.2 39.0 43 2.5 29 5 6,110 36 65 59 71 76
SOUTH ASIA 1,859 23 7 -0 2,172 2,467 43 2.5 30 5 6,155 35 54 46 67 70
Afghanistan 33.4 37 8 1 45.5 62.4 68 5.3 44 2 1,990 27 22 20 59 62
Bangladesh 162.9 20 5 -2 186.5 202.2 38 2.3 33 6 3,550 34 62 54 71 73
Bhutan 0.8 19 6 2 0.9 1.0 44 2.1 31 5 7,610 39 66 65 69 70
India 1,328.9 22 7 0 1,530.0 1,708.0 40 2.3 29 6 6,020 33 54 47 67 70
Iran 79.5 19 5 -1 87.9 91.6 14 1.8 24 5 17,400 72 77 57 74 77
Maldives 0.4 18 3 1 0.5 0.6 8 2.5 27 5 11,310 46 35 27 76 78
Nepal 28.4 22 7 -1 33.3 36.4 33 2.3 31 6 2,500 20 50 47 66 69
Pakistan 203.4 30 7 -1 265.6 344.0 67 3.7 36 4 5,350 39 35 26 66 67
Sri Lanka 21.2 16 6 -4 21.9 21.2 8 2.1 25 8 11,480 18 68 52 72 78
SOUTHEAST ASIA 633 19 7 -0 730 824 27 2.4 27 6 11,298 48 62 54 68 73
Brunei 0.4 16 3 2 0.5 0.5 8 1.9 23 4 — 77 — — 77 81
Cambodia 15.8 24 6 -2 19.0 22.5 26 2.6 32 4 3,290 21 56 39 61 66
Indonesia 259.4 20 7 -1 305.7 359.8 30 2.5 28 5 10,680 54 61 60 69 73
Laos 7.1 26 7 -3 8.7 10.4 55 3.0 35 4 5,380 39 50 42 65 68
Malaysia 30.8 17 5 2 36.1 40.7 6 2.0 25 6 26,140 75 49 32 72 77
Myanmar 52.4 19 8 -1 58.1 61.3 61 2.3 28 5 — 34 46 46 64 68
Philippines 102.6 23 7 -1 124.0 148.7 22 2.8 32 5 8,900 44 55 38 65 72
Singapore 5.6 8 4 8 6.3 6.6 1.7 1.2 15 12 81,190 100 62 55 80 85
Thailand 65.3 12 8 -1 66.8 63.3 10 1.6 18 11 15,210 50 79 77 72 79
Timor-Leste 1.3 37 7 -9 1.6 2.3 45 5.7 42 6 3,820 33 22 21 67 70
Vietnam 92.7 16 7 1 103.2 108.2 15 2.1 24 7 5,690 34 76 57 71 76
EAST ASIA 1,614 12 7 -0 1,643 1,554 10 1.6 17 12 17,048 60 82 81 75 79
China 1,378.0 12 7 -0 1,411.2 1,343.9 11 1.6 17 10 14,160 56 85 84 75 78
China, Hong Kong SARf 7.4 8 6 6 8.0 8.2 1.4 1.2 11 16 57,650 100 75 72 81 87
China, Macao SARf 0.7 11 3 9 0.7 0.8 2 1.1 12 9 120,890 100 — — 80 86
Japan 125.3 8 10 0 116.7 100.6 1.9 1.5 13 27 38,870 94 54 44 80 87
Korea, North 25.1 15 9 -0 26.7 27.0 25 2.0 21 10 — 61 71 65 66 74
Korea, South 50.8 9 5 0 52.2 48.1 3.0 1.2 14 14 34,700 82 80 70 79 86
Mongolia 3.1 27 6 0 3.8 4.6 15 3.1 27 4 11,070 67 55 48 65 75
Taiwan 23.5 9 7 0 23.3 20.5 4.0 1.2 14 13 — 77 71 — 77 83
EUROPE 740 11 11 2 744 728 5 1.6 16 17 32,614 74 71 61 75 81
EUROPEAN UNION 506 10 10 3 518 515 4 1.6 16 19 37,646 75 72 65 78 83
NORTHERN EUROPE 103 12 9 3 112 120 4 1.8 18 17 42,265 81 81 78 79 83
Channel Islands 0.2 10 8 4 0.2 0.2 2.9 1.6 15 16 — 32 — — 80 85
Denmark 5.7 10 9 9 6.2 6.3 3.5 1.7 17 19 47,810 88 — — 79 82
Estonia 1.3 11 12 2 1.3 1.2 2.4 1.6 16 19 27,510 69 63 58 72 82
Finland 5.5 10 10 2 5.8 5.9 1.7 1.6 16 20 40,840 84 77 75 78 85
Iceland 0.3 12 7 3 0.4 0.4 2.0 1.8 20 14 46,120 94 — — 81 84
Ireland 4.7 14 6 -3 5.1 5.7 3.1 1.9 22 13 46,410 63 65 61 79 83
Latvia 2.0 11 14 -4 1.6 1.5 4.2 1.6 15 19 24,220 68 68 56 69 80
Lithuania 2.9 11 14 -8 2.7 2.4 4.1 1.6 15 19 26,660 67 63 50 69 80
Norway 5.2 11 8 6 5.9 6.6 2.4 1.7 18 16 64,590 81 88 82 80 84
Sweden 9.9 12 9 8 11.5 12.6 2.5 1.8 17 20 47,390 86 75 65 80 84
United Kingdom 65.6 12 9 3 71.0 77.0 3.9 1.8 18 17 40,550 83 84 84 79 83
WESTERN EUROPE 193 10 10 8 201 205 3 1.7 16 19 46,052 79 71 68 79 84
Austria 8.8 10 10 13 9.2 9.7 3.0 1.5 14 18 47,510 66 70 68 79 84
Belgium 11.3 11 10 4 12.0 12.8 3.5 1.7 17 18 44,100 98 70 69 79 84
France 64.6 12 9 1 68.5 72.3 3.5 1.9 18 18 40,470 80 76 74 79 85
Germany 82.6 9 11 14 83.3 81.0 3.3 1.5 13 21 48,260 75 66 62 78 83
Liechtenstein 0.04 10 7 4 0.04 0.04 3.3 1.6 15 16 — 14 — — 81 84
Luxembourg 0.6 11 7 20 0.7 0.7 3.2 1.5 16 14 70,750 90 — — 80 85
Monaco 0.04 7 6 21 0.04 0.05 — 1.5 13 24 — 100 — — — —
Netherlands 17.0 10 9 3 17.8 18.1 3.6 1.7 17 18 48,400 90 69 67 80 83
Switzerland 8.4 10 8 9 9.5 10.3 3.9 1.5 15 18 61,930 84 82 78 81 85
POPULATION, HEALTH, AND ENVIRONMENT DATA AND ESTIMATES FOR THE COUNTRIES AND REGIONS OF THE WORLD
ercent
pulation
GNI
per Capita
($US)
Percent
Urban
Percent of Married
Women 15-49 Using
Contraceptionc
Life Expectancy
at Birth (years)
Maternal
Deaths per
100,000 Births
Percent Ages 15-49
With HIV/AIDS
Carbon Emissions
(million metric tons)
Percent of
Population
With Access to
Electricity
Percent of Total
Energy Consumption
From Renewable
Sourcesd
Percent of
Terrestrial Land
Under Protected
Area Status
Population
per Square
Kilometer
of Arable Land
Ages
65+ 2015
All
Methods
Modern
Methods Males Females 2015
Males
2015
Females
2015 1992 2013 2012 2013 2014
8 15,415 54 62 56 70 74 216 — — 6,110 9,776 85 18 15 526
18 39,963 78 70 62 76 82 12 — — 3,730 3,556 100 — 14 238
7 10,214 49 61 55 68 72 239 — — 2,169 5,678 81 — 16 697
5 8,936 47 54 46 67 70 267 — — 1,424 2,870 75 — 15 614
4 2,424 32 36 32 61 64 437 1.6 2.2 20 76 34 — 13 550
4 4,802 41 35 30 59 62 490 3.2 4.7 189 346 45 — 14 514
3 3,606 39 31 26 57 59 557 4.0 6.0 124 209 35 — 16 502
5 9,798 51 52 46 69 73 126 0.1 0.1 66 136 88 — 6 571
6 14,280 71 57 48 73 78 140 0.1 0.1 22.1 36.6 100 0 8 545
4 10,690 43 58 57 70 73 33 0.1 0.1 22.2 58.1 100 5 11 3,415
5 15,140 79 42 20 69 75 9 — — 10.2 13.9 100 2 0 368
6 7,680 60 67 57 73 75 121 0.1 0.1 7.1 16.0 100 11 34 431
3 4,080 34 12 12 61 64 311 0.3 0.2 — 4.2 33 64 2 245
8 11,060 68 62 50 73 77 62 0.1 0.1 4.1 7.5 100 13 5 396
3 — 81 — — 67 71 — — — — — — — 0 —
3 4,135 45 18 13 55 56 674 1.9 2.7 23 41 47 — 13 421
3 2,100 44 18 12 58 61 405 0.9 1.2 0.2 1.6 38 51 28 400
3 1,640 30 21 20 57 60 371 0.6 1.0 0.2 0.8 13 80 15 306
6 6,390 66 61 57 71 80 42 0.9 1.1 0.0 0.1 71 21 3 961
3 3,240 54 18 12 51 53 645 2.5 3.8 1.3 2.5 56 74 23 823
2 1,580 60 9 8 59 62 706 1.4 2.2 0.1 0.1 35 49 4 474
5 4,070 54 35 29 60 63 319 1.3 2.0 1.1 4.0 64 49 15 601
3 1,120 37 6 5 58 59 679 1.2 2.0 0.3 0.6 26 76 29 361
3 1,450 49 16 14 54 57 549 — — 0.0 0.1 61 89 16 629
3 720 50 20 19 60 62 725 0.8 1.4 0.1 0.3 10 89 3 923
3 2,360 40 16 15 54 54 587 1.0 1.5 0.1 0.3 26 84 8 269
3 3,710 60 11 10 62 65 602 0.5 0.6 0.3 0.7 22 33 1 926
3 950 22 14 12 61 62 553 0.4 0.5 0.2 0.5 14 81 18 124
3 5,800 48 15 10 53 53 814 2.5 3.7 17.5 26.1 56 86 14 549
4 2,390 45 23 21 65 68 315 0.4 0.6 0.9 2.3 56 51 25 455
3 1,560 40 17 16 50 52 1,360 1.0 1.6 0.1 0.3 14 80 11 415
3 1,320 38 20 17 59 61 368 1.9 2.9 0.2 0.6 31 73 25 283
3 2,019 26 40 37 60 64 434 — — 11 22 22 — 19 575
2 730 12 32 30 58 61 712 0.8 1.3 0.1 0.1 7 97 7 925
3 1,430 28 19 14 62 65 335 — — 0.0 0.0 69 47 10 1,240
4 — 77 19 18 60 64 229 1.3 1.8 0.1 0.2 53 34 1 44,980
3 — 23 8 7 62 66 501 0.4 0.8 0.2 0.2 36 80 5 776
3 1,620 20 37 36 62 66 353 — — 0.8 2.9 27 93 18 673
3 3,060 26 66 63 60 65 510 4.8 7.0 1.5 3.6 23 79 12 783
3 1,400 35 40 33 64 67 353 0.4 0.3 0.3 0.8 15 79 5 676
4 1,140 16 59 58 62 64 634 7.1 11.1 0.2 0.3 10 79 17 453
9 19,290 41 76 39 71 78 53 1.3 0.5 0.5 1.0 100 3 5 1,685
3 — 47 — — 75 78 — — — — — — — 0 2,665
3 1,170 32 12 11 52 56 489 8.7 12.3 0.3 1.1 20 88 17 481
10 — 95 67 64 77 84 — — — 0.4 1.2 — — 76 2,381
3 1,720 29 53 48 62 66 290 2.3 3.5 0.1 0.2 18 87 9 1,006
8 25,760 54 — — 70 79 — — — 0.0 0.2 100 1 42 117,072
3 — 40 15 1 54 57 732 0.5 0.5 0.0 0.2 33 94 1 1,007
3 1,630 19 4 1 55 57 789 2.0 2.9 — 0.4 5 — 21 —
3 2,620 30 38 32 64 66 398 3.7 5.6 0.6 2.9 15 88 32 402
3 1,780 20 34 30 62 64 343 5.9 8.3 0.2 1.3 18 90 16 530
3 3,700 40 49 45 51 56 224 10.9 15.0 0.7 1.0 22 88 38 431
Datos de La población mundial 2016. (Population Reference Bureau) 2016 world-population-data-sheet eng

More Related Content

What's hot

Psipa final paper -sustainable cities
Psipa  final paper -sustainable citiesPsipa  final paper -sustainable cities
Psipa final paper -sustainable citiesJIT KUMAR GUPTA
 
Options for making affordable housing for all a reality in urban India (1)
Options for making affordable housing for all a reality in urban India (1)Options for making affordable housing for all a reality in urban India (1)
Options for making affordable housing for all a reality in urban India (1)JIT KUMAR GUPTA
 
Population, urbanization and environment
Population, urbanization and environmentPopulation, urbanization and environment
Population, urbanization and environmentDaniel Gabadón-Estevan
 
Impacts of Urbanization
Impacts of UrbanizationImpacts of Urbanization
Impacts of UrbanizationRajan Mithra
 
Urban growth and urbanization
Urban growth and urbanizationUrban growth and urbanization
Urban growth and urbanizationMamathaNagaraju2
 
International Refereed Journal of Engineering and Science (IRJES)
International Refereed Journal of Engineering and Science (IRJES)International Refereed Journal of Engineering and Science (IRJES)
International Refereed Journal of Engineering and Science (IRJES)irjes
 
Urbanisation (problems and suggested solutions) In Zimbabwe
Urbanisation (problems and suggested solutions) In ZimbabweUrbanisation (problems and suggested solutions) In Zimbabwe
Urbanisation (problems and suggested solutions) In ZimbabweDumisani Nhliziyo
 
Urbanization in India
Urbanization in IndiaUrbanization in India
Urbanization in IndiaRavi Kn
 
Strategy for Promoting Sustainable Cities in India
Strategy for Promoting Sustainable Cities in IndiaStrategy for Promoting Sustainable Cities in India
Strategy for Promoting Sustainable Cities in IndiaJIT KUMAR GUPTA
 
Southern Innovator Magazine Issue 4: Cities and Urbanization
Southern Innovator Magazine Issue 4: Cities and UrbanizationSouthern Innovator Magazine Issue 4: Cities and Urbanization
Southern Innovator Magazine Issue 4: Cities and UrbanizationDavid South Consulting
 
What a waste2012 final
What a waste2012 finalWhat a waste2012 final
What a waste2012 finalSilvia Mares
 
What a Waste - Global Review of Solid Waste Management
What a Waste - Global Review of Solid Waste Management What a Waste - Global Review of Solid Waste Management
What a Waste - Global Review of Solid Waste Management Frank Deluca
 
Housing - habitat agenda , global housing challenges
Housing  - habitat agenda , global housing challengesHousing  - habitat agenda , global housing challenges
Housing - habitat agenda , global housing challengesJOSIN MATHEW
 
Berlin Urban Symposium
Berlin Urban SymposiumBerlin Urban Symposium
Berlin Urban Symposiumequitywatch
 
Lesson One
Lesson OneLesson One
Lesson Oneljordan
 
Population & Urbanization
Population & UrbanizationPopulation & Urbanization
Population & UrbanizationJ_Wheat
 
Impact of urbanization
Impact of urbanizationImpact of urbanization
Impact of urbanizationrasikapatil26
 
Expanding nodular development (end) sustainable urbanisation
Expanding nodular development (end) sustainable urbanisationExpanding nodular development (end) sustainable urbanisation
Expanding nodular development (end) sustainable urbanisationNeilBaulch
 

What's hot (20)

Psipa final paper -sustainable cities
Psipa  final paper -sustainable citiesPsipa  final paper -sustainable cities
Psipa final paper -sustainable cities
 
Options for making affordable housing for all a reality in urban India (1)
Options for making affordable housing for all a reality in urban India (1)Options for making affordable housing for all a reality in urban India (1)
Options for making affordable housing for all a reality in urban India (1)
 
Population, urbanization and environment
Population, urbanization and environmentPopulation, urbanization and environment
Population, urbanization and environment
 
Urbanization in india
Urbanization in indiaUrbanization in india
Urbanization in india
 
Impacts of Urbanization
Impacts of UrbanizationImpacts of Urbanization
Impacts of Urbanization
 
Urban growth and urbanization
Urban growth and urbanizationUrban growth and urbanization
Urban growth and urbanization
 
International Refereed Journal of Engineering and Science (IRJES)
International Refereed Journal of Engineering and Science (IRJES)International Refereed Journal of Engineering and Science (IRJES)
International Refereed Journal of Engineering and Science (IRJES)
 
Urbanisation (problems and suggested solutions) In Zimbabwe
Urbanisation (problems and suggested solutions) In ZimbabweUrbanisation (problems and suggested solutions) In Zimbabwe
Urbanisation (problems and suggested solutions) In Zimbabwe
 
Urbanization in India
Urbanization in IndiaUrbanization in India
Urbanization in India
 
Strategy for Promoting Sustainable Cities in India
Strategy for Promoting Sustainable Cities in IndiaStrategy for Promoting Sustainable Cities in India
Strategy for Promoting Sustainable Cities in India
 
Urban Hazards and Megacities
Urban Hazards and MegacitiesUrban Hazards and Megacities
Urban Hazards and Megacities
 
Southern Innovator Magazine Issue 4: Cities and Urbanization
Southern Innovator Magazine Issue 4: Cities and UrbanizationSouthern Innovator Magazine Issue 4: Cities and Urbanization
Southern Innovator Magazine Issue 4: Cities and Urbanization
 
What a waste2012 final
What a waste2012 finalWhat a waste2012 final
What a waste2012 final
 
What a Waste - Global Review of Solid Waste Management
What a Waste - Global Review of Solid Waste Management What a Waste - Global Review of Solid Waste Management
What a Waste - Global Review of Solid Waste Management
 
Housing - habitat agenda , global housing challenges
Housing  - habitat agenda , global housing challengesHousing  - habitat agenda , global housing challenges
Housing - habitat agenda , global housing challenges
 
Berlin Urban Symposium
Berlin Urban SymposiumBerlin Urban Symposium
Berlin Urban Symposium
 
Lesson One
Lesson OneLesson One
Lesson One
 
Population & Urbanization
Population & UrbanizationPopulation & Urbanization
Population & Urbanization
 
Impact of urbanization
Impact of urbanizationImpact of urbanization
Impact of urbanization
 
Expanding nodular development (end) sustainable urbanisation
Expanding nodular development (end) sustainable urbanisationExpanding nodular development (end) sustainable urbanisation
Expanding nodular development (end) sustainable urbanisation
 

Viewers also liked

Estrategia de la urbanización sostenible. (Undp urban strategy) . PNUD
 Estrategia de la urbanización sostenible. (Undp urban strategy) . PNUD Estrategia de la urbanización sostenible. (Undp urban strategy) . PNUD
Estrategia de la urbanización sostenible. (Undp urban strategy) . PNUDJuan Martín Martín
 
Areas urbanas en España 2016. Listado
Areas urbanas en España 2016. ListadoAreas urbanas en España 2016. Listado
Areas urbanas en España 2016. ListadoJuan Martín Martín
 
GeografíA De La PoblacióN
GeografíA De La PoblacióNGeografíA De La PoblacióN
GeografíA De La PoblacióNSandra Díaz
 
05 geografía 6° 2012 2013
05 geografía 6° 2012 201305 geografía 6° 2012 2013
05 geografía 6° 2012 2013oscar Lascuray
 
Paisajes agrarios del mundo
Paisajes agrarios del mundoPaisajes agrarios del mundo
Paisajes agrarios del mundogsanfer
 
Proyecto Nosotros Proponemos. Ciudad Real. 5ª Sesión: Técnicos Ayuntamiento d...
Proyecto Nosotros Proponemos. Ciudad Real. 5ª Sesión: Técnicos Ayuntamiento d...Proyecto Nosotros Proponemos. Ciudad Real. 5ª Sesión: Técnicos Ayuntamiento d...
Proyecto Nosotros Proponemos. Ciudad Real. 5ª Sesión: Técnicos Ayuntamiento d...Juan Martín Martín
 
El uso del dron (drone) como recurso didáctico en geografía: experiencia en e...
El uso del dron (drone) como recurso didáctico en geografía: experiencia en e...El uso del dron (drone) como recurso didáctico en geografía: experiencia en e...
El uso del dron (drone) como recurso didáctico en geografía: experiencia en e...Juan Martín Martín
 
Proyecto Nosotros Proponemos. Ciudad Real. 3ª Sesión: Ayuntamiento de Ciudad ...
Proyecto Nosotros Proponemos. Ciudad Real. 3ª Sesión: Ayuntamiento de Ciudad ...Proyecto Nosotros Proponemos. Ciudad Real. 3ª Sesión: Ayuntamiento de Ciudad ...
Proyecto Nosotros Proponemos. Ciudad Real. 3ª Sesión: Ayuntamiento de Ciudad ...Juan Martín Martín
 
Proyecto Nosotros Proponemos. Ciudad Real. 2ª Sesión: Presentación del Proyecto
Proyecto Nosotros Proponemos. Ciudad Real. 2ª Sesión: Presentación del ProyectoProyecto Nosotros Proponemos. Ciudad Real. 2ª Sesión: Presentación del Proyecto
Proyecto Nosotros Proponemos. Ciudad Real. 2ª Sesión: Presentación del ProyectoJuan Martín Martín
 
Proyecto Nosotros Proponemos. Ciudad Real. 4ª Sesión: Técnicos Ayuntamiento d...
Proyecto Nosotros Proponemos. Ciudad Real. 4ª Sesión: Técnicos Ayuntamiento d...Proyecto Nosotros Proponemos. Ciudad Real. 4ª Sesión: Técnicos Ayuntamiento d...
Proyecto Nosotros Proponemos. Ciudad Real. 4ª Sesión: Técnicos Ayuntamiento d...Juan Martín Martín
 
Proyecto Nosotros Proponemos. Ciudad Real. 1ª Sesión: Presentación del Proye...
Proyecto Nosotros Proponemos. Ciudad Real. 1ª  Sesión: Presentación del Proye...Proyecto Nosotros Proponemos. Ciudad Real. 1ª  Sesión: Presentación del Proye...
Proyecto Nosotros Proponemos. Ciudad Real. 1ª Sesión: Presentación del Proye...Juan Martín Martín
 
El uso del dron (drone) como recurso didáctico en geografía: experiencia en e...
El uso del dron (drone) como recurso didáctico en geografía: experiencia en e...El uso del dron (drone) como recurso didáctico en geografía: experiencia en e...
El uso del dron (drone) como recurso didáctico en geografía: experiencia en e...Juan Martín Martín
 
Climogramas de las Islas Baleares.
Climogramas de las Islas Baleares. Climogramas de las Islas Baleares.
Climogramas de las Islas Baleares. Juan Martín Martín
 

Viewers also liked (18)

Estrategia de la urbanización sostenible. (Undp urban strategy) . PNUD
 Estrategia de la urbanización sostenible. (Undp urban strategy) . PNUD Estrategia de la urbanización sostenible. (Undp urban strategy) . PNUD
Estrategia de la urbanización sostenible. (Undp urban strategy) . PNUD
 
Areas urbanas en España 2016. Listado
Areas urbanas en España 2016. ListadoAreas urbanas en España 2016. Listado
Areas urbanas en España 2016. Listado
 
GeografíA De La PoblacióN
GeografíA De La PoblacióNGeografíA De La PoblacióN
GeografíA De La PoblacióN
 
05 geografía 6° 2012 2013
05 geografía 6° 2012 201305 geografía 6° 2012 2013
05 geografía 6° 2012 2013
 
Geografía de la població
Geografía de la poblacióGeografía de la població
Geografía de la població
 
Geografía de la población
Geografía de la poblaciónGeografía de la población
Geografía de la población
 
Paisajes agrarios del mundo
Paisajes agrarios del mundoPaisajes agrarios del mundo
Paisajes agrarios del mundo
 
España en Cifras 2017
España en Cifras 2017España en Cifras 2017
España en Cifras 2017
 
Climogramas de Cantabria.
Climogramas de Cantabria. Climogramas de Cantabria.
Climogramas de Cantabria.
 
El Clima de España. Tema 2
El Clima de España. Tema 2 El Clima de España. Tema 2
El Clima de España. Tema 2
 
Proyecto Nosotros Proponemos. Ciudad Real. 5ª Sesión: Técnicos Ayuntamiento d...
Proyecto Nosotros Proponemos. Ciudad Real. 5ª Sesión: Técnicos Ayuntamiento d...Proyecto Nosotros Proponemos. Ciudad Real. 5ª Sesión: Técnicos Ayuntamiento d...
Proyecto Nosotros Proponemos. Ciudad Real. 5ª Sesión: Técnicos Ayuntamiento d...
 
El uso del dron (drone) como recurso didáctico en geografía: experiencia en e...
El uso del dron (drone) como recurso didáctico en geografía: experiencia en e...El uso del dron (drone) como recurso didáctico en geografía: experiencia en e...
El uso del dron (drone) como recurso didáctico en geografía: experiencia en e...
 
Proyecto Nosotros Proponemos. Ciudad Real. 3ª Sesión: Ayuntamiento de Ciudad ...
Proyecto Nosotros Proponemos. Ciudad Real. 3ª Sesión: Ayuntamiento de Ciudad ...Proyecto Nosotros Proponemos. Ciudad Real. 3ª Sesión: Ayuntamiento de Ciudad ...
Proyecto Nosotros Proponemos. Ciudad Real. 3ª Sesión: Ayuntamiento de Ciudad ...
 
Proyecto Nosotros Proponemos. Ciudad Real. 2ª Sesión: Presentación del Proyecto
Proyecto Nosotros Proponemos. Ciudad Real. 2ª Sesión: Presentación del ProyectoProyecto Nosotros Proponemos. Ciudad Real. 2ª Sesión: Presentación del Proyecto
Proyecto Nosotros Proponemos. Ciudad Real. 2ª Sesión: Presentación del Proyecto
 
Proyecto Nosotros Proponemos. Ciudad Real. 4ª Sesión: Técnicos Ayuntamiento d...
Proyecto Nosotros Proponemos. Ciudad Real. 4ª Sesión: Técnicos Ayuntamiento d...Proyecto Nosotros Proponemos. Ciudad Real. 4ª Sesión: Técnicos Ayuntamiento d...
Proyecto Nosotros Proponemos. Ciudad Real. 4ª Sesión: Técnicos Ayuntamiento d...
 
Proyecto Nosotros Proponemos. Ciudad Real. 1ª Sesión: Presentación del Proye...
Proyecto Nosotros Proponemos. Ciudad Real. 1ª  Sesión: Presentación del Proye...Proyecto Nosotros Proponemos. Ciudad Real. 1ª  Sesión: Presentación del Proye...
Proyecto Nosotros Proponemos. Ciudad Real. 1ª Sesión: Presentación del Proye...
 
El uso del dron (drone) como recurso didáctico en geografía: experiencia en e...
El uso del dron (drone) como recurso didáctico en geografía: experiencia en e...El uso del dron (drone) como recurso didáctico en geografía: experiencia en e...
El uso del dron (drone) como recurso didáctico en geografía: experiencia en e...
 
Climogramas de las Islas Baleares.
Climogramas de las Islas Baleares. Climogramas de las Islas Baleares.
Climogramas de las Islas Baleares.
 

Similar to Datos de La población mundial 2016. (Population Reference Bureau) 2016 world-population-data-sheet eng

Better Growth, Better Climate: The New Climate Economy Presentation
Better Growth, Better Climate: The New Climate Economy PresentationBetter Growth, Better Climate: The New Climate Economy Presentation
Better Growth, Better Climate: The New Climate Economy PresentationNew Climate Economy
 
Ecological footprint atlas_2010
Ecological footprint atlas_2010Ecological footprint atlas_2010
Ecological footprint atlas_2010walled ashwah
 
The Food-Energy-Water Nexus: Useful Concept at the Science-Policy Interface?
The Food-Energy-Water Nexus: Useful Concept at the Science-Policy Interface?The Food-Energy-Water Nexus: Useful Concept at the Science-Policy Interface?
The Food-Energy-Water Nexus: Useful Concept at the Science-Policy Interface?Water, Land and Ecosystems (WLE)
 
The sustainable development goals report 2018
The sustainable development goals report 2018The sustainable development goals report 2018
The sustainable development goals report 2018Juanmanuelcalderonal
 
UNLIMITED_SustainabilityReset_2020.pdf
UNLIMITED_SustainabilityReset_2020.pdfUNLIMITED_SustainabilityReset_2020.pdf
UNLIMITED_SustainabilityReset_2020.pdflucimarcunha
 
General view of world population
General view of world populationGeneral view of world population
General view of world populationRiaz Ahamad
 
Lecture – People, Planet, Profit – A Revolution In Integrating Global And Loc...
Lecture – People, Planet, Profit – A Revolution In Integrating Global And Loc...Lecture – People, Planet, Profit – A Revolution In Integrating Global And Loc...
Lecture – People, Planet, Profit – A Revolution In Integrating Global And Loc...Ecological Sequestration Trust
 
Leveraging City-Basin Governance to Boost Water Security in African Municipal...
Leveraging City-Basin Governance to Boost Water Security in African Municipal...Leveraging City-Basin Governance to Boost Water Security in African Municipal...
Leveraging City-Basin Governance to Boost Water Security in African Municipal...Kayode Fayemi
 
LESSON 7b GLOBAL SUSTAINABLE DEVELOPMENT.pptx
LESSON 7b GLOBAL SUSTAINABLE DEVELOPMENT.pptxLESSON 7b GLOBAL SUSTAINABLE DEVELOPMENT.pptx
LESSON 7b GLOBAL SUSTAINABLE DEVELOPMENT.pptxAkiCreus2
 
White book on megatrends
White book on megatrendsWhite book on megatrends
White book on megatrendsNordea Bank
 
LURS Presentation - Green Buildings.pptx
LURS Presentation - Green Buildings.pptxLURS Presentation - Green Buildings.pptx
LURS Presentation - Green Buildings.pptxssuser3fb943
 
STEPS Annual Lecture 2017: Achim Steiner - Doomed to fail or bound to succeed...
STEPS Annual Lecture 2017: Achim Steiner - Doomed to fail or bound to succeed...STEPS Annual Lecture 2017: Achim Steiner - Doomed to fail or bound to succeed...
STEPS Annual Lecture 2017: Achim Steiner - Doomed to fail or bound to succeed...STEPS Centre
 
The impacts of Health Crisis (Covid-19) on achieving SDGs by Dr Datchanamoort...
The impacts of Health Crisis (Covid-19) on achieving SDGs by Dr Datchanamoort...The impacts of Health Crisis (Covid-19) on achieving SDGs by Dr Datchanamoort...
The impacts of Health Crisis (Covid-19) on achieving SDGs by Dr Datchanamoort...DatchanaMoorthy Ramu
 
Tourism and Climate Change: Issues, Trends and Solutions
Tourism and Climate Change: Issues, Trends and SolutionsTourism and Climate Change: Issues, Trends and Solutions
Tourism and Climate Change: Issues, Trends and SolutionsAnna Pollock
 
Research needs for the advancement of integrated crop-livestock-tree uses
Research needs for the advancement of integrated crop-livestock-tree usesResearch needs for the advancement of integrated crop-livestock-tree uses
Research needs for the advancement of integrated crop-livestock-tree usesWorld Agroforestry (ICRAF)
 

Similar to Datos de La población mundial 2016. (Population Reference Bureau) 2016 world-population-data-sheet eng (20)

Better Growth, Better Climate: The New Climate Economy Presentation
Better Growth, Better Climate: The New Climate Economy PresentationBetter Growth, Better Climate: The New Climate Economy Presentation
Better Growth, Better Climate: The New Climate Economy Presentation
 
Nearly 800 million people lack access to drinking water, sanitation
Nearly 800 million people lack access to drinking water, sanitation Nearly 800 million people lack access to drinking water, sanitation
Nearly 800 million people lack access to drinking water, sanitation
 
WATER : THE BIGGEST BUSINESS RISK FOR INDIA, INC.
WATER : THE BIGGEST BUSINESS RISK FOR INDIA, INC.WATER : THE BIGGEST BUSINESS RISK FOR INDIA, INC.
WATER : THE BIGGEST BUSINESS RISK FOR INDIA, INC.
 
Ecological footprint atlas_2010
Ecological footprint atlas_2010Ecological footprint atlas_2010
Ecological footprint atlas_2010
 
The Food-Energy-Water Nexus: Useful Concept at the Science-Policy Interface?
The Food-Energy-Water Nexus: Useful Concept at the Science-Policy Interface?The Food-Energy-Water Nexus: Useful Concept at the Science-Policy Interface?
The Food-Energy-Water Nexus: Useful Concept at the Science-Policy Interface?
 
SDGs Progress Report 2018
SDGs Progress Report 2018SDGs Progress Report 2018
SDGs Progress Report 2018
 
The sustainable development goals report 2018
The sustainable development goals report 2018The sustainable development goals report 2018
The sustainable development goals report 2018
 
UNLIMITED_SustainabilityReset_2020.pdf
UNLIMITED_SustainabilityReset_2020.pdfUNLIMITED_SustainabilityReset_2020.pdf
UNLIMITED_SustainabilityReset_2020.pdf
 
General view of world population
General view of world populationGeneral view of world population
General view of world population
 
Lecture – People, Planet, Profit – A Revolution In Integrating Global And Loc...
Lecture – People, Planet, Profit – A Revolution In Integrating Global And Loc...Lecture – People, Planet, Profit – A Revolution In Integrating Global And Loc...
Lecture – People, Planet, Profit – A Revolution In Integrating Global And Loc...
 
Mark Rosegrant, IFPRI
Mark Rosegrant, IFPRIMark Rosegrant, IFPRI
Mark Rosegrant, IFPRI
 
Transformative Solutions: Cities for People
Transformative Solutions: Cities for PeopleTransformative Solutions: Cities for People
Transformative Solutions: Cities for People
 
Leveraging City-Basin Governance to Boost Water Security in African Municipal...
Leveraging City-Basin Governance to Boost Water Security in African Municipal...Leveraging City-Basin Governance to Boost Water Security in African Municipal...
Leveraging City-Basin Governance to Boost Water Security in African Municipal...
 
LESSON 7b GLOBAL SUSTAINABLE DEVELOPMENT.pptx
LESSON 7b GLOBAL SUSTAINABLE DEVELOPMENT.pptxLESSON 7b GLOBAL SUSTAINABLE DEVELOPMENT.pptx
LESSON 7b GLOBAL SUSTAINABLE DEVELOPMENT.pptx
 
White book on megatrends
White book on megatrendsWhite book on megatrends
White book on megatrends
 
LURS Presentation - Green Buildings.pptx
LURS Presentation - Green Buildings.pptxLURS Presentation - Green Buildings.pptx
LURS Presentation - Green Buildings.pptx
 
STEPS Annual Lecture 2017: Achim Steiner - Doomed to fail or bound to succeed...
STEPS Annual Lecture 2017: Achim Steiner - Doomed to fail or bound to succeed...STEPS Annual Lecture 2017: Achim Steiner - Doomed to fail or bound to succeed...
STEPS Annual Lecture 2017: Achim Steiner - Doomed to fail or bound to succeed...
 
The impacts of Health Crisis (Covid-19) on achieving SDGs by Dr Datchanamoort...
The impacts of Health Crisis (Covid-19) on achieving SDGs by Dr Datchanamoort...The impacts of Health Crisis (Covid-19) on achieving SDGs by Dr Datchanamoort...
The impacts of Health Crisis (Covid-19) on achieving SDGs by Dr Datchanamoort...
 
Tourism and Climate Change: Issues, Trends and Solutions
Tourism and Climate Change: Issues, Trends and SolutionsTourism and Climate Change: Issues, Trends and Solutions
Tourism and Climate Change: Issues, Trends and Solutions
 
Research needs for the advancement of integrated crop-livestock-tree uses
Research needs for the advancement of integrated crop-livestock-tree usesResearch needs for the advancement of integrated crop-livestock-tree uses
Research needs for the advancement of integrated crop-livestock-tree uses
 

More from Juan Martín Martín

La fotogrametría en 3D con drones para su uso en el aula, de forma rápida y s...
La fotogrametría en 3D con drones para su uso en el aula, de forma rápida y s...La fotogrametría en 3D con drones para su uso en el aula, de forma rápida y s...
La fotogrametría en 3D con drones para su uso en el aula, de forma rápida y s...Juan Martín Martín
 
Cuaderno de campo de Almagro: Visita turística
Cuaderno de campo de Almagro: Visita turísticaCuaderno de campo de Almagro: Visita turística
Cuaderno de campo de Almagro: Visita turísticaJuan Martín Martín
 
Cuaderno de campo-Ciudad Real: Visita turística
Cuaderno de campo-Ciudad Real: Visita turísticaCuaderno de campo-Ciudad Real: Visita turística
Cuaderno de campo-Ciudad Real: Visita turísticaJuan Martín Martín
 
Nosotros Proponemos: "Turistas en ruta". Colegio José Mª de la Fuente. Ciudad...
Nosotros Proponemos: "Turistas en ruta". Colegio José Mª de la Fuente. Ciudad...Nosotros Proponemos: "Turistas en ruta". Colegio José Mª de la Fuente. Ciudad...
Nosotros Proponemos: "Turistas en ruta". Colegio José Mª de la Fuente. Ciudad...Juan Martín Martín
 
Nosotros Proponemos: "Cuidamos los gatos". Colegio José Mª de la Fuente.
Nosotros Proponemos: "Cuidamos los gatos". Colegio José Mª de la Fuente.Nosotros Proponemos: "Cuidamos los gatos". Colegio José Mª de la Fuente.
Nosotros Proponemos: "Cuidamos los gatos". Colegio José Mª de la Fuente.Juan Martín Martín
 
Nosotros proponemos "Nuestro movimiento, nuestra luz". Colegio San Francisco...
Nosotros proponemos "Nuestro movimiento, nuestra luz". Colegio  San Francisco...Nosotros proponemos "Nuestro movimiento, nuestra luz". Colegio  San Francisco...
Nosotros proponemos "Nuestro movimiento, nuestra luz". Colegio San Francisco...Juan Martín Martín
 
Nosotros proponemos "cultivando mentes". Colegio Tierno Galván de Puertollano
Nosotros proponemos  "cultivando mentes". Colegio Tierno Galván de PuertollanoNosotros proponemos  "cultivando mentes". Colegio Tierno Galván de Puertollano
Nosotros proponemos "cultivando mentes". Colegio Tierno Galván de PuertollanoJuan Martín Martín
 
Nosotros Proponemos "aceras sostenibles". Colegio San José de Ciudad Real
Nosotros Proponemos "aceras sostenibles". Colegio San José de Ciudad RealNosotros Proponemos "aceras sostenibles". Colegio San José de Ciudad Real
Nosotros Proponemos "aceras sostenibles". Colegio San José de Ciudad RealJuan Martín Martín
 
Nosotros Proponemos "juntos para lograr un puerto-evolución. IES Fray Andrés ...
Nosotros Proponemos "juntos para lograr un puerto-evolución. IES Fray Andrés ...Nosotros Proponemos "juntos para lograr un puerto-evolución. IES Fray Andrés ...
Nosotros Proponemos "juntos para lograr un puerto-evolución. IES Fray Andrés ...Juan Martín Martín
 
Nosotros Proponemos: "La huerta del San José" de Puertollano.
Nosotros Proponemos: "La huerta del San José" de Puertollano.Nosotros Proponemos: "La huerta del San José" de Puertollano.
Nosotros Proponemos: "La huerta del San José" de Puertollano.Juan Martín Martín
 
Nosotros Proponemos: Restauración teatro. Inmaculada ENPETROL de Puertollano
Nosotros Proponemos: Restauración teatro. Inmaculada ENPETROL de PuertollanoNosotros Proponemos: Restauración teatro. Inmaculada ENPETROL de Puertollano
Nosotros Proponemos: Restauración teatro. Inmaculada ENPETROL de PuertollanoJuan Martín Martín
 
Nosotros Proponemos: Proyecto Infantil Orgánico Verde. Colegio Inocente Martí...
Nosotros Proponemos: Proyecto Infantil Orgánico Verde. Colegio Inocente Martí...Nosotros Proponemos: Proyecto Infantil Orgánico Verde. Colegio Inocente Martí...
Nosotros Proponemos: Proyecto Infantil Orgánico Verde. Colegio Inocente Martí...Juan Martín Martín
 
Nosotros Proponemos: Turistas en ruta. Colegio José Mª de la Fuente.
Nosotros Proponemos: Turistas en ruta. Colegio José  Mª de la Fuente.Nosotros Proponemos: Turistas en ruta. Colegio José  Mª de la Fuente.
Nosotros Proponemos: Turistas en ruta. Colegio José Mª de la Fuente.Juan Martín Martín
 
Sesión de Formación 23-24 Nosotros Proponemos. Método científico y ciencia ci...
Sesión de Formación 23-24 Nosotros Proponemos. Método científico y ciencia ci...Sesión de Formación 23-24 Nosotros Proponemos. Método científico y ciencia ci...
Sesión de Formación 23-24 Nosotros Proponemos. Método científico y ciencia ci...Juan Martín Martín
 
Sesión de Formación Nosotros Proponemos 2023.24. Mayte Bejarano.
Sesión de Formación Nosotros Proponemos 2023.24. Mayte Bejarano.Sesión de Formación Nosotros Proponemos 2023.24. Mayte Bejarano.
Sesión de Formación Nosotros Proponemos 2023.24. Mayte Bejarano.Juan Martín Martín
 
FECHAS IMPORTANTES. Nosotros proponemos CR. 23.24
FECHAS IMPORTANTES. Nosotros proponemos CR. 23.24FECHAS IMPORTANTES. Nosotros proponemos CR. 23.24
FECHAS IMPORTANTES. Nosotros proponemos CR. 23.24Juan Martín Martín
 
Bases de participación 7ª edición ¡Proponemos! (Ciudad Real). Ciudadanía, Sos...
Bases de participación 7ª edición ¡Proponemos! (Ciudad Real). Ciudadanía, Sos...Bases de participación 7ª edición ¡Proponemos! (Ciudad Real). Ciudadanía, Sos...
Bases de participación 7ª edición ¡Proponemos! (Ciudad Real). Ciudadanía, Sos...Juan Martín Martín
 
III Congreso Internacional ¡Nosotros Proponemos! Ciudadanía, sostenibilidad e...
III Congreso Internacional ¡Nosotros Proponemos! Ciudadanía, sostenibilidad e...III Congreso Internacional ¡Nosotros Proponemos! Ciudadanía, sostenibilidad e...
III Congreso Internacional ¡Nosotros Proponemos! Ciudadanía, sostenibilidad e...Juan Martín Martín
 
Soluciones Examen de Selectividad. Geografía julio 2023 (Convocatoria Extraor...
Soluciones Examen de Selectividad. Geografía julio 2023 (Convocatoria Extraor...Soluciones Examen de Selectividad. Geografía julio 2023 (Convocatoria Extraor...
Soluciones Examen de Selectividad. Geografía julio 2023 (Convocatoria Extraor...Juan Martín Martín
 

More from Juan Martín Martín (20)

La fotogrametría en 3D con drones para su uso en el aula, de forma rápida y s...
La fotogrametría en 3D con drones para su uso en el aula, de forma rápida y s...La fotogrametría en 3D con drones para su uso en el aula, de forma rápida y s...
La fotogrametría en 3D con drones para su uso en el aula, de forma rápida y s...
 
Cuaderno de campo de Almagro: Visita turística
Cuaderno de campo de Almagro: Visita turísticaCuaderno de campo de Almagro: Visita turística
Cuaderno de campo de Almagro: Visita turística
 
Cuaderno de campo-Ciudad Real: Visita turística
Cuaderno de campo-Ciudad Real: Visita turísticaCuaderno de campo-Ciudad Real: Visita turística
Cuaderno de campo-Ciudad Real: Visita turística
 
Nosotros Proponemos: "Turistas en ruta". Colegio José Mª de la Fuente. Ciudad...
Nosotros Proponemos: "Turistas en ruta". Colegio José Mª de la Fuente. Ciudad...Nosotros Proponemos: "Turistas en ruta". Colegio José Mª de la Fuente. Ciudad...
Nosotros Proponemos: "Turistas en ruta". Colegio José Mª de la Fuente. Ciudad...
 
Nosotros Proponemos: "Cuidamos los gatos". Colegio José Mª de la Fuente.
Nosotros Proponemos: "Cuidamos los gatos". Colegio José Mª de la Fuente.Nosotros Proponemos: "Cuidamos los gatos". Colegio José Mª de la Fuente.
Nosotros Proponemos: "Cuidamos los gatos". Colegio José Mª de la Fuente.
 
Nosotros proponemos "Nuestro movimiento, nuestra luz". Colegio San Francisco...
Nosotros proponemos "Nuestro movimiento, nuestra luz". Colegio  San Francisco...Nosotros proponemos "Nuestro movimiento, nuestra luz". Colegio  San Francisco...
Nosotros proponemos "Nuestro movimiento, nuestra luz". Colegio San Francisco...
 
Nosotros proponemos "cultivando mentes". Colegio Tierno Galván de Puertollano
Nosotros proponemos  "cultivando mentes". Colegio Tierno Galván de PuertollanoNosotros proponemos  "cultivando mentes". Colegio Tierno Galván de Puertollano
Nosotros proponemos "cultivando mentes". Colegio Tierno Galván de Puertollano
 
Nosotros Proponemos "aceras sostenibles". Colegio San José de Ciudad Real
Nosotros Proponemos "aceras sostenibles". Colegio San José de Ciudad RealNosotros Proponemos "aceras sostenibles". Colegio San José de Ciudad Real
Nosotros Proponemos "aceras sostenibles". Colegio San José de Ciudad Real
 
Nosotros Proponemos "juntos para lograr un puerto-evolución. IES Fray Andrés ...
Nosotros Proponemos "juntos para lograr un puerto-evolución. IES Fray Andrés ...Nosotros Proponemos "juntos para lograr un puerto-evolución. IES Fray Andrés ...
Nosotros Proponemos "juntos para lograr un puerto-evolución. IES Fray Andrés ...
 
Nosotros Proponemos: "La huerta del San José" de Puertollano.
Nosotros Proponemos: "La huerta del San José" de Puertollano.Nosotros Proponemos: "La huerta del San José" de Puertollano.
Nosotros Proponemos: "La huerta del San José" de Puertollano.
 
Nosotros Proponemos: Restauración teatro. Inmaculada ENPETROL de Puertollano
Nosotros Proponemos: Restauración teatro. Inmaculada ENPETROL de PuertollanoNosotros Proponemos: Restauración teatro. Inmaculada ENPETROL de Puertollano
Nosotros Proponemos: Restauración teatro. Inmaculada ENPETROL de Puertollano
 
Nosotros Proponemos: Proyecto Infantil Orgánico Verde. Colegio Inocente Martí...
Nosotros Proponemos: Proyecto Infantil Orgánico Verde. Colegio Inocente Martí...Nosotros Proponemos: Proyecto Infantil Orgánico Verde. Colegio Inocente Martí...
Nosotros Proponemos: Proyecto Infantil Orgánico Verde. Colegio Inocente Martí...
 
Nosotros Proponemos: Turistas en ruta. Colegio José Mª de la Fuente.
Nosotros Proponemos: Turistas en ruta. Colegio José  Mª de la Fuente.Nosotros Proponemos: Turistas en ruta. Colegio José  Mª de la Fuente.
Nosotros Proponemos: Turistas en ruta. Colegio José Mª de la Fuente.
 
Sesión de Formación 23-24 Nosotros Proponemos. Método científico y ciencia ci...
Sesión de Formación 23-24 Nosotros Proponemos. Método científico y ciencia ci...Sesión de Formación 23-24 Nosotros Proponemos. Método científico y ciencia ci...
Sesión de Formación 23-24 Nosotros Proponemos. Método científico y ciencia ci...
 
Sesión de Formación Nosotros Proponemos 2023.24. Mayte Bejarano.
Sesión de Formación Nosotros Proponemos 2023.24. Mayte Bejarano.Sesión de Formación Nosotros Proponemos 2023.24. Mayte Bejarano.
Sesión de Formación Nosotros Proponemos 2023.24. Mayte Bejarano.
 
FECHAS IMPORTANTES. Nosotros proponemos CR. 23.24
FECHAS IMPORTANTES. Nosotros proponemos CR. 23.24FECHAS IMPORTANTES. Nosotros proponemos CR. 23.24
FECHAS IMPORTANTES. Nosotros proponemos CR. 23.24
 
Bases de participación 7ª edición ¡Proponemos! (Ciudad Real). Ciudadanía, Sos...
Bases de participación 7ª edición ¡Proponemos! (Ciudad Real). Ciudadanía, Sos...Bases de participación 7ª edición ¡Proponemos! (Ciudad Real). Ciudadanía, Sos...
Bases de participación 7ª edición ¡Proponemos! (Ciudad Real). Ciudadanía, Sos...
 
Bases de participación 7ª edición ¡Proponemos! (Ciudad Real). Ciudadanía, Sos...
Bases de participación 7ª edición ¡Proponemos! (Ciudad Real). Ciudadanía, Sos...Bases de participación 7ª edición ¡Proponemos! (Ciudad Real). Ciudadanía, Sos...
Bases de participación 7ª edición ¡Proponemos! (Ciudad Real). Ciudadanía, Sos...
 
III Congreso Internacional ¡Nosotros Proponemos! Ciudadanía, sostenibilidad e...
III Congreso Internacional ¡Nosotros Proponemos! Ciudadanía, sostenibilidad e...III Congreso Internacional ¡Nosotros Proponemos! Ciudadanía, sostenibilidad e...
III Congreso Internacional ¡Nosotros Proponemos! Ciudadanía, sostenibilidad e...
 
Soluciones Examen de Selectividad. Geografía julio 2023 (Convocatoria Extraor...
Soluciones Examen de Selectividad. Geografía julio 2023 (Convocatoria Extraor...Soluciones Examen de Selectividad. Geografía julio 2023 (Convocatoria Extraor...
Soluciones Examen de Selectividad. Geografía julio 2023 (Convocatoria Extraor...
 

Recently uploaded

Alper Gobel In Media Res Media Component
Alper Gobel In Media Res Media ComponentAlper Gobel In Media Res Media Component
Alper Gobel In Media Res Media ComponentInMediaRes1
 
Arihant handbook biology for class 11 .pdf
Arihant handbook biology for class 11 .pdfArihant handbook biology for class 11 .pdf
Arihant handbook biology for class 11 .pdfchloefrazer622
 
Introduction to ArtificiaI Intelligence in Higher Education
Introduction to ArtificiaI Intelligence in Higher EducationIntroduction to ArtificiaI Intelligence in Higher Education
Introduction to ArtificiaI Intelligence in Higher Educationpboyjonauth
 
Paris 2024 Olympic Geographies - an activity
Paris 2024 Olympic Geographies - an activityParis 2024 Olympic Geographies - an activity
Paris 2024 Olympic Geographies - an activityGeoBlogs
 
Mastering the Unannounced Regulatory Inspection
Mastering the Unannounced Regulatory InspectionMastering the Unannounced Regulatory Inspection
Mastering the Unannounced Regulatory InspectionSafetyChain Software
 
Solving Puzzles Benefits Everyone (English).pptx
Solving Puzzles Benefits Everyone (English).pptxSolving Puzzles Benefits Everyone (English).pptx
Solving Puzzles Benefits Everyone (English).pptxOH TEIK BIN
 
Employee wellbeing at the workplace.pptx
Employee wellbeing at the workplace.pptxEmployee wellbeing at the workplace.pptx
Employee wellbeing at the workplace.pptxNirmalaLoungPoorunde1
 
Micromeritics - Fundamental and Derived Properties of Powders
Micromeritics - Fundamental and Derived Properties of PowdersMicromeritics - Fundamental and Derived Properties of Powders
Micromeritics - Fundamental and Derived Properties of PowdersChitralekhaTherkar
 
MENTAL STATUS EXAMINATION format.docx
MENTAL     STATUS EXAMINATION format.docxMENTAL     STATUS EXAMINATION format.docx
MENTAL STATUS EXAMINATION format.docxPoojaSen20
 
Presentation by Andreas Schleicher Tackling the School Absenteeism Crisis 30 ...
Presentation by Andreas Schleicher Tackling the School Absenteeism Crisis 30 ...Presentation by Andreas Schleicher Tackling the School Absenteeism Crisis 30 ...
Presentation by Andreas Schleicher Tackling the School Absenteeism Crisis 30 ...EduSkills OECD
 
BASLIQ CURRENT LOOKBOOK LOOKBOOK(1) (1).pdf
BASLIQ CURRENT LOOKBOOK  LOOKBOOK(1) (1).pdfBASLIQ CURRENT LOOKBOOK  LOOKBOOK(1) (1).pdf
BASLIQ CURRENT LOOKBOOK LOOKBOOK(1) (1).pdfSoniaTolstoy
 
Incoming and Outgoing Shipments in 1 STEP Using Odoo 17
Incoming and Outgoing Shipments in 1 STEP Using Odoo 17Incoming and Outgoing Shipments in 1 STEP Using Odoo 17
Incoming and Outgoing Shipments in 1 STEP Using Odoo 17Celine George
 
Kisan Call Centre - To harness potential of ICT in Agriculture by answer farm...
Kisan Call Centre - To harness potential of ICT in Agriculture by answer farm...Kisan Call Centre - To harness potential of ICT in Agriculture by answer farm...
Kisan Call Centre - To harness potential of ICT in Agriculture by answer farm...Krashi Coaching
 
Science 7 - LAND and SEA BREEZE and its Characteristics
Science 7 - LAND and SEA BREEZE and its CharacteristicsScience 7 - LAND and SEA BREEZE and its Characteristics
Science 7 - LAND and SEA BREEZE and its CharacteristicsKarinaGenton
 
Concept of Vouching. B.Com(Hons) /B.Compdf
Concept of Vouching. B.Com(Hons) /B.CompdfConcept of Vouching. B.Com(Hons) /B.Compdf
Concept of Vouching. B.Com(Hons) /B.CompdfUmakantAnnand
 
Introduction to AI in Higher Education_draft.pptx
Introduction to AI in Higher Education_draft.pptxIntroduction to AI in Higher Education_draft.pptx
Introduction to AI in Higher Education_draft.pptxpboyjonauth
 
POINT- BIOCHEMISTRY SEM 2 ENZYMES UNIT 5.pptx
POINT- BIOCHEMISTRY SEM 2 ENZYMES UNIT 5.pptxPOINT- BIOCHEMISTRY SEM 2 ENZYMES UNIT 5.pptx
POINT- BIOCHEMISTRY SEM 2 ENZYMES UNIT 5.pptxSayali Powar
 
Industrial Policy - 1948, 1956, 1973, 1977, 1980, 1991
Industrial Policy - 1948, 1956, 1973, 1977, 1980, 1991Industrial Policy - 1948, 1956, 1973, 1977, 1980, 1991
Industrial Policy - 1948, 1956, 1973, 1977, 1980, 1991RKavithamani
 

Recently uploaded (20)

Alper Gobel In Media Res Media Component
Alper Gobel In Media Res Media ComponentAlper Gobel In Media Res Media Component
Alper Gobel In Media Res Media Component
 
Arihant handbook biology for class 11 .pdf
Arihant handbook biology for class 11 .pdfArihant handbook biology for class 11 .pdf
Arihant handbook biology for class 11 .pdf
 
Introduction to ArtificiaI Intelligence in Higher Education
Introduction to ArtificiaI Intelligence in Higher EducationIntroduction to ArtificiaI Intelligence in Higher Education
Introduction to ArtificiaI Intelligence in Higher Education
 
Paris 2024 Olympic Geographies - an activity
Paris 2024 Olympic Geographies - an activityParis 2024 Olympic Geographies - an activity
Paris 2024 Olympic Geographies - an activity
 
Mastering the Unannounced Regulatory Inspection
Mastering the Unannounced Regulatory InspectionMastering the Unannounced Regulatory Inspection
Mastering the Unannounced Regulatory Inspection
 
Staff of Color (SOC) Retention Efforts DDSD
Staff of Color (SOC) Retention Efforts DDSDStaff of Color (SOC) Retention Efforts DDSD
Staff of Color (SOC) Retention Efforts DDSD
 
Solving Puzzles Benefits Everyone (English).pptx
Solving Puzzles Benefits Everyone (English).pptxSolving Puzzles Benefits Everyone (English).pptx
Solving Puzzles Benefits Everyone (English).pptx
 
Employee wellbeing at the workplace.pptx
Employee wellbeing at the workplace.pptxEmployee wellbeing at the workplace.pptx
Employee wellbeing at the workplace.pptx
 
Micromeritics - Fundamental and Derived Properties of Powders
Micromeritics - Fundamental and Derived Properties of PowdersMicromeritics - Fundamental and Derived Properties of Powders
Micromeritics - Fundamental and Derived Properties of Powders
 
MENTAL STATUS EXAMINATION format.docx
MENTAL     STATUS EXAMINATION format.docxMENTAL     STATUS EXAMINATION format.docx
MENTAL STATUS EXAMINATION format.docx
 
Código Creativo y Arte de Software | Unidad 1
Código Creativo y Arte de Software | Unidad 1Código Creativo y Arte de Software | Unidad 1
Código Creativo y Arte de Software | Unidad 1
 
Presentation by Andreas Schleicher Tackling the School Absenteeism Crisis 30 ...
Presentation by Andreas Schleicher Tackling the School Absenteeism Crisis 30 ...Presentation by Andreas Schleicher Tackling the School Absenteeism Crisis 30 ...
Presentation by Andreas Schleicher Tackling the School Absenteeism Crisis 30 ...
 
BASLIQ CURRENT LOOKBOOK LOOKBOOK(1) (1).pdf
BASLIQ CURRENT LOOKBOOK  LOOKBOOK(1) (1).pdfBASLIQ CURRENT LOOKBOOK  LOOKBOOK(1) (1).pdf
BASLIQ CURRENT LOOKBOOK LOOKBOOK(1) (1).pdf
 
Incoming and Outgoing Shipments in 1 STEP Using Odoo 17
Incoming and Outgoing Shipments in 1 STEP Using Odoo 17Incoming and Outgoing Shipments in 1 STEP Using Odoo 17
Incoming and Outgoing Shipments in 1 STEP Using Odoo 17
 
Kisan Call Centre - To harness potential of ICT in Agriculture by answer farm...
Kisan Call Centre - To harness potential of ICT in Agriculture by answer farm...Kisan Call Centre - To harness potential of ICT in Agriculture by answer farm...
Kisan Call Centre - To harness potential of ICT in Agriculture by answer farm...
 
Science 7 - LAND and SEA BREEZE and its Characteristics
Science 7 - LAND and SEA BREEZE and its CharacteristicsScience 7 - LAND and SEA BREEZE and its Characteristics
Science 7 - LAND and SEA BREEZE and its Characteristics
 
Concept of Vouching. B.Com(Hons) /B.Compdf
Concept of Vouching. B.Com(Hons) /B.CompdfConcept of Vouching. B.Com(Hons) /B.Compdf
Concept of Vouching. B.Com(Hons) /B.Compdf
 
Introduction to AI in Higher Education_draft.pptx
Introduction to AI in Higher Education_draft.pptxIntroduction to AI in Higher Education_draft.pptx
Introduction to AI in Higher Education_draft.pptx
 
POINT- BIOCHEMISTRY SEM 2 ENZYMES UNIT 5.pptx
POINT- BIOCHEMISTRY SEM 2 ENZYMES UNIT 5.pptxPOINT- BIOCHEMISTRY SEM 2 ENZYMES UNIT 5.pptx
POINT- BIOCHEMISTRY SEM 2 ENZYMES UNIT 5.pptx
 
Industrial Policy - 1948, 1956, 1973, 1977, 1980, 1991
Industrial Policy - 1948, 1956, 1973, 1977, 1980, 1991Industrial Policy - 1948, 1956, 1973, 1977, 1980, 1991
Industrial Policy - 1948, 1956, 1973, 1977, 1980, 1991
 

Datos de La población mundial 2016. (Population Reference Bureau) 2016 world-population-data-sheet eng

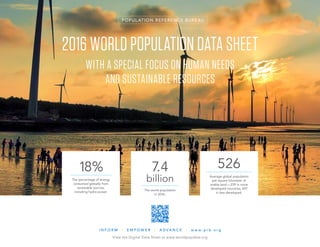
  • 1. POPUL ATION REFERENCE BUREAU 2016 WORLD POPULATION DATA SHEET WITH A SPECIAL FOCUS ON HUMAN NEEDS AND SUSTAINABLE RESOURCES 18% The percentage of energy consumed globally from renewable sources, including hydro power. 7.4 billion The world population in 2016. 526 Average global population per square kilometer of arable land—239 in more developed countries, 697 in less developed. I N F O R M | E M P O W E R | A D V A N C E | w w w . p r b . o r g View the Digital Data Sheet at www.worldpopdata.org
  • 2. © 2016 Population Reference Bureau See notes on page 20 2016 WORLD POPULATION DATA SHEET 2 NOTE: 2016 data refer to latest data available. COUNTRY, 2050 POPULATION (MILLIONS) India 1,708 China 1,344 United States 398 Nigeria 398 Indonesia 360 Pakistan 344 Brazil 226 Congo, Dem. Rep. 214 Bangladesh 202 Egypt 169 COUNTRY, 2016 POPULATION (MILLIONS) China 1,378 India 1,329 United States 324 Indonesia 259 Brazil 206 Pakistan 203 Nigeria 187 Bangladesh 163 Russia 144 Mexico 129 HIGHEST Niger 7.6 South Sudan 6.7 Congo, Dem. Rep. 6.5 Chad 6.4 Somalia 6.4 Burundi 6.1 Angola 6.0 Mali 6.0 Mozambique 5.9 Uganda 5.8 LOWEST Korea, South 1.2 Romania 1.2 Singapore 1.2 Taiwan 1.2 Bosnia-Herzegovina 1.3 Greece 1.3 Moldova 1.3 Poland 1.3 Portugal 1.3 Spain 1.3 Most Populous Countries Highest and Lowest Total Fertility Rates, 2016
  • 3. © 2016 Population Reference Bureau See notes on page 20 2016 WORLD POPULATION DATA SHEET 3 WORLD MORE DEVELOPED COUNTRIES LESS DEVELOPED COUNTRIES Population 7,418,151,841 1,254,309,821 6,163,842,020 Births per Year 147,183,065 13,714,857 133,468,215 Day 403,241 37,575 365,666 Minute 280 26 254 Deaths per Year 57,387,752 12,580,616 44,807,108 Day 157,227 34,467 122,759 Minute 109 24 85 Natural increase per Year 89,795,313 1,134,242 88,661,107 Day 246,015 3,108 242,907 Minute 171 2 169 Infant deaths per Year 5,226,233 65,229 5,160,998 Day 14,318 179 14,140 Minute 10 0.1 10 Population Clock, 2016
  • 4. © 2016 Population Reference Bureau 2016 WORLD POPULATION DATA SHEET 4 W O R L D P O P U L AT I O N H I G H L I G H T S FOCUS ON HUMAN NEEDS AND SUSTAINABLE RESOURCES U.S. Air Quality Improvements Led by Metro Areas Particulate matter (PM) in the air is composed of dust, dirt, soot, smoke, and liquid droplets. Fine PM (particles smaller than 2.5 micrometers, known as PM2.5) can lodge deeply in the lungs and is hazardous to humans and to the environment. Numerous studies have linked PM2.5 to serious health problems including irregular heartbeat, asthma, heart attack, and premature death. Particulate matter can also pollute waterways and damage forests and crops. Air quality in the United States has improved since passage of the Clean Air Act of 1963 and its major amendments in 1970, 1977, and 1990. Stricter emissions regulations have reduced PM2.5 pollution nationwide, but rates of improvement have been fastest in metropolitan areas and manufacturing-dependent counties, which have higher levels of particulate pollution from motor vehicles, power plants, and industrial activity. Although rates of improvement have been slower in rural, mining, and agricultural areas, PM2.5 pollution remains lower than in metropolitan areas or manufacturing-dependent counties. And while air quality has improved, U.S. public health experts believe there is no safe level of exposure to particulate matter. Annual Average Ambient Concentration of Fine Particulate Matter (PM 2.5) in Micrograms per Cubic Meter, Averages Across U.S. Counties 11.9 9.3 13.2 10.2 8.4 9.6 8.1 14.1 10.5 12.7 9.9 11.1 8.9 Mid to Small Metro Non-Metro/ Rural Large MetroFarm- Dependent Mining- Dependent Manufacturing- Dependent National Average 2001 2011 10.0 Notes: Large Metro is defined as 1 million population or more. Mid to Small Metro is defined as metropolitan area with less than 1 million population. Sources: U.S. Environmental Protection Agency; PRB analysis of data from Centers for Disease Control and Prevention (CDC); and U.S. Department of Agriculture, Economic Research Service. Middle-I Worldwide, the hi adoption of pollut nations is to ensu particulate air pol from manufacturi the World Health currently is over fi Trend in Annua Averages Acros 1990 Upper-Middle Lower-Middle Low High 27 30 21 18 WHO Recom 10 GNI per Capita: Note: Country level PM aggregated to income Sources: Michael Bra 79-88; World Bank; an Summary of Risk Asse Municipal OPULATION (MILLIONS) 1,708 1,344 398 398 360 344 226 214 202 169 DEVELOPED COUNTRIES 163,842,020 133,468,215 365,666 254 1.2 1.2 1.2 1.2 1.3 1.3 1.3 1.3 1.3 1.3 W O R L D P O P U L AT I O N FO CUS ON HUM A N NEEDS A N D SUS T
  • 5. © 2016 Population Reference Bureau 2016 WORLD POPULATION DATA SHEET 5 W O R L D P O P U L AT I O N H I G H L I G H T S FOCUS ON HUMAN NEEDS AND SUSTAINABLE RESOURCES 2.5 s studies culate ge of the .5 pollution have have been pendent e matter. 8.9 n-Metro/ Rural ure, Middle-Income Countries Face Biggest Air Pollution Challenge Worldwide, the highest national-level concentrations of PM2.5 are in middle-income countries such as China and Bangladesh where adoption of pollution control measures has lagged behind rapid industrialization. The challenge for both low-income and middle-income nations is to ensure people have clean air to breathe without hindering development. As depicted in the accompanying U.S. graphic, particulate air pollution in many of the world’s high-income countries has declined with shifts towards more efficient energy use and away from manufacturing. However, no group of countries is immune to the dangers of air pollution; even the high-income average surpasses the World Health Organization’s target of limiting the presence of PM2.5 to no more than 10 micrograms per cubic meter of air. China currently is over five times this level, while France exceeds the recommended level by 40 percent. Trend in Annual Average Ambient Concentration of Fine Particular Matter (PM2.5) in Micrograms per Cubic Meter, Averages Across Countries by Income Category 1990 1995 2000 2005 2010 2013 Upper-Middle Lower-Middle Low High 27 36 39 20 15 30 21 18 WHO Recommended Limit 10 10 GNI per Capita: Low-Income $1,045 or Less Lower Middle-Income $1,046 to $4,125 Upper Middle-Income $4,126 to $12,735 High-Income $12,736 or More Note: Country level PM2.5 estimates are calculated using satellite-based estimates, chemical transport model simulations, and ground measurements. Country estimates are aggregated to income level groups by the World Bank. Sources: Michael Brauer et al., “Ambient Air Pollution Exposure Estimation for the Global Burden of Disease 2013,” Environmental Science Technology 50, no. 1 (2016): 79-88; World Bank; and World Health Organization, WHO Air Quality Guidelines for Particulate Matter, Ozone, Nitrogen Dioxide, and Sulfur Dioxide: Global Update 2005, Summary of Risk Assessment. L AT I O N H I G H L I G H T S EEDS A N D SUS TA IN A BL E RE SOURCE S
  • 6. © 2016 Population Reference Bureau 2016 WORLD POPULATION DATA SHEET 6 W O R L D P O P U L AT I O N H I G H L I G H T S FOCUS ON HUMAN NEEDS AND SUSTAINABLE RESOURCES SAN FRANCISCO, UNITED STATES 100 • 100 • 48 608 ATHENS, GREECE 100 • 100 • 24 584 ROTTERDAM, NETHERLANDS 100 • 100 • 23 551 BUENOS AIRES, ARGENTINA 96 • 97 • 8 430 GUADALAJARA, MEXICO 95 • 97 • 8 429 ADELAIDE, AUSTRALIA 100 • 100 • 54 417 BAHRAIN, BAHRAIN 100 • 100 • 8 400 SOFIA, BULGARIA 100 • 100 • 11 370 SINGAPORE, SINGAPORE 100 • 100 • 20 318 QUEZON CITY, PHILIPPINES 99 • 98 • 39257 JAKARTA, INDONESIA 95 • 84 • 10253 MONROVIA, LIBERIA 37 • 70 • 8225 LAHORE, PAKISTAN 77 • 18 • 35219 LUSAKA, ZAMBIA 63 • 45 • 14 BISHKEK, KYRGYZSTAN 83 • 0 • 18 BANGALORE, INDIA 75 • 73 • 32 201 200 200 DHAKA, BANGLADESH 55 • 55 • 15 193 KAMPALA, UGANDA 50 • 100 • 11 183 LEGEND SOFIA, BULGARIA 100 • 100 • 11 370 Waste Collection Coverage (% of city population) Controlled Disposal (% of collected waste properly managed) Recycling Rate (% of total waste generated) The volume of Annual Municipal Solid Waste (kg per capita) is indicated by both the size of the circle and the value in each circle. World Bank income category of the country where the city is located. LOW HIGHLOWER- MIDDLE UPPER- MIDDLE Municipal Waste Volumes per Capita Rise With Income Proper municipal waste disposal is a public health and environmental priority as urban populations grow. City residents without regular refuse collection services risk exposure to contaminants that spread into soil, streets, and water. Uncontrolled dumpsites taint water tables and release airborne toxins as unsorted refuse is burned. Global municipal waste data show that per capita volumes tend to rise with average income levels but negative impacts lessen as wealthier cities improve waste processing systems. While some cities in lower-income countries have expanded collection coverage, many still lag in proper waste processing—or controlled disposal. Collection in Lahore, Pakistan covers 77 percent of the population but only 18 percent of collections go to a controlled disposal facility. Lusaka, Zambia has 63 percent coverage and a 45 percent rate of controlled disposal. Recycling rates reach relatively high levels in some lower-income countries, often due to informal recycling networks. Sources: David C. Wilson, et al., “‘Wasteaware’ Benchmark Indicators for Integrated Sustainable Waste Management in Cities,” Waste Management 35, no. 1 (2015): 329-43; United Nations Environment Programme and International Solid Waste Association, Global Waste Management Outlook, David C. Wilson, ed.
  • 7. © 2016 Population Reference Bureau 2016 WORLD POPULATION DATA SHEET 7 W O R L D P O P U L AT I O N H I G H L I G H T S FOCUS ON HUMAN NEEDS AND SUSTAINABLE RESOURCES al Land Protected rial land under protected national Union for re defines a protected fined geographical space, d, and managed, through e means, to achieve vation of nature with m services and cultural ea includes total land rs. Data are calculated base on Protected by mdgs.un.org. are Kilometer opulation divided ters of arable land. d by the UN Food and ion (FAO) to include orary agricultural crops eas are counted only adows for mowing or market and kitchen mporarily fallow (less a for the percent and the square ry are from the FAO. BUENOS AIRES, ARGENTINA 96 • 97 • 8 430 SOFIA, BULGARIA 100 • 100 • 11 Waste Collection Coverage (% of city p Controlled Disposal (% of collected Recycling Rate (% of total waste the value in each circle. More People Have Improved Access to Water and Sanitation Access to safe drinking water and basic sanitation is fundamental to sustainable development and human health. Progress on water in the past 25 years has brought access to piped water close to home (the definition of improved access) to 91 percent of the world’s population, up from 76 percent in 1990. Of those remaining without improved access, nearly half are in sub-Saharan Africa. Sanitation status has been more varied, yet progress is clear. Whereas some countries, like Chile, already had good access that is now almost universal, other countries have made more progress on sanitation than water, such as Angola. Still, more than 2.4 billion people, mostly in eastern and southern Asia and sub-Saharan Africa, do not have access to improved sanitation facilities. And urban-rural gaps are sharp: Eighty-two percent of urban dwellers, but only 51 percent of rural residents, use improved sanitation facilities. Most developed countries have nearly universal access to water and sanitation. Percent of Population With Improved Access to Sanitation and Water, 1990 and 2014, Select Countries Chile Vietnam India Kyrgyzstan Ethiopia Angola 3 28 13 57 22 52 46 49 71 94 17 40 75 90 91 93 90 99 85 99 63 98 36 78 Water 1990 Water 2014 Sanitation 1990 Sanitation 2014 Source: UNICEF and World Health Organization, 25 Years: Progress on Sanitation and Drinking Water, 2015 Update and MDG Assessment. Aquacult Seafood is an imp changes in ocean Fund estimates th enforce sustainabl of 19 kilograms pe of fish consumed Trend in Annual 20% 40% 60% 80% 100% 19721970 Fish Supply by Sou 0% Sources: Food and Ag d Population Data in English and b.org. Also online: igital Data Sheet ive data map and about countries’ ion growth lications le for bulk orders): prb.org. @prb.org. 00-877-9881. 3937. necticut Ave., NW, hington, DC 20009. PRB demographers nd Kristin Bietsch. nce Bureau. d. aiwan Nans0410/
  • 8. © 2016 Population Reference Bureau 2016 WORLD POPULATION DATA SHEET 8 W O R L D P O P U L AT I O N H I G H L I G H T S FOCUS ON HUMAN NEEDS AND SUSTAINABLE RESOURCES ADELAIDE, AUSTRALIA 100 • 100 • 54 417 SOFIA, BULGARIA 100 • 100 • 11 370 Waste Collection Coverage (% of city population) Controlled Disposal (% of collected waste properly managed) Recycling Rate (% of total waste generated) capita) is indicated by both the size of the circle and the value in each circle. country where the city is located. LOW HIGHLOWER- MIDDLE UPPER- MIDDLE tion n t of ran ccess han cilities. 94 93 99 99 98 Aquaculture Meets Fish Demand as Ocean Catches Decline Seafood is an important protein source for about 3 billion people worldwide. Population growth, new ocean fishing technologies, and changes in ocean ecosystems have placed strains on wild fish stocks. Total ocean catches peaked in the late 1990s and the World Wildlife Fund estimates that the oceans contain half the number of fish they did in 1970. Declining catches also reflect national and global efforts to enforce sustainable catch limits. Strong growth in aquaculture has allowed per capita fish consumption to rise steadily, to a global average of 19 kilograms per person in 2012 from about 10 kilograms in the 1960s. In 2012, aquaculture was the source for about half (49 percent) of fish consumed by humans, up from 5 percent in 1962. Trend in Annual World Fish Supply by Source and Fish Consumption per Capita, 1970-2012 20% 40% 60% 80% 100% 2012201020082006200420022000199819961994199219901988198619841982198019781976197419721970 4 8 12 16 20 CATCH AQUACULTURE Fish Supply by Source Fish Consumption (kg per capita) 0% 0 World Fish Consumption Over Time (kg per capita per year) Sources: Food and Agriculture Organization, Fisheries and Aquaculture Department.
  • 9. © 2016 Population Reference Bureau 2016 WORLD POPULATION DATA SHEET 9 W O R L D P O P U L AT I O N H I G H L I G H T S FOCUS ON HUMAN NEEDS AND SUSTAINABLE RESOURCES 728MILLION Projected 2050 population of Europe,down from 740 million in 2016. 50%Percentage of the population in Niger that is less than 15 years old. $1,760 Gross national income per capita of Haiti. 38Infant deaths per 1,000 live births in Bangladesh. 3.5The total fertility rate (lifetime births per woman) in Egypt. 2.8MILLION Metric tons of carbon emitted by China in 2013,almost four times the level of 1992. 54%Percentage of the world’s population living in urban areas. 34%Percentage of people in the least-developed countries with access to electricity,compared to 85 percent globally.
  • 10. © 2016 Population Reference Bureau See notes on page 20 2016 WORLD POPULATION DATA SHEET 10 Population mid-2016 (millions) Births per 1,000 Population Deaths per 1,000 Population Net Migration Rate per 1,000 Population Infant Mortality Ratea Total Fertility Rateb Percent of Population GNI per Capita ($US) Percent Urban Percent of Married Women 15-49 Using Contraceptionc Life Expectancy at Birth (years) Ma Dea 100,0 mid-2030 (millions) mid-2050 (millions) Ages 15 Ages 65+ 2015 All Methods Modern Methods Males Females 2 WORLD 7,418 20 8 — 8,539 9,869 36 2.5 26 8 15,415 54 62 56 70 74 MORE DEVELOPED 1,254 11 10 3 1,298 1,322 5 1.7 16 18 39,963 78 70 62 76 82 LESS DEVELOPED 6,164 22 7 -0 7,241 8,548 39 2.6 28 7 10,214 49 61 55 68 72 LESS DEVELOPED (Excl. China) 4,778 24 7 -0 5,821 7,195 43 2.9 31 5 8,936 47 54 46 67 70 LEAST DEVELOPED 962 33 9 -1 1,318 1,923 59 4.3 41 4 2,424 32 36 32 61 64 AFRICA 1,203 36 10 -1 1,681 2,527 57 4.7 41 4 4,802 41 35 30 59 62 SUB-SAHARAN AFRICA 974 37 11 -0 1,388 2,128 62 5.0 43 3 3,606 39 31 26 57 59 NORTHERN AFRICA 229 29 6 -1 293 400 29 3.4 32 5 9,798 51 52 46 69 73 Algeria 40.8 26 5 0 50.6 63.2 21 3.1 29 6 14,280 71 57 48 73 78 Egypt 93.5 31 6 -1 121.6 168.8 22 3.5 31 4 10,690 43 58 57 70 73 Libya 6.3 20 5 -10 7.4 8.4 23 2.4 30 5 15,140 79 42 20 69 75 Morocco 34.7 20 6 -2 38.1 38.8 24 2.4 25 6 7,680 60 67 57 73 75 Sudan 42.1 37 8 -3 61.7 105.0 51 5.2 43 3 4,080 34 12 12 61 64 Tunisia 11.3 20 7 -1 13.1 14.9 17 2.4 24 8 11,060 68 62 50 73 77 Western Saharae 0.6 18 6 8 0.7 0.9 35 2.1 26 3 — 81 — — 67 71 WESTERN AFRICA 359 39 11 -1 515 800 64 5.4 44 3 4,135 45 18 13 55 56 Benin 10.8 36 9 -0 16.6 24.0 66 4.7 45 3 2,100 44 18 12 58 61 Burkina Faso 19.0 41 10 -1 28.2 47.0 65 5.7 49 3 1,640 30 21 20 57 60 Cape Verde 0.5 21 5 -4 0.6 0.7 19 2.3 28 6 6,390 66 61 57 71 80 Côte d’Ivoire 23.9 37 13 0 33.0 50.1 69 4.9 42 3 3,240 54 18 12 51 53 Gambia 2.1 41 9 -1 3.2 5.1 45 5.6 46 2 1,580 60 9 8 59 62 Ghana 28.2 33 8 -1 37.1 50.4 41 4.2 39 5 4,070 54 35 29 60 63 Guinea 11.2 37 10 -0 18.3 27.5 67 5.1 43 3 1,120 37 6 5 58 59 Guinea-Bissau 1.9 37 12 -1 2.5 3.6 88 4.9 43 3 1,450 49 16 14 54 57 Liberia 4.6 35 9 -1 6.4 9.4 54 4.7 42 3 720 50 20 19 60 62 Mali 17.3 44 13 -3 26.1 43.6 56 6.0 47 3 2,360 40 16 15 54 54 Mauritania 4.2 31 8 -1 5.7 8.0 72 4.2 40 3 3,710 60 11 10 62 65 Niger 19.7 49 9 -0 34.3 68.9 56 7.6 50 3 950 22 14 12 61 62 Nigeria 186.5 39 13 -0 261.9 397.5 69 5.5 43 3 5,800 48 15 10 53 53 Senegal 14.8 38 6 -1 21.6 34.4 39 5.0 44 4 2,390 45 23 21 65 68 Sierra Leone 6.6 37 14 -1 8.9 12.6 89 4.9 42 3 1,560 40 17 16 50 52 1, Togo 7.5 36 9 -0 10.9 17.4 47 4.7 42 3 1,320 38 20 17 59 61 EASTERN AFRICA 394 36 9 -1 561 844 51 4.8 43 3 2,019 26 40 37 60 64 Burundi 11.1 42 10 0 17.2 30.4 63 6.1 46 2 730 12 32 30 58 61 Comoros 0.8 33 7 -3 1.0 1.4 36 4.3 40 3 1,430 28 19 14 62 65 Djibouti 0.9 25 9 -3 1.1 1.2 53 3.2 33 4 — 77 19 18 60 64 Eritrea 5.4 34 7 -5 7.3 10.4 43 4.2 43 3 — 23 8 7 62 66 Ethiopia 101.7 30 7 -0 132.9 168.6 47 4.2 41 3 1,620 20 37 36 62 66 Kenya 45.4 31 7 -0 63.7 88.2 39 3.9 42 3 3,060 26 66 63 60 65 Madagascar 23.7 33 7 0 32.9 47.1 36 4.3 41 3 1,400 35 40 33 64 67 Malawi 17.2 34 10 -0 23.4 32.2 42 4.4 40 4 1,140 16 59 58 62 64 Mauritius 1.3 10 8 -1 1.2 1.1 13.6 1.4 20 9 19,290 41 76 39 71 78 Mayotte 0.2 33 3 -0 0.3 0.5 4 4.0 44 3 — 47 — — 75 78 Mozambique 27.2 45 14 0 41.9 74.4 81 5.9 45 3 1,170 32 12 11 52 56 Reunion 0.8 17 5 -7 1.0 1.1 7 2.5 24 10 — 95 67 64 77 84 Rwanda 11.9 34 7 -1 16.4 23.6 32 4.2 41 3 1,720 29 53 48 62 66 Seychelles 0.09 17 7 1 0.1 0.1 13.4 2.4 22 8 25,760 54 — — 70 79 Somalia 11.1 44 12 -6 16.5 27.0 76 6.4 47 3 — 40 15 1 54 57 South Sudan 12.7 37 12 10 17.8 25.9 74 6.7 42 3 1,630 19 4 1 55 57 Tanzania 54.2 37 7 -1 81.5 134.8 43 5.2 45 3 2,620 30 38 32 64 66 Uganda 36.6 43 10 -4 58.1 101.5 53 5.8 48 3 1,780 20 34 30 62 64 POPULATION, HEALTH, AND ENVIRONMENT DATA AND ESTIMATES FOR THE COUNTRIES AND REGIONS OF THE WORLD
  • 11. © 2016 Population Reference Bureau See notes on page 20 2016 WORLD POPULATION DATA SHEET 11 Ethiopia 101.7 30 7 -0 132.9 168.6 47 4.2 41 3 1,620 20 37 36 62 66 Kenya 45.4 31 7 -0 63.7 88.2 39 3.9 42 3 3,060 26 66 63 60 65 Madagascar 23.7 33 7 0 32.9 47.1 36 4.3 41 3 1,400 35 40 33 64 67 Malawi 17.2 34 10 -0 23.4 32.2 42 4.4 40 4 1,140 16 59 58 62 64 Mauritius 1.3 10 8 -1 1.2 1.1 13.6 1.4 20 9 19,290 41 76 39 71 78 Mayotte 0.2 33 3 -0 0.3 0.5 4 4.0 44 3 — 47 — — 75 78 Mozambique 27.2 45 14 0 41.9 74.4 81 5.9 45 3 1,170 32 12 11 52 56 Reunion 0.8 17 5 -7 1.0 1.1 7 2.5 24 10 — 95 67 64 77 84 Rwanda 11.9 34 7 -1 16.4 23.6 32 4.2 41 3 1,720 29 53 48 62 66 Seychelles 0.09 17 7 1 0.1 0.1 13.4 2.4 22 8 25,760 54 — — 70 79 Somalia 11.1 44 12 -6 16.5 27.0 76 6.4 47 3 — 40 15 1 54 57 South Sudan 12.7 37 12 10 17.8 25.9 74 6.7 42 3 1,630 19 4 1 55 57 Tanzania 54.2 37 7 -1 81.5 134.8 43 5.2 45 3 2,620 30 38 32 64 66 Uganda 36.6 43 10 -4 58.1 101.5 53 5.8 48 3 1,780 20 34 30 62 64 Zambia 15.9 43 13 -0 24.1 41.0 52 5.3 46 3 3,700 40 49 45 51 56 Zimbabwe 16.0 36 10 -3 22.2 33.2 50 4.0 42 3 1,700 33 66 66 56 59 MIDDLE AFRICA 157 44 14 -0 238 396 88 6.0 45 3 2,617 47 21 11 51 54 Angola 25.8 45 14 1 39.4 65.5 93 6.0 48 2 6,450 62 18 12 51 54 Cameroon 24.4 38 10 -0 34.4 51.9 55 4.9 43 3 3,080 54 34 21 56 59 Central African Republic 5.0 34 14 0 6.7 9.7 90 4.4 39 4 600 40 15 9 49 53 Chad 14.5 47 14 1 22.7 38.5 87 6.4 48 2 2,110 22 6 5 51 53 Congo 4.9 37 10 -7 6.7 10.2 48 4.7 41 3 6,300 65 30 18 57 60 Congo, Dem. Rep. 79.8 46 16 -0 124.2 213.8 97 6.5 46 3 720 42 21 8 49 52 Equatorial Guinea 0.9 35 11 5 1.3 2.0 67 4.9 39 3 16,450 40 13 10 56 59 Gabon 1.8 32 9 1 2.4 3.5 43 4.1 37 5 18,810 87 31 19 64 65 Sao Tome and Principe 0.2 33 7 -6 0.3 0.3 38 4.4 42 4 3,160 67 41 37 64 68 SOUTHERN AFRICA 64 23 10 3 74 88 36 2.5 31 5 12,404 62 60 59 60 63 Botswana 2.2 25 8 2 2.7 3.3 31 2.8 33 5 15,600 57 53 51 62 67 Lesotho 2.2 29 15 -2 2.6 3.4 59 3.3 36 5 3,160 27 60 60 50 50 Namibia 2.5 29 7 0 3.3 4.7 39 3.6 34 4 10,380 47 56 55 62 67 South Africa 55.7 22 10 3 63.4 75.2 34 2.4 30 5 12,830 65 60 60 60 64 Swaziland 1.3 29 14 -1 1.5 1.8 50 3.3 37 4 8,040 21 66 66 50 48 AMERICAS 998 15 7 1 1,117 1,221 14 2.0 23 10 30,077 80 73 68 74 80 NORTHERN AMERICA 360 12 8 4 401 445 6 1.8 19 15 55,179 81 74 68 77 81 Canada 36.2 11 8 6 41.0 46.9 4.4 1.6 16 16 43,970 82 74 72 79 84 United States 323.9 12 8 4 359.4 398.3 5.8 1.8 19 15 56,430 81 74 68 76 81 LATIN AMERICA AND THE CARIBBEAN 637 17 6 -1 716 775 17 2.1 26 8 14,512 80 73 67 72 79 CENTRAL AMERICA 175 19 5 -1 205 232 16 2.3 29 6 14,896 74 72 65 74 79 Belize 0.4 22 6 4 0.5 0.6 14 2.5 36 4 7,880 45 55 52 71 77 Costa Rica 4.9 15 4 1 5.6 6.1 8.0 1.8 23 7 14,880 77 76 75 77 82 El Salvador 6.4 18 7 -7 6.7 6.7 17 2.0 27 8 8,220 67 72 68 68 78 Guatemala 16.6 24 5 -1 21.3 27.6 28 3.1 40 5 7,510 52 61 49 69 76 Honduras 8.2 22 5 -2 10.2 12.6 26 2.5 32 5 4,740 55 73 64 71 76 Mexico 128.6 19 5 -1 148.1 163.8 13 2.2 28 6 17,150 79 72 66 74 79 Nicaragua 6.3 20 5 -4 7.5 9.1 19 2.4 30 5 5,050 59 80 76 72 78 Panama 4.0 19 5 2 4.8 5.7 14 2.4 27 8 20,710 67 63 60 75 81 CARIBBEAN 43 17 8 -4 47 49 28 2.3 26 9 — 70 62 58 71 76 Antigua and Barbuda 0.09 12 6 -0 0.1 0.1 16 1.5 24 7 22,220 24 — — 74 80 Bahamas 0.4 14 6 4 0.4 0.5 14 1.8 26 6 22,930 83 — — 72 78 Barbados 0.3 12 9 2 0.3 0.3 12 1.7 19 14 15,930 32 59 55 73 78 Cuba 11.2 11 9 -2 11.1 10.2 4.2 1.7 16 14 — 77 74 72 78 82 Curaçao 0.2 12 9 10 0.2 0.2 10.2 1.9 19 16 — 89 — — 75 81 Dominica 0.07 14 9 -1 0.08 0.07 20 2.1 22 10 10,420 70 — — 72 77 Dominican Republic 10.6 20 6 -3 12.1 13.2 31 2.4 30 7 13,570 79 70 68 71 77 Grenada 0.1 17 8 -2 0.1 0.1 15 2.1 26 7 12,520 36 — — 74 79 Guadeloupe 0.4 12 8 -1 0.4 0.4 8.8 2.2 22 15 — 98 — — 76 83 Haiti 11.1 26 8 -3 13.3 16.2 42 3.2 35 4 1,760 59 34 31 61 65 Jamaica 2.7 14 6 -5 2.8 2.6 17 2.0 24 9 8,860 55 72 68 73 78 Martinique 0.4 12 9 -3 0.4 0.3 7 2.1 18 18 — 89 — — 78 84 Puerto Rico 3.4 10 9 -19 3.4 3.1 7.0 1.4 17 18 24,030 99 84 72 76 83 St. Kitts-Nevis 0.05 14 8 7 0.06 0.07 13 1.8 21 8 23,700 32 — — 73 78 Saint Lucia 0.2 12 6 2 0.2 0.2 18 1.5 22 9 10,820 18 56 52 75 82 Population mid-2016 (millions) Births per 1,000 Population Deaths per 1,000 Population Net Migration Rate per 1,000 Population Infant Mortality Ratea Total Fertility Rateb Percent of Population GNI per Capita ($US) Percent Urban Percent of Married Women 15-49 Using Contraceptionc Life Expectancy at Birth (years) Ma Dea 100,0 mid-2030 (millions) mid-2050 (millions) Ages 15 Ages 65+ 2015 All Methods Modern Methods Males Females 2 WORLD 7,418 20 8 — 8,539 9,869 36 2.5 26 8 15,415 54 62 56 70 74 MORE DEVELOPED 1,254 11 10 3 1,298 1,322 5 1.7 16 18 39,963 78 70 62 76 82 LESS DEVELOPED 6,164 22 7 -0 7,241 8,548 39 2.6 28 7 10,214 49 61 55 68 72 LESS DEVELOPED (Excl. China) 4,778 24 7 -0 5,821 7,195 43 2.9 31 5 8,936 47 54 46 67 70 LEAST DEVELOPED 962 33 9 -1 1,318 1,923 59 4.3 41 4 2,424 32 36 32 61 64 AFRICA 1,203 36 10 -1 1,681 2,527 57 4.7 41 4 4,802 41 35 30 59 62 SUB-SAHARAN AFRICA 974 37 11 -0 1,388 2,128 62 5.0 43 3 3,606 39 31 26 57 59 NORTHERN AFRICA 229 29 6 -1 293 400 29 3.4 32 5 9,798 51 52 46 69 73 Algeria 40.8 26 5 0 50.6 63.2 21 3.1 29 6 14,280 71 57 48 73 78 Egypt 93.5 31 6 -1 121.6 168.8 22 3.5 31 4 10,690 43 58 57 70 73 Libya 6.3 20 5 -10 7.4 8.4 23 2.4 30 5 15,140 79 42 20 69 75 Morocco 34.7 20 6 -2 38.1 38.8 24 2.4 25 6 7,680 60 67 57 73 75 Sudan 42.1 37 8 -3 61.7 105.0 51 5.2 43 3 4,080 34 12 12 61 64 Tunisia 11.3 20 7 -1 13.1 14.9 17 2.4 24 8 11,060 68 62 50 73 77 Western Saharae 0.6 18 6 8 0.7 0.9 35 2.1 26 3 — 81 — — 67 71 WESTERN AFRICA 359 39 11 -1 515 800 64 5.4 44 3 4,135 45 18 13 55 56 Benin 10.8 36 9 -0 16.6 24.0 66 4.7 45 3 2,100 44 18 12 58 61 Burkina Faso 19.0 41 10 -1 28.2 47.0 65 5.7 49 3 1,640 30 21 20 57 60 Cape Verde 0.5 21 5 -4 0.6 0.7 19 2.3 28 6 6,390 66 61 57 71 80 Côte d’Ivoire 23.9 37 13 0 33.0 50.1 69 4.9 42 3 3,240 54 18 12 51 53 Gambia 2.1 41 9 -1 3.2 5.1 45 5.6 46 2 1,580 60 9 8 59 62 Ghana 28.2 33 8 -1 37.1 50.4 41 4.2 39 5 4,070 54 35 29 60 63 Guinea 11.2 37 10 -0 18.3 27.5 67 5.1 43 3 1,120 37 6 5 58 59 Guinea-Bissau 1.9 37 12 -1 2.5 3.6 88 4.9 43 3 1,450 49 16 14 54 57 Liberia 4.6 35 9 -1 6.4 9.4 54 4.7 42 3 720 50 20 19 60 62 Mali 17.3 44 13 -3 26.1 43.6 56 6.0 47 3 2,360 40 16 15 54 54 Mauritania 4.2 31 8 -1 5.7 8.0 72 4.2 40 3 3,710 60 11 10 62 65 Niger 19.7 49 9 -0 34.3 68.9 56 7.6 50 3 950 22 14 12 61 62 Nigeria 186.5 39 13 -0 261.9 397.5 69 5.5 43 3 5,800 48 15 10 53 53 Senegal 14.8 38 6 -1 21.6 34.4 39 5.0 44 4 2,390 45 23 21 65 68 Sierra Leone 6.6 37 14 -1 8.9 12.6 89 4.9 42 3 1,560 40 17 16 50 52 1, Togo 7.5 36 9 -0 10.9 17.4 47 4.7 42 3 1,320 38 20 17 59 61 EASTERN AFRICA 394 36 9 -1 561 844 51 4.8 43 3 2,019 26 40 37 60 64 Burundi 11.1 42 10 0 17.2 30.4 63 6.1 46 2 730 12 32 30 58 61 Comoros 0.8 33 7 -3 1.0 1.4 36 4.3 40 3 1,430 28 19 14 62 65 Djibouti 0.9 25 9 -3 1.1 1.2 53 3.2 33 4 — 77 19 18 60 64 Eritrea 5.4 34 7 -5 7.3 10.4 43 4.2 43 3 — 23 8 7 62 66 Ethiopia 101.7 30 7 -0 132.9 168.6 47 4.2 41 3 1,620 20 37 36 62 66 Kenya 45.4 31 7 -0 63.7 88.2 39 3.9 42 3 3,060 26 66 63 60 65 Madagascar 23.7 33 7 0 32.9 47.1 36 4.3 41 3 1,400 35 40 33 64 67 Malawi 17.2 34 10 -0 23.4 32.2 42 4.4 40 4 1,140 16 59 58 62 64 Mauritius 1.3 10 8 -1 1.2 1.1 13.6 1.4 20 9 19,290 41 76 39 71 78 Mayotte 0.2 33 3 -0 0.3 0.5 4 4.0 44 3 — 47 — — 75 78 Mozambique 27.2 45 14 0 41.9 74.4 81 5.9 45 3 1,170 32 12 11 52 56 Reunion 0.8 17 5 -7 1.0 1.1 7 2.5 24 10 — 95 67 64 77 84 Rwanda 11.9 34 7 -1 16.4 23.6 32 4.2 41 3 1,720 29 53 48 62 66 Seychelles 0.09 17 7 1 0.1 0.1 13.4 2.4 22 8 25,760 54 — — 70 79 Somalia 11.1 44 12 -6 16.5 27.0 76 6.4 47 3 — 40 15 1 54 57 South Sudan 12.7 37 12 10 17.8 25.9 74 6.7 42 3 1,630 19 4 1 55 57 Tanzania 54.2 37 7 -1 81.5 134.8 43 5.2 45 3 2,620 30 38 32 64 66 Uganda 36.6 43 10 -4 58.1 101.5 53 5.8 48 3 1,780 20 34 30 62 64 Zambia 15.9 43 13 -0 24.1 41.0 52 5.3 46 3 3,700 40 49 45 51 56 POPULATION, HEALTH, AND ENVIRONMENT DATA AND ESTIMATES FOR THE COUNTRIES AND REGIONS OF THE WORLD
  • 12. © 2016 Population Reference Bureau See notes on page 20 2016 WORLD POPULATION DATA SHEET 12 Barbados 0.3 12 9 2 0.3 0.3 12 1.7 19 14 15,930 32 59 55 73 78 Cuba 11.2 11 9 -2 11.1 10.2 4.2 1.7 16 14 — 77 74 72 78 82 Curaçao 0.2 12 9 10 0.2 0.2 10.2 1.9 19 16 — 89 — — 75 81 Dominica 0.07 14 9 -1 0.08 0.07 20 2.1 22 10 10,420 70 — — 72 77 Dominican Republic 10.6 20 6 -3 12.1 13.2 31 2.4 30 7 13,570 79 70 68 71 77 Grenada 0.1 17 8 -2 0.1 0.1 15 2.1 26 7 12,520 36 — — 74 79 Guadeloupe 0.4 12 8 -1 0.4 0.4 8.8 2.2 22 15 — 98 — — 76 83 Haiti 11.1 26 8 -3 13.3 16.2 42 3.2 35 4 1,760 59 34 31 61 65 Jamaica 2.7 14 6 -5 2.8 2.6 17 2.0 24 9 8,860 55 72 68 73 78 Martinique 0.4 12 9 -3 0.4 0.3 7 2.1 18 18 — 89 — — 78 84 Puerto Rico 3.4 10 9 -19 3.4 3.1 7.0 1.4 17 18 24,030 99 84 72 76 83 St. Kitts-Nevis 0.05 14 8 7 0.06 0.07 13 1.8 21 8 23,700 32 — — 73 78 Saint Lucia 0.2 12 6 2 0.2 0.2 18 1.5 22 9 10,820 18 56 52 75 82 St. Vincent and the Grenadines 0.1 16 7 -8 0.1 0.1 20 2.0 25 7 11,000 51 — — 71 75 Trinidad and Tobago 1.4 14 8 -1 1.4 1.3 13 1.7 21 9 29,630 8 42 38 71 78 SOUTH AMERICA 419 16 6 -0 465 494 17 2.1 25 8 14,628 83 75 69 72 79 Argentina 43.6 18 8 1 49.1 55.2 10.8 2.3 25 11 — 92 55 53 73 80 Bolivia 11.0 24 6 -2 13.3 16.5 36 3.0 33 5 6,840 68 61 35 68 74 Brazil 206.1 14 6 0 223.1 226.3 18 1.8 23 8 15,020 86 80 77 72 79 Chile 18.2 14 6 2 20.3 21.7 7.4 1.8 20 11 21,740 83 64 — 77 82 Colombia 48.8 16 6 -1 53.3 55.0 15 2.3 27 7 13,520 76 79 73 72 79 Ecuador 16.5 21 5 -0 19.7 23.2 20 2.5 29 7 11,190 64 73 60 73 79 French Guiana 0.3 26 3 -2 0.4 0.6 9 3.5 34 5 — 84 — — 77 83 Guyana 0.8 20 8 -7 0.8 0.8 32 2.6 29 5 7,520 29 34 33 64 69 Paraguay 7.0 22 6 -3 8.2 9.3 28 2.6 32 5 8,670 60 79 70 71 75 Peru 31.5 20 6 -1 35.9 40.1 17 2.5 28 7 11,960 79 75 52 72 77 Suriname 0.5 18 7 -2 0.6 0.7 17 2.3 27 7 16,870 66 48 47 68 74 Uruguay 3.5 14 10 -1 3.6 3.7 9.3 1.9 21 14 20,360 95 77 75 74 81 Venezuela 31.0 20 5 -2 36.1 40.5 12.8 2.4 28 6 17,730 89 70 62 72 78 ASIA 4,437 18 7 -0 4,946 5,327 31 2.1 25 8 11,969 48 65 59 71 74 ASIA (Excl. China) 3,051 21 7 0 3,527 3,974 37 2.4 28 7 10,800 44 56 48 69 72 WESTERN ASIA 261 22 5 3 320 386 22 2.8 29 5 25,602 70 54 38 71 76 Armenia 3.0 14 9 -1 2.8 2.4 9 1.6 19 11 8,720 64 55 27 72 78 Azerbaijan 9.8 17 6 0 10.6 10.8 10 2.1 22 6 17,140 53 51 14 72 77 Bahrain 1.4 16 2 3 1.7 1.9 8 2.1 17 2 39,140 100 62 31 76 78 Cyprus 1.2 12 6 -12 1.3 1.4 5 1.4 17 12 30,840 67 — — 78 82 Georgia 4.0 13 11 -1 3.7 3.1 9 1.7 17 14 9,410 54 53 35 71 79 Iraq 38.1 32 4 2 53.4 76.5 37 4.2 40 3 14,850 70 52 34 67 72 Israel 8.2 21 5 1 10.3 13.8 3.1 3.1 28 11 34,940 92 — — 80 84 Jordan 8.2 27 4 -13 9.0 11.4 16 3.5 37 3 10,740 84 61 42 73 76 Kuwait 4.0 17 2 22 5.0 6.0 7 2.2 22 2 79,970 98 52 39 74 76 Lebanon 6.2 15 5 -1 5.5 5.6 8 1.7 25 7 14,120 88 58 34 76 78 Oman 4.4 21 2 39 5.1 6.0 8 2.9 21 3 37,340 75 30 19 75 78 Palestinian Territory 4.8 32 4 -2 6.5 8.8 18 4.1 40 3 5,070 75 57 44 71 75 Qatar 2.5 12 1 75 3.0 3.5 7 2.0 15 1 140,720 99 38 34 77 80 Saudi Arabia 31.7 22 4 3 39.9 50.0 15 2.8 30 3 54,730 83 24 — 73 75 Syria 17.2 22 4 -20 26.1 31.2 16 2.7 32 4 — 58 54 38 64 77 Turkey 79.5 17 5 7 88.4 93.5 11 2.1 24 8 19,360 73 74 47 75 79 United Arab Emirates 9.3 11 2 8 11.0 12.8 6 1.8 14 1 70,570 86 28 24 76 79 Yemen 27.5 33 7 -1 36.3 47.1 43 4.2 40 3 3,660 35 34 29 63 67 SOUTH CENTRAL ASIA 1,929 23 7 -0 2,254 2,563 43 2.5 30 5 6,326 35 54 46 67 70 CENTRAL ASIA 70 24 6 -1 82 96 32 2.7 29 5 10,898 40 54 50 68 75 Kazakhstan 17.8 23 8 -1 20.5 24.7 9 2.6 25 7 24,260 53 51 50 68 77 Kyrgyzstan 6.1 28 6 -1 8.2 11.6 20 3.8 33 4 3,300 36 42 40 67 74 Tajikistan 8.6 31 6 -3 11.1 14.2 38 3.6 35 3 3,320 26 28 26 66 73 Turkmenistan 5.4 21 8 -1 6.2 6.6 45 2.2 28 4 15,760 50 48 46 62 70 Uzbekistan 31.9 23 5 -1 36.2 39.0 43 2.5 29 5 6,110 36 65 59 71 76 SOUTH ASIA 1,859 23 7 -0 2,172 2,467 43 2.5 30 5 6,155 35 54 46 67 70 Afghanistan 33.4 37 8 1 45.5 62.4 68 5.3 44 2 1,990 27 22 20 59 62 Bangladesh 162.9 20 5 -2 186.5 202.2 38 2.3 33 6 3,550 34 62 54 71 73 Bhutan 0.8 19 6 2 0.9 1.0 44 2.1 31 5 7,610 39 66 65 69 70 India 1,328.9 22 7 0 1,530.0 1,708.0 40 2.3 29 6 6,020 33 54 47 67 70 Population mid-2016 (millions) Births per 1,000 Population Deaths per 1,000 Population Net Migration Rate per 1,000 Population Infant Mortality Ratea Total Fertility Rateb Percent of Population GNI per Capita ($US) Percent Urban Percent of Married Women 15-49 Using Contraceptionc Life Expectancy at Birth (years) Ma Dea 100,0 mid-2030 (millions) mid-2050 (millions) Ages 15 Ages 65+ 2015 All Methods Modern Methods Males Females 2 WORLD 7,418 20 8 — 8,539 9,869 36 2.5 26 8 15,415 54 62 56 70 74 MORE DEVELOPED 1,254 11 10 3 1,298 1,322 5 1.7 16 18 39,963 78 70 62 76 82 LESS DEVELOPED 6,164 22 7 -0 7,241 8,548 39 2.6 28 7 10,214 49 61 55 68 72 LESS DEVELOPED (Excl. China) 4,778 24 7 -0 5,821 7,195 43 2.9 31 5 8,936 47 54 46 67 70 LEAST DEVELOPED 962 33 9 -1 1,318 1,923 59 4.3 41 4 2,424 32 36 32 61 64 AFRICA 1,203 36 10 -1 1,681 2,527 57 4.7 41 4 4,802 41 35 30 59 62 SUB-SAHARAN AFRICA 974 37 11 -0 1,388 2,128 62 5.0 43 3 3,606 39 31 26 57 59 NORTHERN AFRICA 229 29 6 -1 293 400 29 3.4 32 5 9,798 51 52 46 69 73 Algeria 40.8 26 5 0 50.6 63.2 21 3.1 29 6 14,280 71 57 48 73 78 Egypt 93.5 31 6 -1 121.6 168.8 22 3.5 31 4 10,690 43 58 57 70 73 Libya 6.3 20 5 -10 7.4 8.4 23 2.4 30 5 15,140 79 42 20 69 75 Morocco 34.7 20 6 -2 38.1 38.8 24 2.4 25 6 7,680 60 67 57 73 75 Sudan 42.1 37 8 -3 61.7 105.0 51 5.2 43 3 4,080 34 12 12 61 64 Tunisia 11.3 20 7 -1 13.1 14.9 17 2.4 24 8 11,060 68 62 50 73 77 Western Saharae 0.6 18 6 8 0.7 0.9 35 2.1 26 3 — 81 — — 67 71 WESTERN AFRICA 359 39 11 -1 515 800 64 5.4 44 3 4,135 45 18 13 55 56 Benin 10.8 36 9 -0 16.6 24.0 66 4.7 45 3 2,100 44 18 12 58 61 Burkina Faso 19.0 41 10 -1 28.2 47.0 65 5.7 49 3 1,640 30 21 20 57 60 Cape Verde 0.5 21 5 -4 0.6 0.7 19 2.3 28 6 6,390 66 61 57 71 80 Côte d’Ivoire 23.9 37 13 0 33.0 50.1 69 4.9 42 3 3,240 54 18 12 51 53 Gambia 2.1 41 9 -1 3.2 5.1 45 5.6 46 2 1,580 60 9 8 59 62 Ghana 28.2 33 8 -1 37.1 50.4 41 4.2 39 5 4,070 54 35 29 60 63 Guinea 11.2 37 10 -0 18.3 27.5 67 5.1 43 3 1,120 37 6 5 58 59 Guinea-Bissau 1.9 37 12 -1 2.5 3.6 88 4.9 43 3 1,450 49 16 14 54 57 Liberia 4.6 35 9 -1 6.4 9.4 54 4.7 42 3 720 50 20 19 60 62 Mali 17.3 44 13 -3 26.1 43.6 56 6.0 47 3 2,360 40 16 15 54 54 Mauritania 4.2 31 8 -1 5.7 8.0 72 4.2 40 3 3,710 60 11 10 62 65 Niger 19.7 49 9 -0 34.3 68.9 56 7.6 50 3 950 22 14 12 61 62 Nigeria 186.5 39 13 -0 261.9 397.5 69 5.5 43 3 5,800 48 15 10 53 53 Senegal 14.8 38 6 -1 21.6 34.4 39 5.0 44 4 2,390 45 23 21 65 68 Sierra Leone 6.6 37 14 -1 8.9 12.6 89 4.9 42 3 1,560 40 17 16 50 52 1, Togo 7.5 36 9 -0 10.9 17.4 47 4.7 42 3 1,320 38 20 17 59 61 EASTERN AFRICA 394 36 9 -1 561 844 51 4.8 43 3 2,019 26 40 37 60 64 Burundi 11.1 42 10 0 17.2 30.4 63 6.1 46 2 730 12 32 30 58 61 Comoros 0.8 33 7 -3 1.0 1.4 36 4.3 40 3 1,430 28 19 14 62 65 Djibouti 0.9 25 9 -3 1.1 1.2 53 3.2 33 4 — 77 19 18 60 64 Eritrea 5.4 34 7 -5 7.3 10.4 43 4.2 43 3 — 23 8 7 62 66 Ethiopia 101.7 30 7 -0 132.9 168.6 47 4.2 41 3 1,620 20 37 36 62 66 Kenya 45.4 31 7 -0 63.7 88.2 39 3.9 42 3 3,060 26 66 63 60 65 Madagascar 23.7 33 7 0 32.9 47.1 36 4.3 41 3 1,400 35 40 33 64 67 Malawi 17.2 34 10 -0 23.4 32.2 42 4.4 40 4 1,140 16 59 58 62 64 Mauritius 1.3 10 8 -1 1.2 1.1 13.6 1.4 20 9 19,290 41 76 39 71 78 Mayotte 0.2 33 3 -0 0.3 0.5 4 4.0 44 3 — 47 — — 75 78 Mozambique 27.2 45 14 0 41.9 74.4 81 5.9 45 3 1,170 32 12 11 52 56 Reunion 0.8 17 5 -7 1.0 1.1 7 2.5 24 10 — 95 67 64 77 84 Rwanda 11.9 34 7 -1 16.4 23.6 32 4.2 41 3 1,720 29 53 48 62 66 Seychelles 0.09 17 7 1 0.1 0.1 13.4 2.4 22 8 25,760 54 — — 70 79 Somalia 11.1 44 12 -6 16.5 27.0 76 6.4 47 3 — 40 15 1 54 57 South Sudan 12.7 37 12 10 17.8 25.9 74 6.7 42 3 1,630 19 4 1 55 57 Tanzania 54.2 37 7 -1 81.5 134.8 43 5.2 45 3 2,620 30 38 32 64 66 Uganda 36.6 43 10 -4 58.1 101.5 53 5.8 48 3 1,780 20 34 30 62 64 Zambia 15.9 43 13 -0 24.1 41.0 52 5.3 46 3 3,700 40 49 45 51 56 POPULATION, HEALTH, AND ENVIRONMENT DATA AND ESTIMATES FOR THE COUNTRIES AND REGIONS OF THE WORLD
  • 13. © 2016 Population Reference Bureau See notes on page 20 2016 WORLD POPULATION DATA SHEET 13 Yemen 27.5 33 7 -1 36.3 47.1 43 4.2 40 3 3,660 35 34 29 63 67 SOUTH CENTRAL ASIA 1,929 23 7 -0 2,254 2,563 43 2.5 30 5 6,326 35 54 46 67 70 CENTRAL ASIA 70 24 6 -1 82 96 32 2.7 29 5 10,898 40 54 50 68 75 Kazakhstan 17.8 23 8 -1 20.5 24.7 9 2.6 25 7 24,260 53 51 50 68 77 Kyrgyzstan 6.1 28 6 -1 8.2 11.6 20 3.8 33 4 3,300 36 42 40 67 74 Tajikistan 8.6 31 6 -3 11.1 14.2 38 3.6 35 3 3,320 26 28 26 66 73 Turkmenistan 5.4 21 8 -1 6.2 6.6 45 2.2 28 4 15,760 50 48 46 62 70 Uzbekistan 31.9 23 5 -1 36.2 39.0 43 2.5 29 5 6,110 36 65 59 71 76 SOUTH ASIA 1,859 23 7 -0 2,172 2,467 43 2.5 30 5 6,155 35 54 46 67 70 Afghanistan 33.4 37 8 1 45.5 62.4 68 5.3 44 2 1,990 27 22 20 59 62 Bangladesh 162.9 20 5 -2 186.5 202.2 38 2.3 33 6 3,550 34 62 54 71 73 Bhutan 0.8 19 6 2 0.9 1.0 44 2.1 31 5 7,610 39 66 65 69 70 India 1,328.9 22 7 0 1,530.0 1,708.0 40 2.3 29 6 6,020 33 54 47 67 70 Iran 79.5 19 5 -1 87.9 91.6 14 1.8 24 5 17,400 72 77 57 74 77 Maldives 0.4 18 3 1 0.5 0.6 8 2.5 27 5 11,310 46 35 27 76 78 Nepal 28.4 22 7 -1 33.3 36.4 33 2.3 31 6 2,500 20 50 47 66 69 Pakistan 203.4 30 7 -1 265.6 344.0 67 3.7 36 4 5,350 39 35 26 66 67 Sri Lanka 21.2 16 6 -4 21.9 21.2 8 2.1 25 8 11,480 18 68 52 72 78 SOUTHEAST ASIA 633 19 7 -0 730 824 27 2.4 27 6 11,298 48 62 54 68 73 Brunei 0.4 16 3 2 0.5 0.5 8 1.9 23 4 — 77 — — 77 81 Cambodia 15.8 24 6 -2 19.0 22.5 26 2.6 32 4 3,290 21 56 39 61 66 Indonesia 259.4 20 7 -1 305.7 359.8 30 2.5 28 5 10,680 54 61 60 69 73 Laos 7.1 26 7 -3 8.7 10.4 55 3.0 35 4 5,380 39 50 42 65 68 Malaysia 30.8 17 5 2 36.1 40.7 6 2.0 25 6 26,140 75 49 32 72 77 Myanmar 52.4 19 8 -1 58.1 61.3 61 2.3 28 5 — 34 46 46 64 68 Philippines 102.6 23 7 -1 124.0 148.7 22 2.8 32 5 8,900 44 55 38 65 72 Singapore 5.6 8 4 8 6.3 6.6 1.7 1.2 15 12 81,190 100 62 55 80 85 Thailand 65.3 12 8 -1 66.8 63.3 10 1.6 18 11 15,210 50 79 77 72 79 Timor-Leste 1.3 37 7 -9 1.6 2.3 45 5.7 42 6 3,820 33 22 21 67 70 Vietnam 92.7 16 7 1 103.2 108.2 15 2.1 24 7 5,690 34 76 57 71 76 EAST ASIA 1,614 12 7 -0 1,643 1,554 10 1.6 17 12 17,048 60 82 81 75 79 China 1,378.0 12 7 -0 1,411.2 1,343.9 11 1.6 17 10 14,160 56 85 84 75 78 China, Hong Kong SARf 7.4 8 6 6 8.0 8.2 1.4 1.2 11 16 57,650 100 75 72 81 87 China, Macao SARf 0.7 11 3 9 0.7 0.8 2 1.1 12 9 120,890 100 — — 80 86 Japan 125.3 8 10 0 116.7 100.6 1.9 1.5 13 27 38,870 94 54 44 80 87 Korea, North 25.1 15 9 -0 26.7 27.0 25 2.0 21 10 — 61 71 65 66 74 Korea, South 50.8 9 5 0 52.2 48.1 3.0 1.2 14 14 34,700 82 80 70 79 86 Mongolia 3.1 27 6 0 3.8 4.6 15 3.1 27 4 11,070 67 55 48 65 75 Taiwan 23.5 9 7 0 23.3 20.5 4.0 1.2 14 13 — 77 71 — 77 83 EUROPE 740 11 11 2 744 728 5 1.6 16 17 32,614 74 71 61 75 81 EUROPEAN UNION 506 10 10 3 518 515 4 1.6 16 19 37,646 75 72 65 78 83 NORTHERN EUROPE 103 12 9 3 112 120 4 1.8 18 17 42,265 81 81 78 79 83 Channel Islands 0.2 10 8 4 0.2 0.2 2.9 1.6 15 16 — 32 — — 80 85 Denmark 5.7 10 9 9 6.2 6.3 3.5 1.7 17 19 47,810 88 — — 79 82 Estonia 1.3 11 12 2 1.3 1.2 2.4 1.6 16 19 27,510 69 63 58 72 82 Finland 5.5 10 10 2 5.8 5.9 1.7 1.6 16 20 40,840 84 77 75 78 85 Iceland 0.3 12 7 3 0.4 0.4 2.0 1.8 20 14 46,120 94 — — 81 84 Ireland 4.7 14 6 -3 5.1 5.7 3.1 1.9 22 13 46,410 63 65 61 79 83 Latvia 2.0 11 14 -4 1.6 1.5 4.2 1.6 15 19 24,220 68 68 56 69 80 Lithuania 2.9 11 14 -8 2.7 2.4 4.1 1.6 15 19 26,660 67 63 50 69 80 Norway 5.2 11 8 6 5.9 6.6 2.4 1.7 18 16 64,590 81 88 82 80 84 Sweden 9.9 12 9 8 11.5 12.6 2.5 1.8 17 20 47,390 86 75 65 80 84 United Kingdom 65.6 12 9 3 71.0 77.0 3.9 1.8 18 17 40,550 83 84 84 79 83 WESTERN EUROPE 193 10 10 8 201 205 3 1.7 16 19 46,052 79 71 68 79 84 Austria 8.8 10 10 13 9.2 9.7 3.0 1.5 14 18 47,510 66 70 68 79 84 Belgium 11.3 11 10 4 12.0 12.8 3.5 1.7 17 18 44,100 98 70 69 79 84 France 64.6 12 9 1 68.5 72.3 3.5 1.9 18 18 40,470 80 76 74 79 85 Germany 82.6 9 11 14 83.3 81.0 3.3 1.5 13 21 48,260 75 66 62 78 83 Liechtenstein 0.04 10 7 4 0.04 0.04 3.3 1.6 15 16 — 14 — — 81 84 Luxembourg 0.6 11 7 20 0.7 0.7 3.2 1.5 16 14 70,750 90 — — 80 85 Monaco 0.04 7 6 21 0.04 0.05 — 1.5 13 24 — 100 — — — — Netherlands 17.0 10 9 3 17.8 18.1 3.6 1.7 17 18 48,400 90 69 67 80 83 Switzerland 8.4 10 8 9 9.5 10.3 3.9 1.5 15 18 61,930 84 82 78 81 85 Population mid-2016 (millions) Births per 1,000 Population Deaths per 1,000 Population Net Migration Rate per 1,000 Population Infant Mortality Ratea Total Fertility Rateb Percent of Population GNI per Capita ($US) Percent Urban Percent of Married Women 15-49 Using Contraceptionc Life Expectancy at Birth (years) Ma Dea 100,0 mid-2030 (millions) mid-2050 (millions) Ages 15 Ages 65+ 2015 All Methods Modern Methods Males Females 2 WORLD 7,418 20 8 — 8,539 9,869 36 2.5 26 8 15,415 54 62 56 70 74 MORE DEVELOPED 1,254 11 10 3 1,298 1,322 5 1.7 16 18 39,963 78 70 62 76 82 LESS DEVELOPED 6,164 22 7 -0 7,241 8,548 39 2.6 28 7 10,214 49 61 55 68 72 LESS DEVELOPED (Excl. China) 4,778 24 7 -0 5,821 7,195 43 2.9 31 5 8,936 47 54 46 67 70 LEAST DEVELOPED 962 33 9 -1 1,318 1,923 59 4.3 41 4 2,424 32 36 32 61 64 AFRICA 1,203 36 10 -1 1,681 2,527 57 4.7 41 4 4,802 41 35 30 59 62 SUB-SAHARAN AFRICA 974 37 11 -0 1,388 2,128 62 5.0 43 3 3,606 39 31 26 57 59 NORTHERN AFRICA 229 29 6 -1 293 400 29 3.4 32 5 9,798 51 52 46 69 73 Algeria 40.8 26 5 0 50.6 63.2 21 3.1 29 6 14,280 71 57 48 73 78 Egypt 93.5 31 6 -1 121.6 168.8 22 3.5 31 4 10,690 43 58 57 70 73 Libya 6.3 20 5 -10 7.4 8.4 23 2.4 30 5 15,140 79 42 20 69 75 Morocco 34.7 20 6 -2 38.1 38.8 24 2.4 25 6 7,680 60 67 57 73 75 Sudan 42.1 37 8 -3 61.7 105.0 51 5.2 43 3 4,080 34 12 12 61 64 Tunisia 11.3 20 7 -1 13.1 14.9 17 2.4 24 8 11,060 68 62 50 73 77 Western Saharae 0.6 18 6 8 0.7 0.9 35 2.1 26 3 — 81 — — 67 71 WESTERN AFRICA 359 39 11 -1 515 800 64 5.4 44 3 4,135 45 18 13 55 56 Benin 10.8 36 9 -0 16.6 24.0 66 4.7 45 3 2,100 44 18 12 58 61 Burkina Faso 19.0 41 10 -1 28.2 47.0 65 5.7 49 3 1,640 30 21 20 57 60 Cape Verde 0.5 21 5 -4 0.6 0.7 19 2.3 28 6 6,390 66 61 57 71 80 Côte d’Ivoire 23.9 37 13 0 33.0 50.1 69 4.9 42 3 3,240 54 18 12 51 53 Gambia 2.1 41 9 -1 3.2 5.1 45 5.6 46 2 1,580 60 9 8 59 62 Ghana 28.2 33 8 -1 37.1 50.4 41 4.2 39 5 4,070 54 35 29 60 63 Guinea 11.2 37 10 -0 18.3 27.5 67 5.1 43 3 1,120 37 6 5 58 59 Guinea-Bissau 1.9 37 12 -1 2.5 3.6 88 4.9 43 3 1,450 49 16 14 54 57 Liberia 4.6 35 9 -1 6.4 9.4 54 4.7 42 3 720 50 20 19 60 62 Mali 17.3 44 13 -3 26.1 43.6 56 6.0 47 3 2,360 40 16 15 54 54 Mauritania 4.2 31 8 -1 5.7 8.0 72 4.2 40 3 3,710 60 11 10 62 65 Niger 19.7 49 9 -0 34.3 68.9 56 7.6 50 3 950 22 14 12 61 62 Nigeria 186.5 39 13 -0 261.9 397.5 69 5.5 43 3 5,800 48 15 10 53 53 Senegal 14.8 38 6 -1 21.6 34.4 39 5.0 44 4 2,390 45 23 21 65 68 Sierra Leone 6.6 37 14 -1 8.9 12.6 89 4.9 42 3 1,560 40 17 16 50 52 1, Togo 7.5 36 9 -0 10.9 17.4 47 4.7 42 3 1,320 38 20 17 59 61 EASTERN AFRICA 394 36 9 -1 561 844 51 4.8 43 3 2,019 26 40 37 60 64 Burundi 11.1 42 10 0 17.2 30.4 63 6.1 46 2 730 12 32 30 58 61 Comoros 0.8 33 7 -3 1.0 1.4 36 4.3 40 3 1,430 28 19 14 62 65 Djibouti 0.9 25 9 -3 1.1 1.2 53 3.2 33 4 — 77 19 18 60 64 Eritrea 5.4 34 7 -5 7.3 10.4 43 4.2 43 3 — 23 8 7 62 66 Ethiopia 101.7 30 7 -0 132.9 168.6 47 4.2 41 3 1,620 20 37 36 62 66 Kenya 45.4 31 7 -0 63.7 88.2 39 3.9 42 3 3,060 26 66 63 60 65 Madagascar 23.7 33 7 0 32.9 47.1 36 4.3 41 3 1,400 35 40 33 64 67 Malawi 17.2 34 10 -0 23.4 32.2 42 4.4 40 4 1,140 16 59 58 62 64 Mauritius 1.3 10 8 -1 1.2 1.1 13.6 1.4 20 9 19,290 41 76 39 71 78 Mayotte 0.2 33 3 -0 0.3 0.5 4 4.0 44 3 — 47 — — 75 78 Mozambique 27.2 45 14 0 41.9 74.4 81 5.9 45 3 1,170 32 12 11 52 56 Reunion 0.8 17 5 -7 1.0 1.1 7 2.5 24 10 — 95 67 64 77 84 Rwanda 11.9 34 7 -1 16.4 23.6 32 4.2 41 3 1,720 29 53 48 62 66 Seychelles 0.09 17 7 1 0.1 0.1 13.4 2.4 22 8 25,760 54 — — 70 79 Somalia 11.1 44 12 -6 16.5 27.0 76 6.4 47 3 — 40 15 1 54 57 South Sudan 12.7 37 12 10 17.8 25.9 74 6.7 42 3 1,630 19 4 1 55 57 Tanzania 54.2 37 7 -1 81.5 134.8 43 5.2 45 3 2,620 30 38 32 64 66 Uganda 36.6 43 10 -4 58.1 101.5 53 5.8 48 3 1,780 20 34 30 62 64 Zambia 15.9 43 13 -0 24.1 41.0 52 5.3 46 3 3,700 40 49 45 51 56 POPULATION, HEALTH, AND ENVIRONMENT DATA AND ESTIMATES FOR THE COUNTRIES AND REGIONS OF THE WORLD
  • 14. © 2016 Population Reference Bureau See notes on page 20 2016 WORLD POPULATION DATA SHEET 14 Lithuania 2.9 11 14 -8 2.7 2.4 4.1 1.6 15 19 26,660 67 63 50 69 80 Norway 5.2 11 8 6 5.9 6.6 2.4 1.7 18 16 64,590 81 88 82 80 84 Sweden 9.9 12 9 8 11.5 12.6 2.5 1.8 17 20 47,390 86 75 65 80 84 United Kingdom 65.6 12 9 3 71.0 77.0 3.9 1.8 18 17 40,550 83 84 84 79 83 WESTERN EUROPE 193 10 10 8 201 205 3 1.7 16 19 46,052 79 71 68 79 84 Austria 8.8 10 10 13 9.2 9.7 3.0 1.5 14 18 47,510 66 70 68 79 84 Belgium 11.3 11 10 4 12.0 12.8 3.5 1.7 17 18 44,100 98 70 69 79 84 France 64.6 12 9 1 68.5 72.3 3.5 1.9 18 18 40,470 80 76 74 79 85 Germany 82.6 9 11 14 83.3 81.0 3.3 1.5 13 21 48,260 75 66 62 78 83 Liechtenstein 0.04 10 7 4 0.04 0.04 3.3 1.6 15 16 — 14 — — 81 84 Luxembourg 0.6 11 7 20 0.7 0.7 3.2 1.5 16 14 70,750 90 — — 80 85 Monaco 0.04 7 6 21 0.04 0.05 — 1.5 13 24 — 100 — — — — Netherlands 17.0 10 9 3 17.8 18.1 3.6 1.7 17 18 48,400 90 69 67 80 83 Switzerland 8.4 10 8 9 9.5 10.3 3.9 1.5 15 18 61,930 84 82 78 81 85 EASTERN EUROPE 293 12 13 -1 281 261 6 1.6 16 15 21,212 69 69 57 68 78 Belarus 9.5 13 13 2 9.3 9.1 3.0 1.8 16 14 16,840 78 63 51 68 78 Bulgaria 7.1 9 15 -1 6.6 5.8 6.6 1.5 14 20 16,790 73 69 40 71 78 Czech Republic 10.6 11 11 2 10.8 11.1 2.5 1.6 15 18 30,420 73 86 78 76 82 Hungary 9.8 9 13 -0 9.7 9.4 4.1 1.4 14 18 24,630 71 81 71 72 79 Moldova 3.6 11 11 1 3.4 2.8 10 1.3 16 10 5,350 42 60 42 68 76 Poland 38.4 10 10 -0 37.3 33.9 4.0 1.3 15 16 25,400 60 — — 74 82 Romania 19.8 9 12 -27 17.4 13.9 7.5 1.2 16 15 20,900 55 70 50 72 79 Russiag 144.3 13 13 2 142.6 136.4 6.5 1.8 17 14 23,790 74 68 55 66 77 Slovakia 5.4 10 10 1 5.4 4.9 5.1 1.4 15 14 28,200 54 80 66 73 80 Ukraineg 42.7 10 14 0 39.1 33.6 8.1 1.5 15 16 7,810 70 68 61 66 76 SOUTHERN EUROPE 150 9 10 0 150 143 4 1.4 15 19 30,960 70 66 48 79 84 Albania 2.9 11 8 -6 2.8 2.4 7.1 1.7 18 13 11,140 58 69 10 76 80 Andorra 0.08 9 4 8 0.08 0.07 3.4 1.2 15 14 — 85 — — — — Bosnia-Herzegovina 3.5 8 9 -0 3.3 2.8 6 1.3 15 14 10,610 40 46 12 74 79 Croatia 4.2 9 13 -4 3.9 3.5 5.0 1.5 15 19 21,730 59 — — 74 81 Greece 10.8 8 10 1 10.4 9.2 3.8 1.3 15 19 26,790 78 76 46 78 84 Italy 60.6 8 11 2 63.5 63.5 3.2 1.4 14 22 35,850 69 63 41 80 85 Kosovoh 1.8 17 5 -31 1.8 1.8 12 2.3 24 8 9,840 38 66 14 74 79 Macedoniai 2.1 11 10 0 2.1 1.9 9 1.5 17 13 13,570 57 40 13 73 77 Malta 0.4 10 8 7 0.4 0.4 5.7 1.4 14 18 27,390 95 86 46 80 84 Montenegro 0.6 12 10 -3 0.7 0.7 4.6 1.6 18 14 15,890 64 23 15 74 79 Portugal 10.3 8 11 -1 9.9 9.1 3.0 1.3 14 20 28,590 64 87 82 77 83 San Marino 0.03 8 7 6 0.03 0.03 2.3 1.5 15 18 — 94 — — 84 89 Serbia 7.1 9 15 2 6.4 5.3 4.6 1.5 14 18 12,800 60 58 18 73 78 Slovenia 2.1 10 10 0 2.0 1.9 2.1 1.6 15 18 30,830 50 79 63 78 84 Spain 43.3 9 9 -1 42.4 39.8 2.8 1.3 15 18 34,490 80 66 62 80 85 OCEANIA 40 17 7 7 51 66 20 2.3 24 12 32,456 70 62 58 75 80 Australia 24.1 13 7 9 30.9 41.3 3.4 1.8 19 15 44,570 89 72 68 80 84 Federated States of Micronesia 0.1 23 5 -14 0.1 0.1 29 3.4 34 4 3,600 22 — 70 68 72 Fiji 0.9 18 9 -6 0.9 1.0 14 3.1 29 6 8,700 51 29 — 67 73 French Polynesia 0.3 16 5 -0 0.3 0.3 6.0 2.0 24 7 — 56 — — 75 79 Guam 0.2 21 5 -6 0.2 0.3 9.4 3.0 26 8 — 94 67 58 76 82 Kiribati 0.1 30 8 -3 0.1 0.2 45 3.9 35 4 4,150 54 22 18 63 68 Marshall Islands 0.06 27 4 -17 0.06 0.08 22 4.1 41 2 4,710 74 45 42 71 72 Nauru 0.01 34 8 -8 0.01 0.01 18 3.9 37 13 — 100 36 23 63 70 New Caledonia 0.3 17 5 6 0.3 0.4 4 2.3 24 8 — 70 — — 74 80 New Zealand 4.7 13 7 14 5.3 5.9 4.1 2.0 20 15 35,680 86 75 72 80 83 Palau 0.02 13 9 0 0.02 0.02 12 2.1 20 6 14,700 87 33 30 70 76 Papua New Guinea 8.2 28 8 0 10.5 13.9 46 3.7 39 3 2,800 13 32 24 61 65 Samoa 0.2 28 5 -28 0.2 0.2 15 5.1 38 6 5,720 18 27 24 73 76 Solomon Islands 0.7 30 5 0 0.9 1.2 22 4.0 39 3 2,180 20 35 27 66 73 Tonga 0.1 26 7 -19 0.1 0.1 17 4.1 37 6 5,290 24 34 28 74 78 Tuvalu 0.01 25 9 -3 0.01 0.01 10 3.6 33 5 5,430 60 30 22 67 72 Vanuatu 0.3 32 5 0 0.4 0.6 28 4.2 40 4 3,040 26 49 36 72 75 Population mid-2016 (millions) Births per 1,000 Population Deaths per 1,000 Population Net Migration Rate per 1,000 mid-2030 (millions) mid-2050 (millions) Infant Mortality Ratea Total Fertility Rateb Ages 15 Ages 65+ GNI per Capita ($US) 2015 Percent Urban All Methods Modern Methods Males Females 2 Population Percent of Percent of Married Life Expectancy Ma Population mid-2016 (millions) Births per 1,000 Population Deaths per 1,000 Population Net Migration Rate per 1,000 Population Infant Mortality Ratea Total Fertility Rateb Percent of Population GNI per Capita ($US) Percent Urban Percent of Married Women 15-49 Using Contraceptionc Life Expectancy at Birth (years) Ma Dea 100,0 mid-2030 (millions) mid-2050 (millions) Ages 15 Ages 65+ 2015 All Methods Modern Methods Males Females 2 WORLD 7,418 20 8 — 8,539 9,869 36 2.5 26 8 15,415 54 62 56 70 74 MORE DEVELOPED 1,254 11 10 3 1,298 1,322 5 1.7 16 18 39,963 78 70 62 76 82 LESS DEVELOPED 6,164 22 7 -0 7,241 8,548 39 2.6 28 7 10,214 49 61 55 68 72 LESS DEVELOPED (Excl. China) 4,778 24 7 -0 5,821 7,195 43 2.9 31 5 8,936 47 54 46 67 70 LEAST DEVELOPED 962 33 9 -1 1,318 1,923 59 4.3 41 4 2,424 32 36 32 61 64 AFRICA 1,203 36 10 -1 1,681 2,527 57 4.7 41 4 4,802 41 35 30 59 62 SUB-SAHARAN AFRICA 974 37 11 -0 1,388 2,128 62 5.0 43 3 3,606 39 31 26 57 59 NORTHERN AFRICA 229 29 6 -1 293 400 29 3.4 32 5 9,798 51 52 46 69 73 Algeria 40.8 26 5 0 50.6 63.2 21 3.1 29 6 14,280 71 57 48 73 78 Egypt 93.5 31 6 -1 121.6 168.8 22 3.5 31 4 10,690 43 58 57 70 73 Libya 6.3 20 5 -10 7.4 8.4 23 2.4 30 5 15,140 79 42 20 69 75 Morocco 34.7 20 6 -2 38.1 38.8 24 2.4 25 6 7,680 60 67 57 73 75 Sudan 42.1 37 8 -3 61.7 105.0 51 5.2 43 3 4,080 34 12 12 61 64 Tunisia 11.3 20 7 -1 13.1 14.9 17 2.4 24 8 11,060 68 62 50 73 77 Western Saharae 0.6 18 6 8 0.7 0.9 35 2.1 26 3 — 81 — — 67 71 WESTERN AFRICA 359 39 11 -1 515 800 64 5.4 44 3 4,135 45 18 13 55 56 Benin 10.8 36 9 -0 16.6 24.0 66 4.7 45 3 2,100 44 18 12 58 61 Burkina Faso 19.0 41 10 -1 28.2 47.0 65 5.7 49 3 1,640 30 21 20 57 60 Cape Verde 0.5 21 5 -4 0.6 0.7 19 2.3 28 6 6,390 66 61 57 71 80 Côte d’Ivoire 23.9 37 13 0 33.0 50.1 69 4.9 42 3 3,240 54 18 12 51 53 Gambia 2.1 41 9 -1 3.2 5.1 45 5.6 46 2 1,580 60 9 8 59 62 Ghana 28.2 33 8 -1 37.1 50.4 41 4.2 39 5 4,070 54 35 29 60 63 Guinea 11.2 37 10 -0 18.3 27.5 67 5.1 43 3 1,120 37 6 5 58 59 Guinea-Bissau 1.9 37 12 -1 2.5 3.6 88 4.9 43 3 1,450 49 16 14 54 57 Liberia 4.6 35 9 -1 6.4 9.4 54 4.7 42 3 720 50 20 19 60 62 Mali 17.3 44 13 -3 26.1 43.6 56 6.0 47 3 2,360 40 16 15 54 54 Mauritania 4.2 31 8 -1 5.7 8.0 72 4.2 40 3 3,710 60 11 10 62 65 Niger 19.7 49 9 -0 34.3 68.9 56 7.6 50 3 950 22 14 12 61 62 Nigeria 186.5 39 13 -0 261.9 397.5 69 5.5 43 3 5,800 48 15 10 53 53 Senegal 14.8 38 6 -1 21.6 34.4 39 5.0 44 4 2,390 45 23 21 65 68 Sierra Leone 6.6 37 14 -1 8.9 12.6 89 4.9 42 3 1,560 40 17 16 50 52 1, Togo 7.5 36 9 -0 10.9 17.4 47 4.7 42 3 1,320 38 20 17 59 61 EASTERN AFRICA 394 36 9 -1 561 844 51 4.8 43 3 2,019 26 40 37 60 64 Burundi 11.1 42 10 0 17.2 30.4 63 6.1 46 2 730 12 32 30 58 61 Comoros 0.8 33 7 -3 1.0 1.4 36 4.3 40 3 1,430 28 19 14 62 65 Djibouti 0.9 25 9 -3 1.1 1.2 53 3.2 33 4 — 77 19 18 60 64 Eritrea 5.4 34 7 -5 7.3 10.4 43 4.2 43 3 — 23 8 7 62 66 Ethiopia 101.7 30 7 -0 132.9 168.6 47 4.2 41 3 1,620 20 37 36 62 66 Kenya 45.4 31 7 -0 63.7 88.2 39 3.9 42 3 3,060 26 66 63 60 65 Madagascar 23.7 33 7 0 32.9 47.1 36 4.3 41 3 1,400 35 40 33 64 67 Malawi 17.2 34 10 -0 23.4 32.2 42 4.4 40 4 1,140 16 59 58 62 64 Mauritius 1.3 10 8 -1 1.2 1.1 13.6 1.4 20 9 19,290 41 76 39 71 78 Mayotte 0.2 33 3 -0 0.3 0.5 4 4.0 44 3 — 47 — — 75 78 Mozambique 27.2 45 14 0 41.9 74.4 81 5.9 45 3 1,170 32 12 11 52 56 Reunion 0.8 17 5 -7 1.0 1.1 7 2.5 24 10 — 95 67 64 77 84 Rwanda 11.9 34 7 -1 16.4 23.6 32 4.2 41 3 1,720 29 53 48 62 66 Seychelles 0.09 17 7 1 0.1 0.1 13.4 2.4 22 8 25,760 54 — — 70 79 Somalia 11.1 44 12 -6 16.5 27.0 76 6.4 47 3 — 40 15 1 54 57 South Sudan 12.7 37 12 10 17.8 25.9 74 6.7 42 3 1,630 19 4 1 55 57 Tanzania 54.2 37 7 -1 81.5 134.8 43 5.2 45 3 2,620 30 38 32 64 66 Uganda 36.6 43 10 -4 58.1 101.5 53 5.8 48 3 1,780 20 34 30 62 64 Zambia 15.9 43 13 -0 24.1 41.0 52 5.3 46 3 3,700 40 49 45 51 56 POPULATION, HEALTH, AND ENVIRONMENT DATA AND ESTIMATES FOR THE COUNTRIES AND REGIONS OF THE WORLD
  • 15. © 2016 Population Reference Bureau See notes on page 20 2016 WORLD POPULATION DATA SHEET 15 ercent pulation GNI per Capita ($US) Percent Urban Percent of Married Women 15-49 Using Contraceptionc Life Expectancy at Birth (years) Maternal Deaths per 100,000 Births Percent Ages 15-49 With HIV/AIDS Carbon Emissions (million metric tons) Percent of Population With Access to Electricity Percent of Total Energy Consumption From Renewable Sourcesd Percent of Terrestrial Land Under Protected Area Status Population per Square Kilometer of Arable Land Ages 65+ 2015 All Methods Modern Methods Males Females 2015 Males 2015 Females 2015 1992 2013 2012 2013 2014 8 15,415 54 62 56 70 74 216 — — 6,110 9,776 85 18 15 526 18 39,963 78 70 62 76 82 12 — — 3,730 3,556 100 — 14 238 7 10,214 49 61 55 68 72 239 — — 2,169 5,678 81 — 16 697 5 8,936 47 54 46 67 70 267 — — 1,424 2,870 75 — 15 614 4 2,424 32 36 32 61 64 437 1.6 2.2 20 76 34 — 13 550 4 4,802 41 35 30 59 62 490 3.2 4.7 189 346 45 — 14 514 3 3,606 39 31 26 57 59 557 4.0 6.0 124 209 35 — 16 502 5 9,798 51 52 46 69 73 126 0.1 0.1 66 136 88 — 6 571 6 14,280 71 57 48 73 78 140 0.1 0.1 22.1 36.6 100 0 8 545 4 10,690 43 58 57 70 73 33 0.1 0.1 22.2 58.1 100 5 11 3,415 5 15,140 79 42 20 69 75 9 — — 10.2 13.9 100 2 0 368 6 7,680 60 67 57 73 75 121 0.1 0.1 7.1 16.0 100 11 34 431 3 4,080 34 12 12 61 64 311 0.3 0.2 — 4.2 33 64 2 245 8 11,060 68 62 50 73 77 62 0.1 0.1 4.1 7.5 100 13 5 396 3 — 81 — — 67 71 — — — — — — — 0 — 3 4,135 45 18 13 55 56 674 1.9 2.7 23 41 47 — 13 421 3 2,100 44 18 12 58 61 405 0.9 1.2 0.2 1.6 38 51 28 400 3 1,640 30 21 20 57 60 371 0.6 1.0 0.2 0.8 13 80 15 306 6 6,390 66 61 57 71 80 42 0.9 1.1 0.0 0.1 71 21 3 961 3 3,240 54 18 12 51 53 645 2.5 3.8 1.3 2.5 56 74 23 823 2 1,580 60 9 8 59 62 706 1.4 2.2 0.1 0.1 35 49 4 474 5 4,070 54 35 29 60 63 319 1.3 2.0 1.1 4.0 64 49 15 601 3 1,120 37 6 5 58 59 679 1.2 2.0 0.3 0.6 26 76 29 361 3 1,450 49 16 14 54 57 549 — — 0.0 0.1 61 89 16 629 3 720 50 20 19 60 62 725 0.8 1.4 0.1 0.3 10 89 3 923 3 2,360 40 16 15 54 54 587 1.0 1.5 0.1 0.3 26 84 8 269 3 3,710 60 11 10 62 65 602 0.5 0.6 0.3 0.7 22 33 1 926 3 950 22 14 12 61 62 553 0.4 0.5 0.2 0.5 14 81 18 124 3 5,800 48 15 10 53 53 814 2.5 3.7 17.5 26.1 56 86 14 549 4 2,390 45 23 21 65 68 315 0.4 0.6 0.9 2.3 56 51 25 455 3 1,560 40 17 16 50 52 1,360 1.0 1.6 0.1 0.3 14 80 11 415 3 1,320 38 20 17 59 61 368 1.9 2.9 0.2 0.6 31 73 25 283 3 2,019 26 40 37 60 64 434 — — 11 22 22 — 19 575 2 730 12 32 30 58 61 712 0.8 1.3 0.1 0.1 7 97 7 925 3 1,430 28 19 14 62 65 335 — — 0.0 0.0 69 47 10 1,240 4 — 77 19 18 60 64 229 1.3 1.8 0.1 0.2 53 34 1 44,980 3 — 23 8 7 62 66 501 0.4 0.8 0.2 0.2 36 80 5 776 3 1,620 20 37 36 62 66 353 — — 0.8 2.9 27 93 18 673 3 3,060 26 66 63 60 65 510 4.8 7.0 1.5 3.6 23 79 12 783 3 1,400 35 40 33 64 67 353 0.4 0.3 0.3 0.8 15 79 5 676 4 1,140 16 59 58 62 64 634 7.1 11.1 0.2 0.3 10 79 17 453 9 19,290 41 76 39 71 78 53 1.3 0.5 0.5 1.0 100 3 5 1,685 3 — 47 — — 75 78 — — — — — — — 0 2,665 3 1,170 32 12 11 52 56 489 8.7 12.3 0.3 1.1 20 88 17 481 10 — 95 67 64 77 84 — — — 0.4 1.2 — — 76 2,381 3 1,720 29 53 48 62 66 290 2.3 3.5 0.1 0.2 18 87 9 1,006 8 25,760 54 — — 70 79 — — — 0.0 0.2 100 1 42 117,072 3 — 40 15 1 54 57 732 0.5 0.5 0.0 0.2 33 94 1 1,007 3 1,630 19 4 1 55 57 789 2.0 2.9 — 0.4 5 — 21 — 3 2,620 30 38 32 64 66 398 3.7 5.6 0.6 2.9 15 88 32 402 3 1,780 20 34 30 62 64 343 5.9 8.3 0.2 1.3 18 90 16 530 3 3,700 40 49 45 51 56 224 10.9 15.0 0.7 1.0 22 88 38 431 Population mid-2016 (millions) Births per 1,000 Population Deaths per 1,000 Population Net Migration Rate per 1,000 Population Infant Mortality Ratea Total Fertility Rateb Percent of Population GNI per Capita ($US) Percent Urban Percent of Married Women 15-49 Using Contraceptionc Life Expectancy at Birth (years) Ma Dea 100,0 mid-2030 (millions) mid-2050 (millions) Ages 15 Ages 65+ 2015 All Methods Modern Methods Males Females 2 WORLD 7,418 20 8 — 8,539 9,869 36 2.5 26 8 15,415 54 62 56 70 74 MORE DEVELOPED 1,254 11 10 3 1,298 1,322 5 1.7 16 18 39,963 78 70 62 76 82 LESS DEVELOPED 6,164 22 7 -0 7,241 8,548 39 2.6 28 7 10,214 49 61 55 68 72 LESS DEVELOPED (Excl. China) 4,778 24 7 -0 5,821 7,195 43 2.9 31 5 8,936 47 54 46 67 70 LEAST DEVELOPED 962 33 9 -1 1,318 1,923 59 4.3 41 4 2,424 32 36 32 61 64 AFRICA 1,203 36 10 -1 1,681 2,527 57 4.7 41 4 4,802 41 35 30 59 62 SUB-SAHARAN AFRICA 974 37 11 -0 1,388 2,128 62 5.0 43 3 3,606 39 31 26 57 59 NORTHERN AFRICA 229 29 6 -1 293 400 29 3.4 32 5 9,798 51 52 46 69 73 Algeria 40.8 26 5 0 50.6 63.2 21 3.1 29 6 14,280 71 57 48 73 78 Egypt 93.5 31 6 -1 121.6 168.8 22 3.5 31 4 10,690 43 58 57 70 73 Libya 6.3 20 5 -10 7.4 8.4 23 2.4 30 5 15,140 79 42 20 69 75 Morocco 34.7 20 6 -2 38.1 38.8 24 2.4 25 6 7,680 60 67 57 73 75 Sudan 42.1 37 8 -3 61.7 105.0 51 5.2 43 3 4,080 34 12 12 61 64 Tunisia 11.3 20 7 -1 13.1 14.9 17 2.4 24 8 11,060 68 62 50 73 77 Western Saharae 0.6 18 6 8 0.7 0.9 35 2.1 26 3 — 81 — — 67 71 WESTERN AFRICA 359 39 11 -1 515 800 64 5.4 44 3 4,135 45 18 13 55 56 Benin 10.8 36 9 -0 16.6 24.0 66 4.7 45 3 2,100 44 18 12 58 61 Burkina Faso 19.0 41 10 -1 28.2 47.0 65 5.7 49 3 1,640 30 21 20 57 60 Cape Verde 0.5 21 5 -4 0.6 0.7 19 2.3 28 6 6,390 66 61 57 71 80 Côte d’Ivoire 23.9 37 13 0 33.0 50.1 69 4.9 42 3 3,240 54 18 12 51 53 Gambia 2.1 41 9 -1 3.2 5.1 45 5.6 46 2 1,580 60 9 8 59 62 Ghana 28.2 33 8 -1 37.1 50.4 41 4.2 39 5 4,070 54 35 29 60 63 Guinea 11.2 37 10 -0 18.3 27.5 67 5.1 43 3 1,120 37 6 5 58 59 Guinea-Bissau 1.9 37 12 -1 2.5 3.6 88 4.9 43 3 1,450 49 16 14 54 57 Liberia 4.6 35 9 -1 6.4 9.4 54 4.7 42 3 720 50 20 19 60 62 Mali 17.3 44 13 -3 26.1 43.6 56 6.0 47 3 2,360 40 16 15 54 54 Mauritania 4.2 31 8 -1 5.7 8.0 72 4.2 40 3 3,710 60 11 10 62 65 Niger 19.7 49 9 -0 34.3 68.9 56 7.6 50 3 950 22 14 12 61 62 Nigeria 186.5 39 13 -0 261.9 397.5 69 5.5 43 3 5,800 48 15 10 53 53 Senegal 14.8 38 6 -1 21.6 34.4 39 5.0 44 4 2,390 45 23 21 65 68 Sierra Leone 6.6 37 14 -1 8.9 12.6 89 4.9 42 3 1,560 40 17 16 50 52 1, Togo 7.5 36 9 -0 10.9 17.4 47 4.7 42 3 1,320 38 20 17 59 61 EASTERN AFRICA 394 36 9 -1 561 844 51 4.8 43 3 2,019 26 40 37 60 64 Burundi 11.1 42 10 0 17.2 30.4 63 6.1 46 2 730 12 32 30 58 61 Comoros 0.8 33 7 -3 1.0 1.4 36 4.3 40 3 1,430 28 19 14 62 65 Djibouti 0.9 25 9 -3 1.1 1.2 53 3.2 33 4 — 77 19 18 60 64 Eritrea 5.4 34 7 -5 7.3 10.4 43 4.2 43 3 — 23 8 7 62 66 Ethiopia 101.7 30 7 -0 132.9 168.6 47 4.2 41 3 1,620 20 37 36 62 66 Kenya 45.4 31 7 -0 63.7 88.2 39 3.9 42 3 3,060 26 66 63 60 65 Madagascar 23.7 33 7 0 32.9 47.1 36 4.3 41 3 1,400 35 40 33 64 67 Malawi 17.2 34 10 -0 23.4 32.2 42 4.4 40 4 1,140 16 59 58 62 64 Mauritius 1.3 10 8 -1 1.2 1.1 13.6 1.4 20 9 19,290 41 76 39 71 78 Mayotte 0.2 33 3 -0 0.3 0.5 4 4.0 44 3 — 47 — — 75 78 Mozambique 27.2 45 14 0 41.9 74.4 81 5.9 45 3 1,170 32 12 11 52 56 Reunion 0.8 17 5 -7 1.0 1.1 7 2.5 24 10 — 95 67 64 77 84 Rwanda 11.9 34 7 -1 16.4 23.6 32 4.2 41 3 1,720 29 53 48 62 66 Seychelles 0.09 17 7 1 0.1 0.1 13.4 2.4 22 8 25,760 54 — — 70 79 Somalia 11.1 44 12 -6 16.5 27.0 76 6.4 47 3 — 40 15 1 54 57 South Sudan 12.7 37 12 10 17.8 25.9 74 6.7 42 3 1,630 19 4 1 55 57 Tanzania 54.2 37 7 -1 81.5 134.8 43 5.2 45 3 2,620 30 38 32 64 66 Uganda 36.6 43 10 -4 58.1 101.5 53 5.8 48 3 1,780 20 34 30 62 64 Zambia 15.9 43 13 -0 24.1 41.0 52 5.3 46 3 3,700 40 49 45 51 56 POPULATION, HEALTH, AND ENVIRONMENT DATA AND ESTIMATES FOR THE COUNTRIES AND REGIONS OF THE WORLD ercent pulation GNI per Capita ($US) Percent Urban Percent of Married Women 15-49 Using Contraceptionc Life Expectancy at Birth (years) Maternal Deaths per 100,000 Births Percent Ages 15-49 With HIV/AIDS Carbon Emissions (million metric tons) Percent of Population With Access to Electricity Percent of Total Energy Consumption From Renewable Sourcesd Percent of Terrestrial Land Under Protected Area Status Population per Square Kilometer of Arable Land Ages 65+ 2015 All Methods Modern Methods Males Females 2015 Males 2015 Females 2015 1992 2013 2012 2013 2014 8 15,415 54 62 56 70 74 216 — — 6,110 9,776 85 18 15 526 18 39,963 78 70 62 76 82 12 — — 3,730 3,556 100 — 14 238 7 10,214 49 61 55 68 72 239 — — 2,169 5,678 81 — 16 697 5 8,936 47 54 46 67 70 267 — — 1,424 2,870 75 — 15 614 4 2,424 32 36 32 61 64 437 1.6 2.2 20 76 34 — 13 550 4 4,802 41 35 30 59 62 490 3.2 4.7 189 346 45 — 14 514 3 3,606 39 31 26 57 59 557 4.0 6.0 124 209 35 — 16 502 5 9,798 51 52 46 69 73 126 0.1 0.1 66 136 88 — 6 571 6 14,280 71 57 48 73 78 140 0.1 0.1 22.1 36.6 100 0 8 545 4 10,690 43 58 57 70 73 33 0.1 0.1 22.2 58.1 100 5 11 3,415 5 15,140 79 42 20 69 75 9 — — 10.2 13.9 100 2 0 368 6 7,680 60 67 57 73 75 121 0.1 0.1 7.1 16.0 100 11 34 431 3 4,080 34 12 12 61 64 311 0.3 0.2 — 4.2 33 64 2 245 8 11,060 68 62 50 73 77 62 0.1 0.1 4.1 7.5 100 13 5 396 3 — 81 — — 67 71 — — — — — — — 0 — 3 4,135 45 18 13 55 56 674 1.9 2.7 23 41 47 — 13 421 3 2,100 44 18 12 58 61 405 0.9 1.2 0.2 1.6 38 51 28 400 3 1,640 30 21 20 57 60 371 0.6 1.0 0.2 0.8 13 80 15 306 6 6,390 66 61 57 71 80 42 0.9 1.1 0.0 0.1 71 21 3 961 3 3,240 54 18 12 51 53 645 2.5 3.8 1.3 2.5 56 74 23 823 2 1,580 60 9 8 59 62 706 1.4 2.2 0.1 0.1 35 49 4 474 5 4,070 54 35 29 60 63 319 1.3 2.0 1.1 4.0 64 49 15 601 3 1,120 37 6 5 58 59 679 1.2 2.0 0.3 0.6 26 76 29 361 3 1,450 49 16 14 54 57 549 — — 0.0 0.1 61 89 16 629 3 720 50 20 19 60 62 725 0.8 1.4 0.1 0.3 10 89 3 923 3 2,360 40 16 15 54 54 587 1.0 1.5 0.1 0.3 26 84 8 269 3 3,710 60 11 10 62 65 602 0.5 0.6 0.3 0.7 22 33 1 926 3 950 22 14 12 61 62 553 0.4 0.5 0.2 0.5 14 81 18 124 3 5,800 48 15 10 53 53 814 2.5 3.7 17.5 26.1 56 86 14 549 4 2,390 45 23 21 65 68 315 0.4 0.6 0.9 2.3 56 51 25 455 3 1,560 40 17 16 50 52 1,360 1.0 1.6 0.1 0.3 14 80 11 415 3 1,320 38 20 17 59 61 368 1.9 2.9 0.2 0.6 31 73 25 283 3 2,019 26 40 37 60 64 434 — — 11 22 22 — 19 575 2 730 12 32 30 58 61 712 0.8 1.3 0.1 0.1 7 97 7 925 3 1,430 28 19 14 62 65 335 — — 0.0 0.0 69 47 10 1,240 4 — 77 19 18 60 64 229 1.3 1.8 0.1 0.2 53 34 1 44,980 3 — 23 8 7 62 66 501 0.4 0.8 0.2 0.2 36 80 5 776 3 1,620 20 37 36 62 66 353 — — 0.8 2.9 27 93 18 673 3 3,060 26 66 63 60 65 510 4.8 7.0 1.5 3.6 23 79 12 783 3 1,400 35 40 33 64 67 353 0.4 0.3 0.3 0.8 15 79 5 676 4 1,140 16 59 58 62 64 634 7.1 11.1 0.2 0.3 10 79 17 453 9 19,290 41 76 39 71 78 53 1.3 0.5 0.5 1.0 100 3 5 1,685 3 — 47 — — 75 78 — — — — — — — 0 2,665 3 1,170 32 12 11 52 56 489 8.7 12.3 0.3 1.1 20 88 17 481 10 — 95 67 64 77 84 — — — 0.4 1.2 — — 76 2,381 3 1,720 29 53 48 62 66 290 2.3 3.5 0.1 0.2 18 87 9 1,006 8 25,760 54 — — 70 79 — — — 0.0 0.2 100 1 42 117,072 3 — 40 15 1 54 57 732 0.5 0.5 0.0 0.2 33 94 1 1,007 3 1,630 19 4 1 55 57 789 2.0 2.9 — 0.4 5 — 21 — 3 2,620 30 38 32 64 66 398 3.7 5.6 0.6 2.9 15 88 32 402 3 1,780 20 34 30 62 64 343 5.9 8.3 0.2 1.3 18 90 16 530 3 3,700 40 49 45 51 56 224 10.9 15.0 0.7 1.0 22 88 38 431
  • 16. © 2016 Population Reference Bureau See notes on page 20 2016 WORLD POPULATION DATA SHEET 16 3 1,620 20 37 36 62 66 353 — — 0.8 2.9 27 93 18 673 3 3,060 26 66 63 60 65 510 4.8 7.0 1.5 3.6 23 79 12 783 3 1,400 35 40 33 64 67 353 0.4 0.3 0.3 0.8 15 79 5 676 4 1,140 16 59 58 62 64 634 7.1 11.1 0.2 0.3 10 79 17 453 9 19,290 41 76 39 71 78 53 1.3 0.5 0.5 1.0 100 3 5 1,685 3 — 47 — — 75 78 — — — — — — — 0 2,665 3 1,170 32 12 11 52 56 489 8.7 12.3 0.3 1.1 20 88 17 481 10 — 95 67 64 77 84 — — — 0.4 1.2 — — 76 2,381 3 1,720 29 53 48 62 66 290 2.3 3.5 0.1 0.2 18 87 9 1,006 8 25,760 54 — — 70 79 — — — 0.0 0.2 100 1 42 117,072 3 — 40 15 1 54 57 732 0.5 0.5 0.0 0.2 33 94 1 1,007 3 1,630 19 4 1 55 57 789 2.0 2.9 — 0.4 5 — 21 — 3 2,620 30 38 32 64 66 398 3.7 5.6 0.6 2.9 15 88 32 402 3 1,780 20 34 30 62 64 343 5.9 8.3 0.2 1.3 18 90 16 530 3 3,700 40 49 45 51 56 224 10.9 15.0 0.7 1.0 22 88 38 431 3 1,700 33 66 66 56 59 443 12.1 17.2 4.6 3.8 40 76 27 400 3 2,617 47 21 11 51 54 653 1.6 2.3 5 15 26 — 14 607 2 6,450 62 18 12 51 54 477 1.8 2.6 1.4 8.9 37 57 7 527 3 3,080 54 34 21 56 59 596 3.6 5.3 1.0 1.9 54 78 11 393 4 600 40 15 9 49 53 882 3.0 4.3 0.1 0.1 11 78 18 278 2 2,110 22 6 5 51 53 856 1.6 2.5 0.0 0.2 6 91 18 296 3 6,300 65 30 18 57 60 442 — — 0.4 0.7 42 48 35 882 3 720 42 21 8 49 52 693 0.7 1.0 0.8 0.8 16 96 12 1,124 3 16,450 40 13 10 56 59 342 4.0 5.8 0.1 1.5 66 30 25 725 5 18,810 87 31 19 64 65 291 2.3 5.3 1.3 1.3 89 70 20 543 4 3,160 67 41 37 64 68 156 — — 0.0 0.0 60 43 0 2,279 5 12,404 62 60 59 60 63 166 15.1 23.7 85 132 80 — 22 456 5 15,600 57 53 51 62 67 129 17.8 26.8 0.8 1.5 53 24 29 819 5 3,160 27 60 60 50 50 487 18.9 26.6 — 0.6 21 4 1 872 4 10,380 47 56 55 62 67 265 10.7 15.9 0.3 0.8 47 33 38 317 5 12,830 65 60 60 60 64 138 14.9 23.6 83.9 128.5 85 17 9 445 4 8,040 21 66 66 50 48 389 23.2 34.2 0.1 0.3 42 39 4 745 10 30,077 80 73 68 74 80 52 — — 1,743 2,054 98 — 19 270 15 55,179 81 74 68 77 81 13 — — 1,460 1,544 100 — 15 182 16 43,970 82 74 72 79 84 7 — — 120.3 129.7 100 21 9 79 15 56,430 81 74 68 76 81 14 — — 1,339.3 1,414.3 100 8 14 213 8 14,512 80 73 67 72 79 67 0.6 0.3 283 509 96 — 23 371 6 14,896 74 72 65 74 79 54 0.5 0.2 96 147 95 — 16 624 4 7,880 45 55 52 71 77 28 1.6 1.5 0.1 0.1 100 27 37 485 7 14,880 77 76 75 77 82 25 0.5 0.2 1.0 2.1 100 39 27 2,108 8 8,220 67 72 68 68 78 54 0.7 0.4 0.9 1.7 94 34 8 878 5 7,510 52 61 49 69 76 88 0.7 0.4 1.6 3.7 79 66 32 1,651 5 4,740 55 73 64 71 76 129 0.4 0.3 0.8 2.5 82 53 22 804 6 17,150 79 72 66 74 79 38 0.4 0.1 89.6 133.2 99 9 13 560 5 5,050 59 80 76 72 78 150 0.4 0.1 0.7 1.2 78 53 37 421 8 20,710 67 63 60 75 81 94 0.9 0.4 1.2 2.8 91 23 21 718 9 — 70 62 58 71 76 175 1.1 1.1 22 37 82 — 14 806 7 22,220 24 — — 74 80 — — — 0.1 0.1 91 — 5 2,323 6 22,930 83 — — 72 78 80 4.2 2.3 0.5 0.8 100 2 13 4,781 14 15,930 32 59 55 73 78 27 2.1 1.0 0.3 0.4 91 9 0 2,564 14 — 77 74 72 78 82 39 0.4 0.2 8.6 10.7 100 19 12 355 16 — 89 — — 75 81 — — — — 1.4 91 — — — 10 10,420 70 — — 72 77 — — — 0.0 0.0 93 12 22 1,213 7 13,570 79 70 68 71 77 92 1.1 1.0 3.0 6.0 98 13 23 1,329 7 12,520 36 — — 74 79 27 — — 0.0 0.1 91 10 2 3,719 15 — 98 — — 76 83 — — — 0.4 0.6 — — 66 1,948 4 1,760 59 34 31 61 65 359 1.3 2.1 0.2 0.7 38 83 0 1,037 9 8,860 55 72 68 73 78 89 2.0 1.3 2.1 2.1 93 15 16 2,277 18 — 89 — — 78 84 — — — 0.6 0.7 — — 62 3,055 18 24,030 99 84 72 76 83 14 — — — — 91 1 10 5,598 8 23,700 32 — — 73 78 — — — — 0.1 91 — 3 990 9 10,820 18 56 52 75 82 48 — — 0.1 0.1 91 2 17 5,911 Ethiopia 101.7 30 7 -0 132.9 168.6 47 4.2 41 3 1,620 20 37 36 62 66 Kenya 45.4 31 7 -0 63.7 88.2 39 3.9 42 3 3,060 26 66 63 60 65 Madagascar 23.7 33 7 0 32.9 47.1 36 4.3 41 3 1,400 35 40 33 64 67 Malawi 17.2 34 10 -0 23.4 32.2 42 4.4 40 4 1,140 16 59 58 62 64 Mauritius 1.3 10 8 -1 1.2 1.1 13.6 1.4 20 9 19,290 41 76 39 71 78 Mayotte 0.2 33 3 -0 0.3 0.5 4 4.0 44 3 — 47 — — 75 78 Mozambique 27.2 45 14 0 41.9 74.4 81 5.9 45 3 1,170 32 12 11 52 56 Reunion 0.8 17 5 -7 1.0 1.1 7 2.5 24 10 — 95 67 64 77 84 Rwanda 11.9 34 7 -1 16.4 23.6 32 4.2 41 3 1,720 29 53 48 62 66 Seychelles 0.09 17 7 1 0.1 0.1 13.4 2.4 22 8 25,760 54 — — 70 79 Somalia 11.1 44 12 -6 16.5 27.0 76 6.4 47 3 — 40 15 1 54 57 South Sudan 12.7 37 12 10 17.8 25.9 74 6.7 42 3 1,630 19 4 1 55 57 Tanzania 54.2 37 7 -1 81.5 134.8 43 5.2 45 3 2,620 30 38 32 64 66 Uganda 36.6 43 10 -4 58.1 101.5 53 5.8 48 3 1,780 20 34 30 62 64 Zambia 15.9 43 13 -0 24.1 41.0 52 5.3 46 3 3,700 40 49 45 51 56 Zimbabwe 16.0 36 10 -3 22.2 33.2 50 4.0 42 3 1,700 33 66 66 56 59 MIDDLE AFRICA 157 44 14 -0 238 396 88 6.0 45 3 2,617 47 21 11 51 54 Angola 25.8 45 14 1 39.4 65.5 93 6.0 48 2 6,450 62 18 12 51 54 Cameroon 24.4 38 10 -0 34.4 51.9 55 4.9 43 3 3,080 54 34 21 56 59 Central African Republic 5.0 34 14 0 6.7 9.7 90 4.4 39 4 600 40 15 9 49 53 Chad 14.5 47 14 1 22.7 38.5 87 6.4 48 2 2,110 22 6 5 51 53 Congo 4.9 37 10 -7 6.7 10.2 48 4.7 41 3 6,300 65 30 18 57 60 Congo, Dem. Rep. 79.8 46 16 -0 124.2 213.8 97 6.5 46 3 720 42 21 8 49 52 Equatorial Guinea 0.9 35 11 5 1.3 2.0 67 4.9 39 3 16,450 40 13 10 56 59 Gabon 1.8 32 9 1 2.4 3.5 43 4.1 37 5 18,810 87 31 19 64 65 Sao Tome and Principe 0.2 33 7 -6 0.3 0.3 38 4.4 42 4 3,160 67 41 37 64 68 SOUTHERN AFRICA 64 23 10 3 74 88 36 2.5 31 5 12,404 62 60 59 60 63 Botswana 2.2 25 8 2 2.7 3.3 31 2.8 33 5 15,600 57 53 51 62 67 Lesotho 2.2 29 15 -2 2.6 3.4 59 3.3 36 5 3,160 27 60 60 50 50 Namibia 2.5 29 7 0 3.3 4.7 39 3.6 34 4 10,380 47 56 55 62 67 South Africa 55.7 22 10 3 63.4 75.2 34 2.4 30 5 12,830 65 60 60 60 64 Swaziland 1.3 29 14 -1 1.5 1.8 50 3.3 37 4 8,040 21 66 66 50 48 AMERICAS 998 15 7 1 1,117 1,221 14 2.0 23 10 30,077 80 73 68 74 80 NORTHERN AMERICA 360 12 8 4 401 445 6 1.8 19 15 55,179 81 74 68 77 81 Canada 36.2 11 8 6 41.0 46.9 4.4 1.6 16 16 43,970 82 74 72 79 84 United States 323.9 12 8 4 359.4 398.3 5.8 1.8 19 15 56,430 81 74 68 76 81 LATIN AMERICA AND THE CARIBBEAN 637 17 6 -1 716 775 17 2.1 26 8 14,512 80 73 67 72 79 CENTRAL AMERICA 175 19 5 -1 205 232 16 2.3 29 6 14,896 74 72 65 74 79 Belize 0.4 22 6 4 0.5 0.6 14 2.5 36 4 7,880 45 55 52 71 77 Costa Rica 4.9 15 4 1 5.6 6.1 8.0 1.8 23 7 14,880 77 76 75 77 82 El Salvador 6.4 18 7 -7 6.7 6.7 17 2.0 27 8 8,220 67 72 68 68 78 Guatemala 16.6 24 5 -1 21.3 27.6 28 3.1 40 5 7,510 52 61 49 69 76 Honduras 8.2 22 5 -2 10.2 12.6 26 2.5 32 5 4,740 55 73 64 71 76 Mexico 128.6 19 5 -1 148.1 163.8 13 2.2 28 6 17,150 79 72 66 74 79 Nicaragua 6.3 20 5 -4 7.5 9.1 19 2.4 30 5 5,050 59 80 76 72 78 Panama 4.0 19 5 2 4.8 5.7 14 2.4 27 8 20,710 67 63 60 75 81 CARIBBEAN 43 17 8 -4 47 49 28 2.3 26 9 — 70 62 58 71 76 Antigua and Barbuda 0.09 12 6 -0 0.1 0.1 16 1.5 24 7 22,220 24 — — 74 80 Bahamas 0.4 14 6 4 0.4 0.5 14 1.8 26 6 22,930 83 — — 72 78 Barbados 0.3 12 9 2 0.3 0.3 12 1.7 19 14 15,930 32 59 55 73 78 Cuba 11.2 11 9 -2 11.1 10.2 4.2 1.7 16 14 — 77 74 72 78 82 Curaçao 0.2 12 9 10 0.2 0.2 10.2 1.9 19 16 — 89 — — 75 81 Dominica 0.07 14 9 -1 0.08 0.07 20 2.1 22 10 10,420 70 — — 72 77 Dominican Republic 10.6 20 6 -3 12.1 13.2 31 2.4 30 7 13,570 79 70 68 71 77 Grenada 0.1 17 8 -2 0.1 0.1 15 2.1 26 7 12,520 36 — — 74 79 Guadeloupe 0.4 12 8 -1 0.4 0.4 8.8 2.2 22 15 — 98 — — 76 83 Haiti 11.1 26 8 -3 13.3 16.2 42 3.2 35 4 1,760 59 34 31 61 65 Jamaica 2.7 14 6 -5 2.8 2.6 17 2.0 24 9 8,860 55 72 68 73 78 Martinique 0.4 12 9 -3 0.4 0.3 7 2.1 18 18 — 89 — — 78 84 Puerto Rico 3.4 10 9 -19 3.4 3.1 7.0 1.4 17 18 24,030 99 84 72 76 83 St. Kitts-Nevis 0.05 14 8 7 0.06 0.07 13 1.8 21 8 23,700 32 — — 73 78 Saint Lucia 0.2 12 6 2 0.2 0.2 18 1.5 22 9 10,820 18 56 52 75 82 POPULATION, HEALTH, AND ENVIRONMENT DATA AND ESTIMATES FOR THE COUNTRIES AND REGIONS OF THE WORLD ercent pulation GNI per Capita ($US) Percent Urban Percent of Married Women 15-49 Using Contraceptionc Life Expectancy at Birth (years) Maternal Deaths per 100,000 Births Percent Ages 15-49 With HIV/AIDS Carbon Emissions (million metric tons) Percent of Population With Access to Electricity Percent of Total Energy Consumption From Renewable Sourcesd Percent of Terrestrial Land Under Protected Area Status Population per Square Kilometer of Arable Land Ages 65+ 2015 All Methods Modern Methods Males Females 2015 Males 2015 Females 2015 1992 2013 2012 2013 2014 8 15,415 54 62 56 70 74 216 — — 6,110 9,776 85 18 15 526 18 39,963 78 70 62 76 82 12 — — 3,730 3,556 100 — 14 238 7 10,214 49 61 55 68 72 239 — — 2,169 5,678 81 — 16 697 5 8,936 47 54 46 67 70 267 — — 1,424 2,870 75 — 15 614 4 2,424 32 36 32 61 64 437 1.6 2.2 20 76 34 — 13 550 4 4,802 41 35 30 59 62 490 3.2 4.7 189 346 45 — 14 514 3 3,606 39 31 26 57 59 557 4.0 6.0 124 209 35 — 16 502 5 9,798 51 52 46 69 73 126 0.1 0.1 66 136 88 — 6 571 6 14,280 71 57 48 73 78 140 0.1 0.1 22.1 36.6 100 0 8 545 4 10,690 43 58 57 70 73 33 0.1 0.1 22.2 58.1 100 5 11 3,415 5 15,140 79 42 20 69 75 9 — — 10.2 13.9 100 2 0 368 6 7,680 60 67 57 73 75 121 0.1 0.1 7.1 16.0 100 11 34 431 3 4,080 34 12 12 61 64 311 0.3 0.2 — 4.2 33 64 2 245 8 11,060 68 62 50 73 77 62 0.1 0.1 4.1 7.5 100 13 5 396 3 — 81 — — 67 71 — — — — — — — 0 — 3 4,135 45 18 13 55 56 674 1.9 2.7 23 41 47 — 13 421 3 2,100 44 18 12 58 61 405 0.9 1.2 0.2 1.6 38 51 28 400 3 1,640 30 21 20 57 60 371 0.6 1.0 0.2 0.8 13 80 15 306 6 6,390 66 61 57 71 80 42 0.9 1.1 0.0 0.1 71 21 3 961 3 3,240 54 18 12 51 53 645 2.5 3.8 1.3 2.5 56 74 23 823 2 1,580 60 9 8 59 62 706 1.4 2.2 0.1 0.1 35 49 4 474 5 4,070 54 35 29 60 63 319 1.3 2.0 1.1 4.0 64 49 15 601 3 1,120 37 6 5 58 59 679 1.2 2.0 0.3 0.6 26 76 29 361 3 1,450 49 16 14 54 57 549 — — 0.0 0.1 61 89 16 629 3 720 50 20 19 60 62 725 0.8 1.4 0.1 0.3 10 89 3 923 3 2,360 40 16 15 54 54 587 1.0 1.5 0.1 0.3 26 84 8 269 3 3,710 60 11 10 62 65 602 0.5 0.6 0.3 0.7 22 33 1 926 3 950 22 14 12 61 62 553 0.4 0.5 0.2 0.5 14 81 18 124 3 5,800 48 15 10 53 53 814 2.5 3.7 17.5 26.1 56 86 14 549 4 2,390 45 23 21 65 68 315 0.4 0.6 0.9 2.3 56 51 25 455 3 1,560 40 17 16 50 52 1,360 1.0 1.6 0.1 0.3 14 80 11 415 3 1,320 38 20 17 59 61 368 1.9 2.9 0.2 0.6 31 73 25 283 3 2,019 26 40 37 60 64 434 — — 11 22 22 — 19 575 2 730 12 32 30 58 61 712 0.8 1.3 0.1 0.1 7 97 7 925 3 1,430 28 19 14 62 65 335 — — 0.0 0.0 69 47 10 1,240 4 — 77 19 18 60 64 229 1.3 1.8 0.1 0.2 53 34 1 44,980 3 — 23 8 7 62 66 501 0.4 0.8 0.2 0.2 36 80 5 776 3 1,620 20 37 36 62 66 353 — — 0.8 2.9 27 93 18 673 3 3,060 26 66 63 60 65 510 4.8 7.0 1.5 3.6 23 79 12 783 3 1,400 35 40 33 64 67 353 0.4 0.3 0.3 0.8 15 79 5 676 4 1,140 16 59 58 62 64 634 7.1 11.1 0.2 0.3 10 79 17 453 9 19,290 41 76 39 71 78 53 1.3 0.5 0.5 1.0 100 3 5 1,685 3 — 47 — — 75 78 — — — — — — — 0 2,665 3 1,170 32 12 11 52 56 489 8.7 12.3 0.3 1.1 20 88 17 481 10 — 95 67 64 77 84 — — — 0.4 1.2 — — 76 2,381 3 1,720 29 53 48 62 66 290 2.3 3.5 0.1 0.2 18 87 9 1,006 8 25,760 54 — — 70 79 — — — 0.0 0.2 100 1 42 117,072 3 — 40 15 1 54 57 732 0.5 0.5 0.0 0.2 33 94 1 1,007 3 1,630 19 4 1 55 57 789 2.0 2.9 — 0.4 5 — 21 — 3 2,620 30 38 32 64 66 398 3.7 5.6 0.6 2.9 15 88 32 402 3 1,780 20 34 30 62 64 343 5.9 8.3 0.2 1.3 18 90 16 530 3 3,700 40 49 45 51 56 224 10.9 15.0 0.7 1.0 22 88 38 431
  • 17. © 2016 Population Reference Bureau See notes on page 20 2016 WORLD POPULATION DATA SHEET 17 14 15,930 32 59 55 73 78 27 2.1 1.0 0.3 0.4 91 9 0 2,564 14 — 77 74 72 78 82 39 0.4 0.2 8.6 10.7 100 19 12 355 16 — 89 — — 75 81 — — — — 1.4 91 — — — 10 10,420 70 — — 72 77 — — — 0.0 0.0 93 12 22 1,213 7 13,570 79 70 68 71 77 92 1.1 1.0 3.0 6.0 98 13 23 1,329 7 12,520 36 — — 74 79 27 — — 0.0 0.1 91 10 2 3,719 15 — 98 — — 76 83 — — — 0.4 0.6 — — 66 1,948 4 1,760 59 34 31 61 65 359 1.3 2.1 0.2 0.7 38 83 0 1,037 9 8,860 55 72 68 73 78 89 2.0 1.3 2.1 2.1 93 15 16 2,277 18 — 89 — — 78 84 — — — 0.6 0.7 — — 62 3,055 18 24,030 99 84 72 76 83 14 — — — — 91 1 10 5,598 8 23,700 32 — — 73 78 — — — — 0.1 91 — 3 990 9 10,820 18 56 52 75 82 48 — — 0.1 0.1 91 2 17 5,911 7 11,000 51 — — 71 75 45 — — 0.0 0.1 76 5 22 2,207 9 29,630 8 42 38 71 78 63 1.2 1.3 5.7 12.7 100 0 32 5,420 8 14,628 83 75 69 72 79 63 0.6 0.3 165 324 98 — 25 302 11 — 92 55 53 73 80 52 0.5 0.3 33.1 51.8 100 9 7 110 5 6,840 68 61 35 68 74 206 0.4 0.2 1.8 5.4 91 28 25 248 8 15,020 86 80 77 72 79 44 0.7 0.4 60.2 137.4 100 44 28 271 11 21,740 83 64 — 77 82 22 0.5 0.1 8.9 22.7 100 30 18 1,390 7 13,520 76 79 73 72 79 64 0.7 0.3 16.9 24.4 97 26 23 2,899 7 11,190 64 73 60 73 79 64 0.4 0.2 6.1 11.9 97 13 26 1,384 5 — 84 — — 77 83 — — — 0.2 0.2 — — 52 2,084 5 7,520 29 34 33 64 69 229 1.4 1.6 0.3 0.5 79 36 9 181 5 8,670 60 79 70 71 75 132 0.6 0.3 0.7 1.4 98 63 7 156 7 11,960 79 75 52 72 77 68 0.5 0.2 5.6 15.6 91 28 31 758 7 16,870 66 48 47 68 74 155 1.1 1.1 0.6 0.6 100 19 15 913 14 20,360 95 77 75 74 81 15 0.7 0.2 1.4 2.1 100 46 3 150 6 17,730 89 70 62 72 78 95 0.7 0.4 28.9 50.6 100 11 54 1,149 8 11,969 48 65 59 71 74 122 — — 2,002 5,158 89 — 13 919 7 10,800 44 56 48 69 72 147 — — 1,258 2,350 84 — 11 810 5 25,602 70 54 38 71 76 86 — — 227 468 94 — 15 682 11 8,720 64 55 27 72 78 25 0.3 0.1 1.5 1.5 100 7 25 668 6 17,140 53 51 14 72 77 25 0.2 0.1 15.3 9.7 100 3 14 507 2 39,140 100 62 31 76 78 15 — — 3.0 8.7 98 — 3 90,404 12 30,840 67 — — 78 82 7 — — 1.4 1.6 100 8 18 1,473 14 9,410 54 53 35 71 79 36 0.6 0.2 4.2 2.0 100 29 8 882 3 14,850 70 52 34 67 72 50 — — 16.8 45.8 100 2 0 763 11 34,940 92 — — 80 84 5 — — 11.7 19.4 100 9 20 2,869 3 10,740 84 61 42 73 76 58 — — 3.3 6.8 100 3 2 3,543 2 79,970 98 52 39 74 76 4 — — 5.8 26.7 98 — 18 38,196 7 14,120 88 58 34 76 78 15 0.1 0.1 2.8 6.2 100 5 3 4,726 3 37,340 75 30 19 75 78 17 — — 3.3 16.7 98 — 11 11,541 3 5,070 75 57 44 71 75 45 — — — 0.7 98 — 0 10,441 1 140,720 99 38 34 77 80 13 — — 7.3 23.2 98 — 3 17,556 3 54,730 83 24 — 73 75 12 — — 77.9 147.6 98 0 31 1,033 4 — 58 54 38 64 77 68 — — 11.7 9.8 96 2 1 369 8 19,360 73 74 47 75 79 16 — — 41.8 88.2 100 13 0 386 1 70,570 86 28 24 76 79 6 — — 15.9 46.1 98 0 19 24,712 3 3,660 35 34 29 63 67 385 0.1 0.1 3.9 6.9 48 1 1 2,200 5 6,326 35 54 46 67 70 171 — — 398 918 80 — 6 744 5 10,898 40 54 50 68 75 33 0.3 0.1 118 122 100 — 5 184 7 24,260 53 51 50 68 77 12 0.3 0.1 73.6 71.7 100 1 3 61 4 3,300 36 42 40 67 74 76 0.3 0.1 3.1 2.7 100 22 7 477 3 3,320 26 28 26 66 73 32 0.4 0.2 2.0 1.0 100 58 22 1,005 4 15,760 50 48 46 62 70 42 — — 9.0 18.2 100 — 3 280 5 6,110 36 65 59 71 76 36 0.2 0.1 30.4 28.2 100 2 3 724 5 6,155 35 54 46 67 70 176 — — 280 796 78 — 7 840 2 1,990 27 22 20 59 62 396 0.1 0.1 0.4 5.8 43 11 0 429 6 3,550 34 62 54 71 73 176 0.1 0.1 4.8 18.8 60 38 5 2,122 5 7,610 39 66 65 69 70 148 — — 0.1 0.2 76 90 47 769 6 6,020 33 54 47 67 70 174 — — 190.6 554.9 79 39 5 846 POPULATION, HEALTH, AND ENVIRONMENT DATA AND ESTIMATES FOR THE COUNTRIES AND REGIONS OF THE WORLD ercent pulation GNI per Capita ($US) Percent Urban Percent of Married Women 15-49 Using Contraceptionc Life Expectancy at Birth (years) Maternal Deaths per 100,000 Births Percent Ages 15-49 With HIV/AIDS Carbon Emissions (million metric tons) Percent of Population With Access to Electricity Percent of Total Energy Consumption From Renewable Sourcesd Percent of Terrestrial Land Under Protected Area Status Population per Square Kilometer of Arable Land Ages 65+ 2015 All Methods Modern Methods Males Females 2015 Males 2015 Females 2015 1992 2013 2012 2013 2014 8 15,415 54 62 56 70 74 216 — — 6,110 9,776 85 18 15 526 18 39,963 78 70 62 76 82 12 — — 3,730 3,556 100 — 14 238 7 10,214 49 61 55 68 72 239 — — 2,169 5,678 81 — 16 697 5 8,936 47 54 46 67 70 267 — — 1,424 2,870 75 — 15 614 4 2,424 32 36 32 61 64 437 1.6 2.2 20 76 34 — 13 550 4 4,802 41 35 30 59 62 490 3.2 4.7 189 346 45 — 14 514 3 3,606 39 31 26 57 59 557 4.0 6.0 124 209 35 — 16 502 5 9,798 51 52 46 69 73 126 0.1 0.1 66 136 88 — 6 571 6 14,280 71 57 48 73 78 140 0.1 0.1 22.1 36.6 100 0 8 545 4 10,690 43 58 57 70 73 33 0.1 0.1 22.2 58.1 100 5 11 3,415 5 15,140 79 42 20 69 75 9 — — 10.2 13.9 100 2 0 368 6 7,680 60 67 57 73 75 121 0.1 0.1 7.1 16.0 100 11 34 431 3 4,080 34 12 12 61 64 311 0.3 0.2 — 4.2 33 64 2 245 8 11,060 68 62 50 73 77 62 0.1 0.1 4.1 7.5 100 13 5 396 3 — 81 — — 67 71 — — — — — — — 0 — 3 4,135 45 18 13 55 56 674 1.9 2.7 23 41 47 — 13 421 3 2,100 44 18 12 58 61 405 0.9 1.2 0.2 1.6 38 51 28 400 3 1,640 30 21 20 57 60 371 0.6 1.0 0.2 0.8 13 80 15 306 6 6,390 66 61 57 71 80 42 0.9 1.1 0.0 0.1 71 21 3 961 3 3,240 54 18 12 51 53 645 2.5 3.8 1.3 2.5 56 74 23 823 2 1,580 60 9 8 59 62 706 1.4 2.2 0.1 0.1 35 49 4 474 5 4,070 54 35 29 60 63 319 1.3 2.0 1.1 4.0 64 49 15 601 3 1,120 37 6 5 58 59 679 1.2 2.0 0.3 0.6 26 76 29 361 3 1,450 49 16 14 54 57 549 — — 0.0 0.1 61 89 16 629 3 720 50 20 19 60 62 725 0.8 1.4 0.1 0.3 10 89 3 923 3 2,360 40 16 15 54 54 587 1.0 1.5 0.1 0.3 26 84 8 269 3 3,710 60 11 10 62 65 602 0.5 0.6 0.3 0.7 22 33 1 926 3 950 22 14 12 61 62 553 0.4 0.5 0.2 0.5 14 81 18 124 3 5,800 48 15 10 53 53 814 2.5 3.7 17.5 26.1 56 86 14 549 4 2,390 45 23 21 65 68 315 0.4 0.6 0.9 2.3 56 51 25 455 3 1,560 40 17 16 50 52 1,360 1.0 1.6 0.1 0.3 14 80 11 415 3 1,320 38 20 17 59 61 368 1.9 2.9 0.2 0.6 31 73 25 283 3 2,019 26 40 37 60 64 434 — — 11 22 22 — 19 575 2 730 12 32 30 58 61 712 0.8 1.3 0.1 0.1 7 97 7 925 3 1,430 28 19 14 62 65 335 — — 0.0 0.0 69 47 10 1,240 4 — 77 19 18 60 64 229 1.3 1.8 0.1 0.2 53 34 1 44,980 3 — 23 8 7 62 66 501 0.4 0.8 0.2 0.2 36 80 5 776 3 1,620 20 37 36 62 66 353 — — 0.8 2.9 27 93 18 673 3 3,060 26 66 63 60 65 510 4.8 7.0 1.5 3.6 23 79 12 783 3 1,400 35 40 33 64 67 353 0.4 0.3 0.3 0.8 15 79 5 676 4 1,140 16 59 58 62 64 634 7.1 11.1 0.2 0.3 10 79 17 453 9 19,290 41 76 39 71 78 53 1.3 0.5 0.5 1.0 100 3 5 1,685 3 — 47 — — 75 78 — — — — — — — 0 2,665 3 1,170 32 12 11 52 56 489 8.7 12.3 0.3 1.1 20 88 17 481 10 — 95 67 64 77 84 — — — 0.4 1.2 — — 76 2,381 3 1,720 29 53 48 62 66 290 2.3 3.5 0.1 0.2 18 87 9 1,006 8 25,760 54 — — 70 79 — — — 0.0 0.2 100 1 42 117,072 3 — 40 15 1 54 57 732 0.5 0.5 0.0 0.2 33 94 1 1,007 3 1,630 19 4 1 55 57 789 2.0 2.9 — 0.4 5 — 21 — 3 2,620 30 38 32 64 66 398 3.7 5.6 0.6 2.9 15 88 32 402 3 1,780 20 34 30 62 64 343 5.9 8.3 0.2 1.3 18 90 16 530 Barbados 0.3 12 9 2 0.3 0.3 12 1.7 19 14 15,930 32 59 55 73 78 Cuba 11.2 11 9 -2 11.1 10.2 4.2 1.7 16 14 — 77 74 72 78 82 Curaçao 0.2 12 9 10 0.2 0.2 10.2 1.9 19 16 — 89 — — 75 81 Dominica 0.07 14 9 -1 0.08 0.07 20 2.1 22 10 10,420 70 — — 72 77 Dominican Republic 10.6 20 6 -3 12.1 13.2 31 2.4 30 7 13,570 79 70 68 71 77 Grenada 0.1 17 8 -2 0.1 0.1 15 2.1 26 7 12,520 36 — — 74 79 Guadeloupe 0.4 12 8 -1 0.4 0.4 8.8 2.2 22 15 — 98 — — 76 83 Haiti 11.1 26 8 -3 13.3 16.2 42 3.2 35 4 1,760 59 34 31 61 65 Jamaica 2.7 14 6 -5 2.8 2.6 17 2.0 24 9 8,860 55 72 68 73 78 Martinique 0.4 12 9 -3 0.4 0.3 7 2.1 18 18 — 89 — — 78 84 Puerto Rico 3.4 10 9 -19 3.4 3.1 7.0 1.4 17 18 24,030 99 84 72 76 83 St. Kitts-Nevis 0.05 14 8 7 0.06 0.07 13 1.8 21 8 23,700 32 — — 73 78 Saint Lucia 0.2 12 6 2 0.2 0.2 18 1.5 22 9 10,820 18 56 52 75 82 St. Vincent and the Grenadines 0.1 16 7 -8 0.1 0.1 20 2.0 25 7 11,000 51 — — 71 75 Trinidad and Tobago 1.4 14 8 -1 1.4 1.3 13 1.7 21 9 29,630 8 42 38 71 78 SOUTH AMERICA 419 16 6 -0 465 494 17 2.1 25 8 14,628 83 75 69 72 79 Argentina 43.6 18 8 1 49.1 55.2 10.8 2.3 25 11 — 92 55 53 73 80 Bolivia 11.0 24 6 -2 13.3 16.5 36 3.0 33 5 6,840 68 61 35 68 74 Brazil 206.1 14 6 0 223.1 226.3 18 1.8 23 8 15,020 86 80 77 72 79 Chile 18.2 14 6 2 20.3 21.7 7.4 1.8 20 11 21,740 83 64 — 77 82 Colombia 48.8 16 6 -1 53.3 55.0 15 2.3 27 7 13,520 76 79 73 72 79 Ecuador 16.5 21 5 -0 19.7 23.2 20 2.5 29 7 11,190 64 73 60 73 79 French Guiana 0.3 26 3 -2 0.4 0.6 9 3.5 34 5 — 84 — — 77 83 Guyana 0.8 20 8 -7 0.8 0.8 32 2.6 29 5 7,520 29 34 33 64 69 Paraguay 7.0 22 6 -3 8.2 9.3 28 2.6 32 5 8,670 60 79 70 71 75 Peru 31.5 20 6 -1 35.9 40.1 17 2.5 28 7 11,960 79 75 52 72 77 Suriname 0.5 18 7 -2 0.6 0.7 17 2.3 27 7 16,870 66 48 47 68 74 Uruguay 3.5 14 10 -1 3.6 3.7 9.3 1.9 21 14 20,360 95 77 75 74 81 Venezuela 31.0 20 5 -2 36.1 40.5 12.8 2.4 28 6 17,730 89 70 62 72 78 ASIA 4,437 18 7 -0 4,946 5,327 31 2.1 25 8 11,969 48 65 59 71 74 ASIA (Excl. China) 3,051 21 7 0 3,527 3,974 37 2.4 28 7 10,800 44 56 48 69 72 WESTERN ASIA 261 22 5 3 320 386 22 2.8 29 5 25,602 70 54 38 71 76 Armenia 3.0 14 9 -1 2.8 2.4 9 1.6 19 11 8,720 64 55 27 72 78 Azerbaijan 9.8 17 6 0 10.6 10.8 10 2.1 22 6 17,140 53 51 14 72 77 Bahrain 1.4 16 2 3 1.7 1.9 8 2.1 17 2 39,140 100 62 31 76 78 Cyprus 1.2 12 6 -12 1.3 1.4 5 1.4 17 12 30,840 67 — — 78 82 Georgia 4.0 13 11 -1 3.7 3.1 9 1.7 17 14 9,410 54 53 35 71 79 Iraq 38.1 32 4 2 53.4 76.5 37 4.2 40 3 14,850 70 52 34 67 72 Israel 8.2 21 5 1 10.3 13.8 3.1 3.1 28 11 34,940 92 — — 80 84 Jordan 8.2 27 4 -13 9.0 11.4 16 3.5 37 3 10,740 84 61 42 73 76 Kuwait 4.0 17 2 22 5.0 6.0 7 2.2 22 2 79,970 98 52 39 74 76 Lebanon 6.2 15 5 -1 5.5 5.6 8 1.7 25 7 14,120 88 58 34 76 78 Oman 4.4 21 2 39 5.1 6.0 8 2.9 21 3 37,340 75 30 19 75 78 Palestinian Territory 4.8 32 4 -2 6.5 8.8 18 4.1 40 3 5,070 75 57 44 71 75 Qatar 2.5 12 1 75 3.0 3.5 7 2.0 15 1 140,720 99 38 34 77 80 Saudi Arabia 31.7 22 4 3 39.9 50.0 15 2.8 30 3 54,730 83 24 — 73 75 Syria 17.2 22 4 -20 26.1 31.2 16 2.7 32 4 — 58 54 38 64 77 Turkey 79.5 17 5 7 88.4 93.5 11 2.1 24 8 19,360 73 74 47 75 79 United Arab Emirates 9.3 11 2 8 11.0 12.8 6 1.8 14 1 70,570 86 28 24 76 79 Yemen 27.5 33 7 -1 36.3 47.1 43 4.2 40 3 3,660 35 34 29 63 67 SOUTH CENTRAL ASIA 1,929 23 7 -0 2,254 2,563 43 2.5 30 5 6,326 35 54 46 67 70 CENTRAL ASIA 70 24 6 -1 82 96 32 2.7 29 5 10,898 40 54 50 68 75 Kazakhstan 17.8 23 8 -1 20.5 24.7 9 2.6 25 7 24,260 53 51 50 68 77 Kyrgyzstan 6.1 28 6 -1 8.2 11.6 20 3.8 33 4 3,300 36 42 40 67 74 Tajikistan 8.6 31 6 -3 11.1 14.2 38 3.6 35 3 3,320 26 28 26 66 73 Turkmenistan 5.4 21 8 -1 6.2 6.6 45 2.2 28 4 15,760 50 48 46 62 70 Uzbekistan 31.9 23 5 -1 36.2 39.0 43 2.5 29 5 6,110 36 65 59 71 76 SOUTH ASIA 1,859 23 7 -0 2,172 2,467 43 2.5 30 5 6,155 35 54 46 67 70 Afghanistan 33.4 37 8 1 45.5 62.4 68 5.3 44 2 1,990 27 22 20 59 62 Bangladesh 162.9 20 5 -2 186.5 202.2 38 2.3 33 6 3,550 34 62 54 71 73 Bhutan 0.8 19 6 2 0.9 1.0 44 2.1 31 5 7,610 39 66 65 69 70 India 1,328.9 22 7 0 1,530.0 1,708.0 40 2.3 29 6 6,020 33 54 47 67 70 ercent pulation GNI per Capita ($US) Percent Urban Percent of Married Women 15-49 Using Contraceptionc Life Expectancy at Birth (years) Maternal Deaths per 100,000 Births Percent Ages 15-49 With HIV/AIDS Carbon Emissions (million metric tons) Percent of Population With Access to Electricity Percent of Total Energy Consumption From Renewable Sourcesd Percent of Terrestrial Land Under Protected Area Status Population per Square Kilometer of Arable Land Ages 65+ 2015 All Methods Modern Methods Males Females 2015 Males 2015 Females 2015 1992 2013 2012 2013 2014 8 15,415 54 62 56 70 74 216 — — 6,110 9,776 85 18 15 526 18 39,963 78 70 62 76 82 12 — — 3,730 3,556 100 — 14 238 7 10,214 49 61 55 68 72 239 — — 2,169 5,678 81 — 16 697 5 8,936 47 54 46 67 70 267 — — 1,424 2,870 75 — 15 614 4 2,424 32 36 32 61 64 437 1.6 2.2 20 76 34 — 13 550 4 4,802 41 35 30 59 62 490 3.2 4.7 189 346 45 — 14 514 3 3,606 39 31 26 57 59 557 4.0 6.0 124 209 35 — 16 502 5 9,798 51 52 46 69 73 126 0.1 0.1 66 136 88 — 6 571 6 14,280 71 57 48 73 78 140 0.1 0.1 22.1 36.6 100 0 8 545 4 10,690 43 58 57 70 73 33 0.1 0.1 22.2 58.1 100 5 11 3,415 5 15,140 79 42 20 69 75 9 — — 10.2 13.9 100 2 0 368 6 7,680 60 67 57 73 75 121 0.1 0.1 7.1 16.0 100 11 34 431 3 4,080 34 12 12 61 64 311 0.3 0.2 — 4.2 33 64 2 245 8 11,060 68 62 50 73 77 62 0.1 0.1 4.1 7.5 100 13 5 396 3 — 81 — — 67 71 — — — — — — — 0 — 3 4,135 45 18 13 55 56 674 1.9 2.7 23 41 47 — 13 421 3 2,100 44 18 12 58 61 405 0.9 1.2 0.2 1.6 38 51 28 400 3 1,640 30 21 20 57 60 371 0.6 1.0 0.2 0.8 13 80 15 306 6 6,390 66 61 57 71 80 42 0.9 1.1 0.0 0.1 71 21 3 961 3 3,240 54 18 12 51 53 645 2.5 3.8 1.3 2.5 56 74 23 823 2 1,580 60 9 8 59 62 706 1.4 2.2 0.1 0.1 35 49 4 474 5 4,070 54 35 29 60 63 319 1.3 2.0 1.1 4.0 64 49 15 601 3 1,120 37 6 5 58 59 679 1.2 2.0 0.3 0.6 26 76 29 361 3 1,450 49 16 14 54 57 549 — — 0.0 0.1 61 89 16 629 3 720 50 20 19 60 62 725 0.8 1.4 0.1 0.3 10 89 3 923 3 2,360 40 16 15 54 54 587 1.0 1.5 0.1 0.3 26 84 8 269 3 3,710 60 11 10 62 65 602 0.5 0.6 0.3 0.7 22 33 1 926 3 950 22 14 12 61 62 553 0.4 0.5 0.2 0.5 14 81 18 124 3 5,800 48 15 10 53 53 814 2.5 3.7 17.5 26.1 56 86 14 549 4 2,390 45 23 21 65 68 315 0.4 0.6 0.9 2.3 56 51 25 455 3 1,560 40 17 16 50 52 1,360 1.0 1.6 0.1 0.3 14 80 11 415 3 1,320 38 20 17 59 61 368 1.9 2.9 0.2 0.6 31 73 25 283 3 2,019 26 40 37 60 64 434 — — 11 22 22 — 19 575 2 730 12 32 30 58 61 712 0.8 1.3 0.1 0.1 7 97 7 925 3 1,430 28 19 14 62 65 335 — — 0.0 0.0 69 47 10 1,240 4 — 77 19 18 60 64 229 1.3 1.8 0.1 0.2 53 34 1 44,980 3 — 23 8 7 62 66 501 0.4 0.8 0.2 0.2 36 80 5 776 3 1,620 20 37 36 62 66 353 — — 0.8 2.9 27 93 18 673 3 3,060 26 66 63 60 65 510 4.8 7.0 1.5 3.6 23 79 12 783 3 1,400 35 40 33 64 67 353 0.4 0.3 0.3 0.8 15 79 5 676 4 1,140 16 59 58 62 64 634 7.1 11.1 0.2 0.3 10 79 17 453 9 19,290 41 76 39 71 78 53 1.3 0.5 0.5 1.0 100 3 5 1,685 3 — 47 — — 75 78 — — — — — — — 0 2,665 3 1,170 32 12 11 52 56 489 8.7 12.3 0.3 1.1 20 88 17 481 10 — 95 67 64 77 84 — — — 0.4 1.2 — — 76 2,381 3 1,720 29 53 48 62 66 290 2.3 3.5 0.1 0.2 18 87 9 1,006 8 25,760 54 — — 70 79 — — — 0.0 0.2 100 1 42 117,072 3 — 40 15 1 54 57 732 0.5 0.5 0.0 0.2 33 94 1 1,007 3 1,630 19 4 1 55 57 789 2.0 2.9 — 0.4 5 — 21 — 3 2,620 30 38 32 64 66 398 3.7 5.6 0.6 2.9 15 88 32 402 3 1,780 20 34 30 62 64 343 5.9 8.3 0.2 1.3 18 90 16 530 3 3,700 40 49 45 51 56 224 10.9 15.0 0.7 1.0 22 88 38 431
  • 18. © 2016 Population Reference Bureau See notes on page 20 2016 WORLD POPULATION DATA SHEET 18 3 3,660 35 34 29 63 67 385 0.1 0.1 3.9 6.9 48 1 1 2,200 5 6,326 35 54 46 67 70 171 — — 398 918 80 — 6 744 5 10,898 40 54 50 68 75 33 0.3 0.1 118 122 100 — 5 184 7 24,260 53 51 50 68 77 12 0.3 0.1 73.6 71.7 100 1 3 61 4 3,300 36 42 40 67 74 76 0.3 0.1 3.1 2.7 100 22 7 477 3 3,320 26 28 26 66 73 32 0.4 0.2 2.0 1.0 100 58 22 1,005 4 15,760 50 48 46 62 70 42 — — 9.0 18.2 100 — 3 280 5 6,110 36 65 59 71 76 36 0.2 0.1 30.4 28.2 100 2 3 724 5 6,155 35 54 46 67 70 176 — — 280 796 78 — 7 840 2 1,990 27 22 20 59 62 396 0.1 0.1 0.4 5.8 43 11 0 429 6 3,550 34 62 54 71 73 176 0.1 0.1 4.8 18.8 60 38 5 2,122 5 7,610 39 66 65 69 70 148 — — 0.1 0.2 76 90 47 769 6 6,020 33 54 47 67 70 174 — — 190.6 554.9 79 39 5 846 5 17,400 72 77 57 74 77 25 0.2 0.1 62.4 168.3 100 1 7 534 5 11,310 46 35 27 76 78 68 — — 0.1 0.3 100 3 1 10,616 6 2,500 20 50 47 66 69 258 0.3 0.2 0.4 1.8 76 85 23 1,345 4 5,350 39 35 26 66 67 178 0.1 0.1 19.9 41.8 94 45 11 668 8 11,480 18 68 52 72 78 30 0.1 0.1 1.4 4.4 89 61 23 1,628 6 11,298 48 62 54 68 73 110 0.6 0.4 142 368 90 — 14 907 4 — 77 — — 77 81 23 — — 1.4 2.1 76 0 44 8,472 4 3,290 21 56 39 61 66 161 0.6 0.7 0.4 1.5 31 73 26 381 5 10,680 54 61 60 69 73 126 0.6 0.4 55.2 130.7 96 37 15 1,104 4 5,380 39 50 42 65 68 197 — — 0.1 0.6 70 87 17 475 6 26,140 75 49 32 72 77 40 0.7 0.1 20.5 64.5 100 7 18 3,228 5 — 34 46 46 64 68 178 1.0 0.5 1.3 3.4 52 79 7 487 5 8,900 44 55 38 65 72 114 0.1 0.1 13.3 26.8 88 29 11 1,835 12 81,190 100 62 55 80 85 10 — — 13.7 13.8 100 1 6 982,641 11 15,210 50 79 77 72 79 20 1.3 1.0 29.9 82.7 100 23 19 389 6 3,820 33 22 21 67 70 215 — — — 0.1 42 43 9 817 7 5,690 34 76 57 71 76 54 0.7 0.3 5.9 41.6 99 36 7 1,446 12 17,048 60 82 81 75 79 27 — — 1,235 3,405 99 — 17 1,396 10 14,160 56 85 84 75 78 27 — — 735.2 2,795.1 100 18 17 1,296 16 57,650 100 75 72 81 87 — — — 9.0 12.3 100 1 42 237,245 9 120,890 100 — — 80 86 — — — 0.3 0.6 91 0 0 — 27 38,870 94 54 44 80 87 5 — — 306.5 339.1 100 4 19 2,958 10 — 61 71 65 66 74 82 — — 63.5 13.7 30 16 3 1,069 14 34,700 82 80 70 79 86 11 — — 77.5 161.6 100 2 8 3,396 4 11,070 67 55 48 65 75 44 0.1 0.1 3.0 11.3 90 3 17 546 13 — 77 71 — 77 83 — — — 39.7 71.3 — — — 3,949 17 32,614 74 71 61 75 81 13 — — 1,884 1,560 100 — 14 266 19 37,646 75 72 65 78 83 8 — — 1,088 930 100 — 25 467 17 42,265 81 81 78 79 83 8 — — 228 197 100 — 20 525 16 — 32 — — 80 85 — — — — — 100 — — 3,944 19 47,810 88 — — 79 82 6 — — 14.8 10.4 100 28 18 238 19 27,510 69 63 58 72 82 9 — — 6.5 5.4 100 25 21 208 20 40,840 84 77 75 78 85 3 — — 12.9 12.6 100 39 15 247 14 46,120 94 — — 81 84 3 — — 0.5 0.5 100 78 17 276 13 46,410 63 65 61 79 83 8 — — 8.5 9.5 100 7 14 419 19 24,220 68 68 56 69 80 18 0.9 0.4 3.9 1.9 100 40 18 163 19 26,660 67 63 50 69 80 10 — — 6.0 3.4 100 24 17 125 16 64,590 81 88 82 80 84 5 — — 8.7 16.3 100 58 29 650 20 47,390 86 75 65 80 84 4 — — 13.9 12.1 100 50 15 381 17 40,550 83 84 84 79 83 9 — — 151.7 124.8 100 4 28 1,047 19 46,052 79 71 68 79 84 7 — — 448 400 100 — 28 571 18 47,510 66 70 68 79 84 4 — — 15.5 17.0 100 34 28 647 18 44,100 98 70 69 79 84 7 — — 30.5 25.5 100 7 23 1,384 18 40,470 80 76 74 79 85 8 — — 99.8 90.9 100 13 25 353 21 48,260 75 66 62 78 83 6 — — 243.2 206.5 100 12 37 696 16 — 14 — — 81 84 — — — — 0.0 100 — 44 1,454 14 70,750 90 — — 80 85 10 — — 2.9 2.8 100 4 35 933 24 — 100 — — — — — — — — — 100 — 53 226 18 48,400 90 69 67 80 83 7 — — 44.2 46.4 100 5 12 1,639 18 61,930 84 82 78 81 85 5 — — 11.7 11.0 100 23 10 2,078 Yemen 27.5 33 7 -1 36.3 47.1 43 4.2 40 3 3,660 35 34 29 63 67 SOUTH CENTRAL ASIA 1,929 23 7 -0 2,254 2,563 43 2.5 30 5 6,326 35 54 46 67 70 CENTRAL ASIA 70 24 6 -1 82 96 32 2.7 29 5 10,898 40 54 50 68 75 Kazakhstan 17.8 23 8 -1 20.5 24.7 9 2.6 25 7 24,260 53 51 50 68 77 Kyrgyzstan 6.1 28 6 -1 8.2 11.6 20 3.8 33 4 3,300 36 42 40 67 74 Tajikistan 8.6 31 6 -3 11.1 14.2 38 3.6 35 3 3,320 26 28 26 66 73 Turkmenistan 5.4 21 8 -1 6.2 6.6 45 2.2 28 4 15,760 50 48 46 62 70 Uzbekistan 31.9 23 5 -1 36.2 39.0 43 2.5 29 5 6,110 36 65 59 71 76 SOUTH ASIA 1,859 23 7 -0 2,172 2,467 43 2.5 30 5 6,155 35 54 46 67 70 Afghanistan 33.4 37 8 1 45.5 62.4 68 5.3 44 2 1,990 27 22 20 59 62 Bangladesh 162.9 20 5 -2 186.5 202.2 38 2.3 33 6 3,550 34 62 54 71 73 Bhutan 0.8 19 6 2 0.9 1.0 44 2.1 31 5 7,610 39 66 65 69 70 India 1,328.9 22 7 0 1,530.0 1,708.0 40 2.3 29 6 6,020 33 54 47 67 70 Iran 79.5 19 5 -1 87.9 91.6 14 1.8 24 5 17,400 72 77 57 74 77 Maldives 0.4 18 3 1 0.5 0.6 8 2.5 27 5 11,310 46 35 27 76 78 Nepal 28.4 22 7 -1 33.3 36.4 33 2.3 31 6 2,500 20 50 47 66 69 Pakistan 203.4 30 7 -1 265.6 344.0 67 3.7 36 4 5,350 39 35 26 66 67 Sri Lanka 21.2 16 6 -4 21.9 21.2 8 2.1 25 8 11,480 18 68 52 72 78 SOUTHEAST ASIA 633 19 7 -0 730 824 27 2.4 27 6 11,298 48 62 54 68 73 Brunei 0.4 16 3 2 0.5 0.5 8 1.9 23 4 — 77 — — 77 81 Cambodia 15.8 24 6 -2 19.0 22.5 26 2.6 32 4 3,290 21 56 39 61 66 Indonesia 259.4 20 7 -1 305.7 359.8 30 2.5 28 5 10,680 54 61 60 69 73 Laos 7.1 26 7 -3 8.7 10.4 55 3.0 35 4 5,380 39 50 42 65 68 Malaysia 30.8 17 5 2 36.1 40.7 6 2.0 25 6 26,140 75 49 32 72 77 Myanmar 52.4 19 8 -1 58.1 61.3 61 2.3 28 5 — 34 46 46 64 68 Philippines 102.6 23 7 -1 124.0 148.7 22 2.8 32 5 8,900 44 55 38 65 72 Singapore 5.6 8 4 8 6.3 6.6 1.7 1.2 15 12 81,190 100 62 55 80 85 Thailand 65.3 12 8 -1 66.8 63.3 10 1.6 18 11 15,210 50 79 77 72 79 Timor-Leste 1.3 37 7 -9 1.6 2.3 45 5.7 42 6 3,820 33 22 21 67 70 Vietnam 92.7 16 7 1 103.2 108.2 15 2.1 24 7 5,690 34 76 57 71 76 EAST ASIA 1,614 12 7 -0 1,643 1,554 10 1.6 17 12 17,048 60 82 81 75 79 China 1,378.0 12 7 -0 1,411.2 1,343.9 11 1.6 17 10 14,160 56 85 84 75 78 China, Hong Kong SARf 7.4 8 6 6 8.0 8.2 1.4 1.2 11 16 57,650 100 75 72 81 87 China, Macao SARf 0.7 11 3 9 0.7 0.8 2 1.1 12 9 120,890 100 — — 80 86 Japan 125.3 8 10 0 116.7 100.6 1.9 1.5 13 27 38,870 94 54 44 80 87 Korea, North 25.1 15 9 -0 26.7 27.0 25 2.0 21 10 — 61 71 65 66 74 Korea, South 50.8 9 5 0 52.2 48.1 3.0 1.2 14 14 34,700 82 80 70 79 86 Mongolia 3.1 27 6 0 3.8 4.6 15 3.1 27 4 11,070 67 55 48 65 75 Taiwan 23.5 9 7 0 23.3 20.5 4.0 1.2 14 13 — 77 71 — 77 83 EUROPE 740 11 11 2 744 728 5 1.6 16 17 32,614 74 71 61 75 81 EUROPEAN UNION 506 10 10 3 518 515 4 1.6 16 19 37,646 75 72 65 78 83 NORTHERN EUROPE 103 12 9 3 112 120 4 1.8 18 17 42,265 81 81 78 79 83 Channel Islands 0.2 10 8 4 0.2 0.2 2.9 1.6 15 16 — 32 — — 80 85 Denmark 5.7 10 9 9 6.2 6.3 3.5 1.7 17 19 47,810 88 — — 79 82 Estonia 1.3 11 12 2 1.3 1.2 2.4 1.6 16 19 27,510 69 63 58 72 82 Finland 5.5 10 10 2 5.8 5.9 1.7 1.6 16 20 40,840 84 77 75 78 85 Iceland 0.3 12 7 3 0.4 0.4 2.0 1.8 20 14 46,120 94 — — 81 84 Ireland 4.7 14 6 -3 5.1 5.7 3.1 1.9 22 13 46,410 63 65 61 79 83 Latvia 2.0 11 14 -4 1.6 1.5 4.2 1.6 15 19 24,220 68 68 56 69 80 Lithuania 2.9 11 14 -8 2.7 2.4 4.1 1.6 15 19 26,660 67 63 50 69 80 Norway 5.2 11 8 6 5.9 6.6 2.4 1.7 18 16 64,590 81 88 82 80 84 Sweden 9.9 12 9 8 11.5 12.6 2.5 1.8 17 20 47,390 86 75 65 80 84 United Kingdom 65.6 12 9 3 71.0 77.0 3.9 1.8 18 17 40,550 83 84 84 79 83 WESTERN EUROPE 193 10 10 8 201 205 3 1.7 16 19 46,052 79 71 68 79 84 Austria 8.8 10 10 13 9.2 9.7 3.0 1.5 14 18 47,510 66 70 68 79 84 Belgium 11.3 11 10 4 12.0 12.8 3.5 1.7 17 18 44,100 98 70 69 79 84 France 64.6 12 9 1 68.5 72.3 3.5 1.9 18 18 40,470 80 76 74 79 85 Germany 82.6 9 11 14 83.3 81.0 3.3 1.5 13 21 48,260 75 66 62 78 83 Liechtenstein 0.04 10 7 4 0.04 0.04 3.3 1.6 15 16 — 14 — — 81 84 Luxembourg 0.6 11 7 20 0.7 0.7 3.2 1.5 16 14 70,750 90 — — 80 85 Monaco 0.04 7 6 21 0.04 0.05 — 1.5 13 24 — 100 — — — — Netherlands 17.0 10 9 3 17.8 18.1 3.6 1.7 17 18 48,400 90 69 67 80 83 Switzerland 8.4 10 8 9 9.5 10.3 3.9 1.5 15 18 61,930 84 82 78 81 85 POPULATION, HEALTH, AND ENVIRONMENT DATA AND ESTIMATES FOR THE COUNTRIES AND REGIONS OF THE WORLD ercent pulation GNI per Capita ($US) Percent Urban Percent of Married Women 15-49 Using Contraceptionc Life Expectancy at Birth (years) Maternal Deaths per 100,000 Births Percent Ages 15-49 With HIV/AIDS Carbon Emissions (million metric tons) Percent of Population With Access to Electricity Percent of Total Energy Consumption From Renewable Sourcesd Percent of Terrestrial Land Under Protected Area Status Population per Square Kilometer of Arable Land Ages 65+ 2015 All Methods Modern Methods Males Females 2015 Males 2015 Females 2015 1992 2013 2012 2013 2014 8 15,415 54 62 56 70 74 216 — — 6,110 9,776 85 18 15 526 18 39,963 78 70 62 76 82 12 — — 3,730 3,556 100 — 14 238 7 10,214 49 61 55 68 72 239 — — 2,169 5,678 81 — 16 697 5 8,936 47 54 46 67 70 267 — — 1,424 2,870 75 — 15 614 4 2,424 32 36 32 61 64 437 1.6 2.2 20 76 34 — 13 550 4 4,802 41 35 30 59 62 490 3.2 4.7 189 346 45 — 14 514 3 3,606 39 31 26 57 59 557 4.0 6.0 124 209 35 — 16 502 5 9,798 51 52 46 69 73 126 0.1 0.1 66 136 88 — 6 571 6 14,280 71 57 48 73 78 140 0.1 0.1 22.1 36.6 100 0 8 545 4 10,690 43 58 57 70 73 33 0.1 0.1 22.2 58.1 100 5 11 3,415 5 15,140 79 42 20 69 75 9 — — 10.2 13.9 100 2 0 368 6 7,680 60 67 57 73 75 121 0.1 0.1 7.1 16.0 100 11 34 431 3 4,080 34 12 12 61 64 311 0.3 0.2 — 4.2 33 64 2 245 8 11,060 68 62 50 73 77 62 0.1 0.1 4.1 7.5 100 13 5 396 3 — 81 — — 67 71 — — — — — — — 0 — 3 4,135 45 18 13 55 56 674 1.9 2.7 23 41 47 — 13 421 3 2,100 44 18 12 58 61 405 0.9 1.2 0.2 1.6 38 51 28 400 3 1,640 30 21 20 57 60 371 0.6 1.0 0.2 0.8 13 80 15 306 6 6,390 66 61 57 71 80 42 0.9 1.1 0.0 0.1 71 21 3 961 3 3,240 54 18 12 51 53 645 2.5 3.8 1.3 2.5 56 74 23 823 2 1,580 60 9 8 59 62 706 1.4 2.2 0.1 0.1 35 49 4 474 5 4,070 54 35 29 60 63 319 1.3 2.0 1.1 4.0 64 49 15 601 3 1,120 37 6 5 58 59 679 1.2 2.0 0.3 0.6 26 76 29 361 3 1,450 49 16 14 54 57 549 — — 0.0 0.1 61 89 16 629 3 720 50 20 19 60 62 725 0.8 1.4 0.1 0.3 10 89 3 923 3 2,360 40 16 15 54 54 587 1.0 1.5 0.1 0.3 26 84 8 269 3 3,710 60 11 10 62 65 602 0.5 0.6 0.3 0.7 22 33 1 926 3 950 22 14 12 61 62 553 0.4 0.5 0.2 0.5 14 81 18 124 3 5,800 48 15 10 53 53 814 2.5 3.7 17.5 26.1 56 86 14 549 4 2,390 45 23 21 65 68 315 0.4 0.6 0.9 2.3 56 51 25 455 3 1,560 40 17 16 50 52 1,360 1.0 1.6 0.1 0.3 14 80 11 415 3 1,320 38 20 17 59 61 368 1.9 2.9 0.2 0.6 31 73 25 283 3 2,019 26 40 37 60 64 434 — — 11 22 22 — 19 575 2 730 12 32 30 58 61 712 0.8 1.3 0.1 0.1 7 97 7 925 3 1,430 28 19 14 62 65 335 — — 0.0 0.0 69 47 10 1,240 4 — 77 19 18 60 64 229 1.3 1.8 0.1 0.2 53 34 1 44,980 3 — 23 8 7 62 66 501 0.4 0.8 0.2 0.2 36 80 5 776 3 1,620 20 37 36 62 66 353 — — 0.8 2.9 27 93 18 673 3 3,060 26 66 63 60 65 510 4.8 7.0 1.5 3.6 23 79 12 783 3 1,400 35 40 33 64 67 353 0.4 0.3 0.3 0.8 15 79 5 676 4 1,140 16 59 58 62 64 634 7.1 11.1 0.2 0.3 10 79 17 453 9 19,290 41 76 39 71 78 53 1.3 0.5 0.5 1.0 100 3 5 1,685 3 — 47 — — 75 78 — — — — — — — 0 2,665 3 1,170 32 12 11 52 56 489 8.7 12.3 0.3 1.1 20 88 17 481 10 — 95 67 64 77 84 — — — 0.4 1.2 — — 76 2,381 3 1,720 29 53 48 62 66 290 2.3 3.5 0.1 0.2 18 87 9 1,006 8 25,760 54 — — 70 79 — — — 0.0 0.2 100 1 42 117,072 3 — 40 15 1 54 57 732 0.5 0.5 0.0 0.2 33 94 1 1,007 3 1,630 19 4 1 55 57 789 2.0 2.9 — 0.4 5 — 21 — 3 2,620 30 38 32 64 66 398 3.7 5.6 0.6 2.9 15 88 32 402 3 1,780 20 34 30 62 64 343 5.9 8.3 0.2 1.3 18 90 16 530 3 3,700 40 49 45 51 56 224 10.9 15.0 0.7 1.0 22 88 38 431