Fao rice price update september 2020
•
0 likes•52 views

Analisis del precio y desarrollo del mercado de arroz en el Mundo

Recommended
Recommended
More Related Content
What's hot
What's hot (20)
Similar to Fao rice price update september 2020
Similar to Fao rice price update september 2020 (18)
Recently uploaded
Recently uploaded (20)
Fao rice price update september 2020
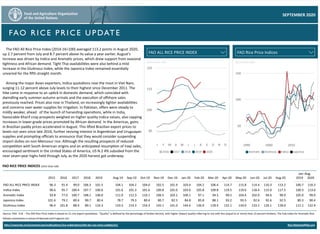
- 1. 9/2/2020 1. FAO rice price indices 1/1 Source: FAO. N.B. - The FAO Rice Price Index is based on 21 rice export quota ons. "Quality" is defined by the percentage of broken kernels, with higher (lower) quality referring to rice with less (equal to or more) than 15 percent brokens. The Sub-index for Aroma c Rice follows movements in prices of Basma and Fragrant rice. The FAO All Rice Price Index (2014-16=100) averaged 113.2 points in August 2020, up 2.7 percent from July and 8.7 percent above its value a year earlier. August’s increase was driven by Indica and Aroma c prices, which drew support from seasonal ghtness and African demand. Tight Thai availabili es were also behind a mild increase in the Glu nous Index, while the Japonica Index remained essen ally unvaried for the fi h straight month. Among the major Asian exporters, Indica quota ons rose the most in Viet Nam, surging 11-12 percent above July levels to their highest since December 2011. The hike came in response to an up ck in domes c demand, which coincided with dwindling early summer-autumn arrivals and the execu on of offshore sales previously reached. Prices also rose in Thailand, on increasingly ghter availabili es and concerns over water supplies for irriga on. In Pakistan, offers were steady to mildly weaker, ahead of the launch of harves ng opera ons, while in India, favourable Kharif crop prospects weighed on higher quality Indica values, also capping increases in lower-grade prices promoted by African demand. In the Americas, gains in Brazilian paddy prices accelerated in August. This li ed Brazilian export prices to levels not seen since late 2016, further reviving interest in Argen nian and Uruguayan supplies and promp ng officials to announce that they would consider suspending import du es on non-Mercosur rice. Although the resul ng prospects of reduced compe on with South American origins and an an cipated resump on of Iraqi sales, encouraged sen ment in the United States of America, US N.2 4% subsided from the near seven-year highs held through July, as the 2020 harvest got underway. Rice-Network@fao.orgh p://www.fao.org/economic/est/publica ons/rice-publica ons/the-fao-rice-price-update/en/ SEPTEMBER 2020 FAO Rice Price Indices 2014-2016=100 50 100 150 1990 2000 2010 Aroma c Glu nous Indica Japonica FAO ALL RICE PRICE INDEX 2014-2016=100 90 100 110 120 J F M A M J J A S O N D 2016 2017 2018 2019 2020 Series_Short 2015 2016 2017 2018 2019 . Aug-19 Sep-19 Oct-19 Nov-19 Dec-19 Jan-20 Feb-20 Mar-20 Apr-20 May-20 Jun-20 Jul-20 Aug-20 . 2019 2020 FAO ALL RICE PRICE INDEX Indica Index Aroma c Index Japonica Index Glu nous Index 96.3 96.6 93.8 101.6 96.4 91.4 95.7 77.0 79.2 101.8 99.0 100.4 100.7 80.4 88.4 106.3 107.7 108.1 90.7 89.1 101.5 100.6 106.0 80.4 124.3 104.1 101.6 111.0 78.7 153.5 104.2 101.3 112.3 79.3 153.3 104.0 101.6 110.1 80.4 154.3 102.5 100.8 106.5 80.7 145.1 101.9 101.0 103.1 82.5 141.0 103.4 103.6 100.1 84.8 144.4 104.2 105.8 97.1 85.8 136.9 106.4 109.8 94.5 88.1 128.4 114.7 119.5 99.5 93.2 132.1 115.8 119.6 104.4 93.5 134.0 114.4 118.4 102.0 92.6 133.2 110.3 115.0 94.6 92.6 126.1 113.2 117.5 99.9 92.5 128.0 100.7 100.3 105.0 80.3 112.2 110.3 113.6 99.0 90.4 132.9 Jan.-Aug. FAO RICE PRICE INDICES (2014-2016=100)
- 2. 9/2/2020 2. Export prices and FAO rice price indices 1/1 Select market segment: Aromatic Indica: Higher Quality Indica: Lower Quality Japonica and Glutinous Select date range: 01/01/1990 31/12/2020 FAO RICE PRICE UPDATE Sources: Creed Rice Market Report, FAO, Livericeindex.com, Thai Department of Foreign Trade (DFT), Vie raders and other public sources. All quota ons are on a free on board (f.o.b.) basis, unless otherwise specified. 1/ Long grain white rice. 2/ White broken rice. 3/ California Calrose, free alongside ship (f.a.s.). 4/ Basma ordinary up to May 2011. Super kernel white basma 2% from June 2011 onwards. 5/ Phka Malis /Phka Rumduol. 6/ Hom Mali rice, grade A. SEPTEMBER 2020 Selected interna onal prices of rice and FAO rice price indices Indica Index 2014-2016=100 0 50 100 150 200 250 1990 2000 2010 2020 Indica Index Year-to-date (YTD): Series . Month Value . 1 month earlier . 1 year earlier . 2 years earlier . Period Value YTD compared to 1 year earlier Argen na 5% Brazil 5% India 5% India Parboiled 5% Pakistan 5% Thai 100% B White Thai Parboiled 100% Uruguay 5% 1/ U.S. #2, 4% 1/ Viet 5% Aug-20 Aug-20 Aug-20 Aug-20 Aug-20 Aug-20 Aug-20 Aug-20 Aug-20 Aug-20 530.0 560.0 387.5 371.3 426.3 520.8 517.8 535.0 614.5 475.8 4.7% 12.7% -2.1% -2.3% -1.1% 4.9% 2.2% 3.7% -4.9% 11.4% 14.5% 17.2% -4.1% -1.9% 18.5% 17.2% 17.6% 11.5% 21.0% 41.6% 11.3% 14.5% -4.8% -5.1% 3.7% 22.1% 24.9% 8.5% 14.9% 22.6% Jan.-Aug. Jan.-Aug. Jan.-Aug. Jan.-Aug. Jan.-Aug. Jan.-Aug. Jan.-Aug. Jan.-Aug. Jan.-Aug. Jan.-Aug. 501.7 499.7 392.0 372.4 416.7 514.3 513.0 508.5 607.5 419.1 7.4% 3.9% 2.1% -1.5% 16.3% 19.5% 20.4% 4.3% 22.6% 22.2% Latest available quota on (USD/MT): Latest available quota on compared to: Export prices of Higher Quality Indica rice USD/MT 450 500 550 600 650 2019 2020 Argen na 5% Brazil 5% Uruguay 5% US #2/4% Export prices of Higher Quality Indica rice USD/MT 300 400 500 600 2019 2020 India 5% Pakistan 5% Thai 100% B Viet Nam 5%
- 3. 9/2/2020 3. Export prices 1/1 Selected interna onal prices of rice (USD/MT) SEPTEMBER 2020 Series 2015 2016 2017 2018 2019 . Aug-19 Sep-19 Oct-19 Nov-19 Dec-19 Jan-20 Feb-20 Mar-20 Apr-20 May-20 Jun-20 Jul-20 Aug-20 . 2019 2020 Argen na 5% Brazil 5% Cambodia Fragrant 5% 5/ India 100% 2/ India Pusa Basma India 25% India 5% India Parboiled 5% Pakistan Basma 4/ Pakistan 25% Pakistan 5% Thai 100% B White Thai 25% Thai A1 Super 2/ Thai Fragrant 6/ Thai Glu nous 10% Thai Parboiled 100% Uruguay 5% 1/ U.S. Medium Grain #1, 4% 3/ U.S. #2, 4% 1/ 511.0 498.2 804.6 282.8 1151.0 337.4 366.2 367.5 849.5 318.2 348.1 395.5 372.7 326.6 1007.8 795.8 392.0 541.4 856.6 489.6 457.0 526.2 721.6 287.5 847.4 333.4 365.7 360.4 795.2 327.1 354.5 406.6 385.1 347.8 768.4 840.5 409.5 472.9 651.0 437.5 493.3 517.9 681.4 308.5 1239.9 361.4 398.7 396.1 1131.4 349.6 386.7 414.7 383.6 334.4 842.6 703.1 420.5 498.6 673.2 455.8 484.0 477.1 930.5 296.4 1282.8 373.9 406.9 397.8 1022.9 360.1 399.7 445.0 408.4 365.4 1166.8 706.7 431.3 496.6 887.5 531.0 470.4 482.3 902.8 306.3 1274.2 360.7 386.8 374.9 981.8 323.8 357.1 434.7 410.3 385.2 1211.9 1105.0 428.1 487.8 849.9 500.5 463.0 478.0 894.0 332.0 1350.0 365.0 404.0 378.4 1039.0 326.8 359.6 444.2 418.8 389.2 1247.8 1423.6 440.4 480.0 850.0 508.0 467.5 483.8 905.0 312.5 1350.0 363.0 400.3 372.5 1045.0 333.8 365.8 444.0 420.8 399.3 1298.0 1421.5 439.5 486.3 850.8 508.0 470.0 485.0 893.3 317.5 1350.0 363.0 400.0 368.3 988.8 323.5 354.3 440.3 418.0 398.0 1271.0 1404.0 430.3 485.0 845.0 509.0 480.0 482.0 839.2 320.0 1290.0 357.4 389.6 366.8 976.0 319.4 348.6 438.6 415.4 394.6 1208.4 1273.0 425.4 487.8 820.0 510.6 490.0 490.0 830.0 314.3 1250.0 355.0 380.0 366.5 942.5 319.5 349.8 449.0 423.3 394.0 1164.7 1219.7 434.0 492.5 815.0 515.0 490.0 495.0 825.0 305.4 1175.0 357.0 385.0 366.5 961.0 332.2 366.4 468.0 439.5 403.5 1155.5 1335.3 458.0 492.0 822.0 532.5 488.5 495.0 816.3 305.0 1087.5 358.8 385.0 375.0 987.5 341.0 376.8 466.8 441.8 413.8 1110.0 1241.0 457.3 490.0 840.0 557.5 487.5 478.3 826.3 286.8 1050.0 355.0 373.8 367.0 911.3 347.5 384.8 509.3 477.0 421.3 1083.5 1092.0 507.3 490.0 852.5 581.0 492.5 483.8 905.0 283.3 371.3 396.3 998.8 396.5 444.8 582.3 537.3 441.5 1146.5 1111.3 572.8 513.0 926.3 636.3 509.0 490.0 904.0 297.0 384.6 410.0 376.0 1047.0 393.8 452.8 535.2 501.2 439.6 1133.2 1121.2 539.8 517.0 960.0 646.0 510.0 498.8 920.0 286.8 380.0 402.5 371.3 995.0 398.3 450.5 536.3 500.5 434.3 1127.3 1143.8 544.3 515.0 960.0 646.0 506.0 497.0 907.2 293.6 995.0 364.0 396.0 380.0 986.0 379.0 431.0 496.3 466.8 422.0 1049.0 1111.0 506.8 516.0 960.0 646.0 530.0 560.0 860.0 300.0 1175.0 367.5 387.5 371.3 980.0 380.5 426.3 520.8 486.3 424.5 1031.0 1137.5 517.8 535.0 946.3 614.5 Viet Glu nous 10% Viet 25% Viet 5% Viet Fragrant 5% 474.2 334.2 352.6 471.6 501.1 331.6 347.3 446.5 461.1 351.2 372.1 522.8 467.9 390.9 411.8 538.8 532.6 323.2 340.2 464.9 599.4 317.4 336.0 484.2 599.0 303.8 316.3 473.8 628.5 324.5 337.5 474.8 638.8 323.6 340.8 476.4 638.0 323.8 343.5 468.3 567.6 331.0 345.8 425.2 563.0 341.8 362.0 417.3 599.3 378.8 403.8 463.0 629.5 420.0 446.8 529.0 644.4 425.0 455.8 508.2 611.8 410.0 435.8 471.8 550.8 406.4 427.0 481.8 548.8 455.8 475.8 521.0 467.2 480.9 920.8 301.5 1256.3 361.2 384.0 378.1 978.7 323.7 358.4 430.6 405.8 379.5 1200.0 992.7 426.1 487.7 858.4 495.4 501.7 499.7 870.5 294.7 1096.5 367.3 392.0 372.4 983.3 371.1 416.7 514.3 481.3 425.0 1104.5 1161.6 513.0 508.5 908.4 607.5 485.8 325.4 343.1 460.8 589.4 396.1 419.1 477.2 Jan.-Aug. Sources: Creed Rice Market Report, Livericeindex.com, Thai Department of Foreign Trade (DFT), Vie raders and other public sources. All quota ons are on a free on board (f.o.b.) basis, unless otherwise specified. " " = unquoted. 1/ Long grain white rice. 2/ White broken rice. 3/ California Calrose, free alongside ship (f.a.s.). 4/ Basma ordinary up to May 2011. Super kernel white basma 2% from June 2011 onwards. 5/ Phka Malis /Phka Rumduol. 6/ Hom Mali rice, grade A. For more informa on on prices, you can refer to the Food Price Monitoring and Analysis Tool (h p://www.fao.org/giews/pricetool/), which gives access to quota ons of major traded products, including the high quality Thai white rice 100% B and the 100% broken rice Thai A1 Super, from 2000 onwards. The site also hosts domes c (retail or wholesale) prices for major food commodi es in mul ple countries. FAO RICE PRICE UPDATE
- 4. 9/2/2020 About this bulletin 1/1 The FAO All Rice Price Index is based on 21 rice export quota ons. These quota ons are combined into four groups consis ng of Indica, Aroma c, Japonica and Glu nous rice varie es. Within each variety, a simple average of the rela ve prices of appropriate quota ons is calculated; then the average rela ve prices of each of the four varie es are combined by weigh ng them with their (fixed) trade shares. "Quality" is defined by the percentage of broken kernels, with higher (lower) quality referring to rice with less (equal to or more) than 15 percent brokens. The Sub-index for Aroma c rice follows movements in prices of Basma and fragrant rice. The FAO Rice Price Update provides monthly rice export prices from major origins and is released on a monthly basis. To subscribe to the FAO Rice Price Update and the FAO Rice Market Monitor, please send an e-mail to RICE MARKET NETWORK with "subscribe" in the subject line. Use of material subject to credit given to source: FAO Rice Price Update Trade and Markets Division Food and Agriculture Organiza on of the United Na ons