Automobiles Update: CV Goods Segment -Truck Rentals recover 4-5% - Prabhudas Lilladher
•
1 like•298 views

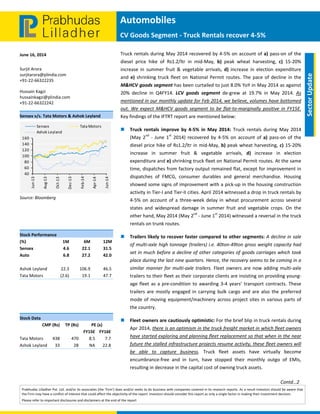
Truck rentals during May 2014 recovered by 4-5% on account of a) pass-on of the diesel price hike of Rs1.2/ltr in mid-May, b) peak wheat harvesting, c) 15-20% increase in summer fruit & vegetable arrivals, d) increase in election expenditure.

Recommended
More Related Content
What's hot
What's hot (14)
Viewers also liked
Viewers also liked (8)
Similar to Automobiles Update: CV Goods Segment -Truck Rentals recover 4-5% - Prabhudas Lilladher
Similar to Automobiles Update: CV Goods Segment -Truck Rentals recover 4-5% - Prabhudas Lilladher (20)
More from IndiaNotes.com
More from IndiaNotes.com (20)
Recently uploaded
Recently uploaded (20)
Automobiles Update: CV Goods Segment -Truck Rentals recover 4-5% - Prabhudas Lilladher
- 1. June 16, 2014 Prabhudas Lilladher Pvt. Ltd. and/or its associates (the 'Firm') does and/or seeks to do business with companies covered in its research reports. As a result investors should be aware that the Firm may have a conflict of interest that could affect the objectivity of the report. Investors should consider this report as only a single factor in making their investment decision. Please refer to important disclosures and disclaimers at the end of the report Automobiles CV Goods Segment ‐ Truck Rentals recover 4‐5% Sector Update Surjit Arora surjitarora@plindia.com +91‐22‐66322235 Hussain Kagzi hussainkagzi@plindia.com +91‐22‐66322242 Sensex v/s. Tata Motors & Ashok Leyland 40 60 80 100 120 140 160 Jun‐13 Aug‐13 Oct‐13 Dec‐13 Feb‐14 Apr‐14 Jun‐14 Sensex Tata Motors Ashok Leyland Source: Bloomberg Stock Performance (%) 1M 6M 12M Sensex 4.6 22.1 31.5 Auto 6.8 27.2 42.0 Ashok Leyland 22.3 106.9 46.5 Tata Motors (2.6) 19.1 47.7 Stock Data CMP (Rs) TP (Rs) PE (x) FY15E FY16E Tata Motors 438 470 8.5 7.7 Ashok Leyland 33 28 NA 22.8 Truck rentals during May 2014 recovered by 4‐5% on account of a) pass‐on of the diesel price hike of Rs1.2/ltr in mid‐May, b) peak wheat harvesting, c) 15‐20% increase in summer fruit & vegetable arrivals, d) increase in election expenditure and e) shrinking truck fleet on National Permit routes. The pace of decline in the M&HCV goods segment has been curtailed to just 8.0% YoY in May 2014 as against 20% decline in Q4FY14. LCV goods segment de‐grew at 19.7% in May 2014. As mentioned in our monthly update for Feb 2014, we believe, volumes have bottomed out. We expect M&HCV goods segment to be flat‐to‐marginally positive in FY15E. Key findings of the IFTRT report are mentioned below: Truck rentals improve by 4‐5% in May 2014: Truck rentals during May 2014 (May 2nd ‐ June 1st 2014) recovered by 4‐5% on account of a) pass‐on of the diesel price hike of Rs1.2/ltr in mid‐May, b) peak wheat harvesting, c) 15‐20% increase in summer fruit & vegetable arrivals, d) increase in election expenditure and e) shrinking truck fleet on National Permit routes. At the same time, dispatches from factory output remained flat, except for improvement in dispatches of FMCG, consumer durables and general merchandise. Housing showed some signs of improvement with a pick‐up in the housing construction activity in Tier‐I and Tier‐II cities. April 2014 witnessed a drop in truck rentals by 4‐5% on account of a three‐week delay in wheat procurement across several states and widespread damage in summer fruit and vegetable crops. On the other hand, May 2014 (May 2nd ‐ June 1st 2014) witnessed a reversal in the truck rentals on trunk routes. Trailers likely to recover faster compared to other segments: A decline in sale of multi‐axle high tonnage (trailers) i.e. 40ton‐49ton gross weight capacity had set in much before a decline of other categories of goods carriages which took place during the last nine quarters. Hence, the recovery seems to be coming in a similar manner for multi‐axle trailers. Fleet owners are now adding multi‐axle trailers to their fleet as their corporate clients are insisting on providing young‐ age fleet as a pre‐condition to awarding 3‐4 years’ transport contracts. These trailers are mostly engaged in carrying bulk cargo and are also the preferred mode of moving equipment/machinery across project sites in various parts of the country. Fleet owners are cautiously optimistic: For the brief blip in truck rentals during Apr 2014, there is an optimism in the truck freight market in which fleet owners have started exploring and planning fleet replacement so that when in the near future the stalled infrastructure projects resume activity, these fleet owners will be able to capture business. Truck fleet assets have virtually become encumbrance‐free and in turn, have stopped their monthly outgo of EMIs, resulting in decrease in the capital cost of owning truck assets. Contd…2
- 2. June 16, 2014 2 Automobiles M&HCV goods segment de‐grew by only 8.0% YoY in May 2014: M&HCV goods segment declined by only 8.0% YoY in May 2014 as against 14.0% YoY decline in April 2014, whereas for FY14, the decline has been 27.0% YoY. The pace of decline has slowed down considerably (from an average 28% YoY decline in Q3FY14 to an average 20% YoY decline in Q4FY14 to 8.0% currently). We believe M&HCV volumes have bottomed out. We expect a recovery from Q3FY15 onwards. At the same time, Truck rentals are up 10% YoY. Stress in M&HCV segment percolating to LCV goods segment with the latter de‐growing by 19.7% in May 2014: Need for Hub‐and‐Spoke model and launch of new models has fuelled growth in the LCV goods segment over FY11‐FY13 period. However, stress in the M&HCV segment in FY14 has percolated down to the LCV segment, with the latter de‐growing by 28.8% YoY in FY14. The ACE segment too has declined by 30% YoY, leading to an overall decline of 19.7% YoY in May 2014. CV goods de‐grew by 20.5% in Apr‐May 2014: Volumes in the industry truck sales (LCV & MHCV goods segment) de‐grew by 20.5% due to lower cargo availability and slowdown in the LCV segment.
- 3. June 16, 2014 3 Automobiles Freight rates improve 4‐5% in May 2014 Exhibit 1: 9T payload Truck for a round trip from Delhi Source: IFTRT, PL Research Exhibit 2: 9T payload Truck for a round trip from Delhi Source: IFTRT, PL Research Exhibit 3: 9T payload Truck for a round trip from Delhi Source: IFTRT, PL Research Exhibit 4: 9T payload Truck for a round trip from Delhi Source: IFTRT, PL Research 50,000 53,000 56,000 59,000 62,000 May‐13 Jun‐13 Jul‐13 Aug‐13 Sep‐13 Oct‐13 Nov‐13 Dec‐13 Jan‐14 Feb‐14 Mar‐14 Apr‐14 May‐14 Jun‐14 Freight Rate (Rs) Mumbai Nagpur 40,000 55,000 70,000 85,000 100,000 115,000 Apr‐13 May‐13 Jun‐13 Jul‐13 Aug‐13 Sep‐13 Oct‐13 Nov‐13 Dec‐13 Jan‐14 Feb‐14 Mar‐14 Apr‐14 May‐14 Jun‐14 Freight Rate (Rs) Kolkata Guwahati 65,000 75,000 85,000 95,000 105,000 Apr‐13 May‐13 Jun‐13 Jul‐13 Aug‐13 Sep‐13 Oct‐13 Nov‐13 Dec‐13 Jan‐14 Feb‐14 Mar‐14 Apr‐14 May‐14 Jun‐14 Freight Rate (Rs) Hyderabad Chennai 48,000 52,000 56,000 60,000 64,000 Apr‐13 May‐13 Jun‐13 Jul‐13 Aug‐13 Sep‐13 Oct‐13 Nov‐13 Dec‐13 Jan‐14 Feb‐14 Mar‐14 Apr‐14 May‐14 Jun‐14 Freight Rate (Rs) Ranchi Raipur .
- 4. June 16, 2014 4 Automobiles CV goods segment de‐grew by 20.5% during Apr‐May’14 Exhibit 5: Segment‐wise break‐up of volumes Segment‐wise Break‐up FY10 FY11 FY12 FY13 FY14 FY15E LCV goods segment (0‐7.5T) (A) 253,364 317,030 411,415 476,695 389,312 390,000 % ch. YoY 48.2 25.1 29.8 15.9 (18.3) 2.4 ICV goods segment (7.5T ‐ 12T) 43,679 55,411 67,104 57,436 41,432 42,000 % ch. YoY (19.1) 26.7 21.0 (14.4) (27.9) 6.2 Rigid Vehicles (12T‐16T) 48,605 60,686 60,906 48,151 32,363 36,000 % ch. YoY 13.9 26.5 ‐ (20.9) (32.8) 11.3 Rigid Vehicles (16T‐25T) 90,904 129,974 142,822 96,424 74,395 76,000 % ch. YoY 33.2 42.4 9.9 (32.5) (22.8) 2.2 Tractor Trailer / Tippers (16T‐49T) 18,673 29,050 28,502 19,765 13,728 16,000 % ch. YoY 86.8 55.3 (2.0) (30.9) (30.5) 16.5 M&HCV goods segment (7.5T‐49T) (B) 201,861 275,121 299,334 221,710 161,918 170,000 % ch. YoY 15.4 36.3 8.8 (25.9) (27.0) 5.0 CV goods segment (A + B) 455,225 591,375 710,749 698,444 551,230 560,000 % ch. YoY 31.6 29.9 20.2 (1.7) (21.0) 1.6 Source: SIAM Data, PL Research Exhibit 6: LCV goods segment LCV goods carriers May‐13 May‐14 YTD FY14 YTD FY15 Ashok Leyland 2,131 1,498 4,013 2,673 YoY growth (%) (29.7) (33.4) MS (%) 6.6 5.8 6.1 5.4 Mahindra & Mahindra 12,466 11,568 34,614 22,471 YoY growth (%) (29.1) (35.1) MS (%) 38.9 44.9 37.4 44.4 Tata Motors 16,170 11,461 34,614 22,471 YoY growth (%) (29.1) (35.1) MS (%) 50.4 44.5 52.6 45.4 Total (incl. other players) 32,066 25,736 65,792 49,480 YoY growth (%) (19.7) (24.8) Source: SIAM Data, PL Research In FY14, LCV goods segment de‐grew by 28.8%, indicating that the weak macro situation is now percolating down to the last mile transport segment. Tata Motors has lost 720bps market share to 45.4%, mainly to Mahindra, which has gained almost 700bps in market share for Apr‐May’14 period. Slide in LCV volumes continued in the month of May’14 with a decline of 19.7% YoY.
- 5. June 16, 2014 5 Automobiles Exhibit 7: M&HCV goods segment M&HCV goods carriers May‐13 May‐14 YTD FY14 YTD FY15 Ashok Leyland 2,886 3,197 5,837 6,268 YoY growth (%) 10.8 7.4 MS (%) 20.0 24.1 20.1 24.3 Tata Motors 8,768 7,846 17,445 15,151 YoY growth (%) (10.5) (13.1) MS (%) 60.7 59.0 60.1 58.6 VE CVs ‐ Eicher 1,806 1,474 3,957 2,919 YoY growth (%) (18.4) (26.2) MS (%) 12.5 11.1 13.6 11.3 Total (incl. other players) 14,444 13,288 29,039 25,840 YoY growth (%) (8.0) (11.0) Source: SIAM Data, PL Research M&HCV goods segment declined by 8.0% YoY in May’14. For FY14, the M&HCV Goods declined by 27.0% YoY, with the 12‐16T rigid vehicles declining the most by 32.8% YoY. The pace of decline has slowed considerably (from an average28% YoY decline in Q3FY14 to an average 20% YoY decline in Q4FY14). We believe M&HCV volumes have bottomed out. We expect recovery from Q3FY15 onwards.
- 6. June 16, 2014 6 Automobiles Prabhudas Lilladher Pvt. Ltd. 3rd Floor, Sadhana House, 570, P. B. Marg, Worli, Mumbai‐400 018, India Tel: (91 22) 6632 2222 Fax: (91 22) 6632 2209 Rating Distribution of Research Coverage 27.4% 52.8% 19.8% 0.0% 0% 10% 20% 30% 40% 50% 60% BUY Accumulate Reduce Sell % of Total Coverage PL’s Recommendation Nomenclature BUY : Over 15% Outperformance to Sensex over 12‐months Accumulate : Outperformance to Sensex over 12‐months Reduce : Underperformance to Sensex over 12‐months Sell : Over 15% underperformance to Sensex over 12‐months Trading Buy : Over 10% absolute upside in 1‐month Trading Sell : Over 10% absolute decline in 1‐month Not Rated (NR) : No specific call on the stock Under Review (UR) : Rating likely to change shortly This document has been prepared by the Research Division of Prabhudas Lilladher Pvt. Ltd. Mumbai, India (PL) and is meant for use by the recipient only as information and is not for circulation. This document is not to be reported or copied or made available to others without prior permission of PL. It should not be considered or taken as an offer to sell or a solicitation to buy or sell any security. The information contained in this report has been obtained from sources that are considered to be reliable. However, PL has not independently verified the accuracy or completeness of the same. Neither PL nor any of its affiliates, its directors or its employees accept any responsibility of whatsoever nature for the information, statements and opinion given, made available or expressed herein or for any omission therein. Recipients of this report should be aware that past performance is not necessarily a guide to future performance and value of investments can go down as well. The suitability or otherwise of any investments will depend upon the recipient's particular circumstances and, in case of doubt, advice should be sought from an independent expert/advisor. Either PL or its affiliates or its directors or its employees or its representatives or its clients or their relatives may have position(s), make market, act as principal or engage in transactions of securities of companies referred to in this report and they may have used the research material prior to publication. We may from time to time solicit or perform investment banking or other services for any company mentioned in this document.