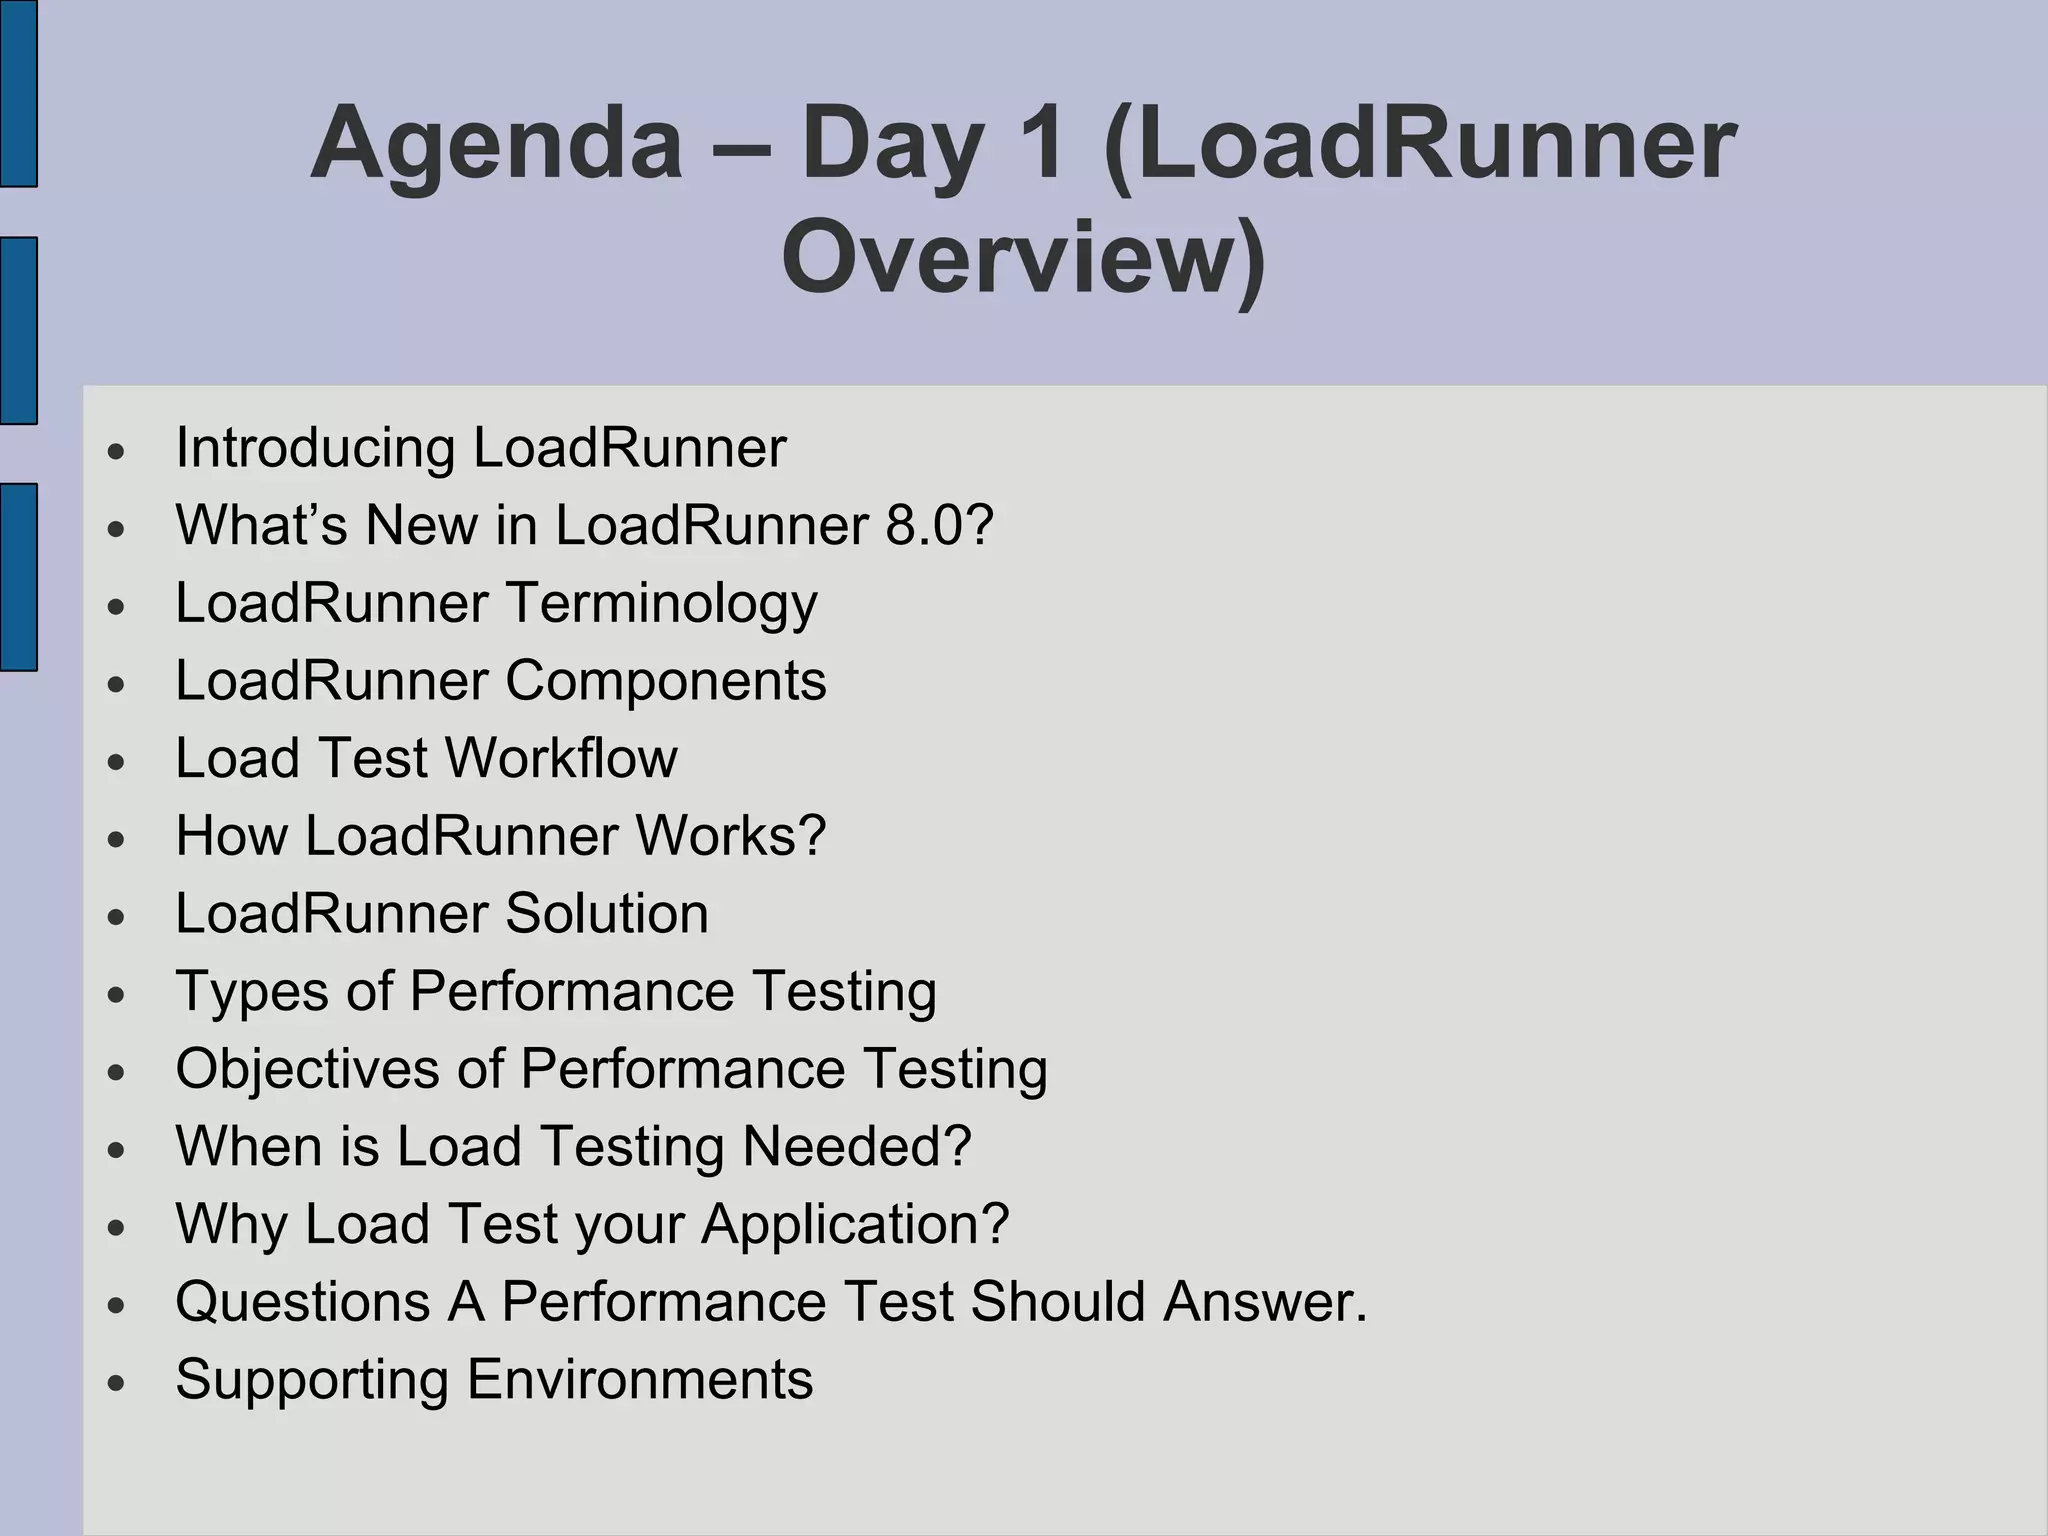
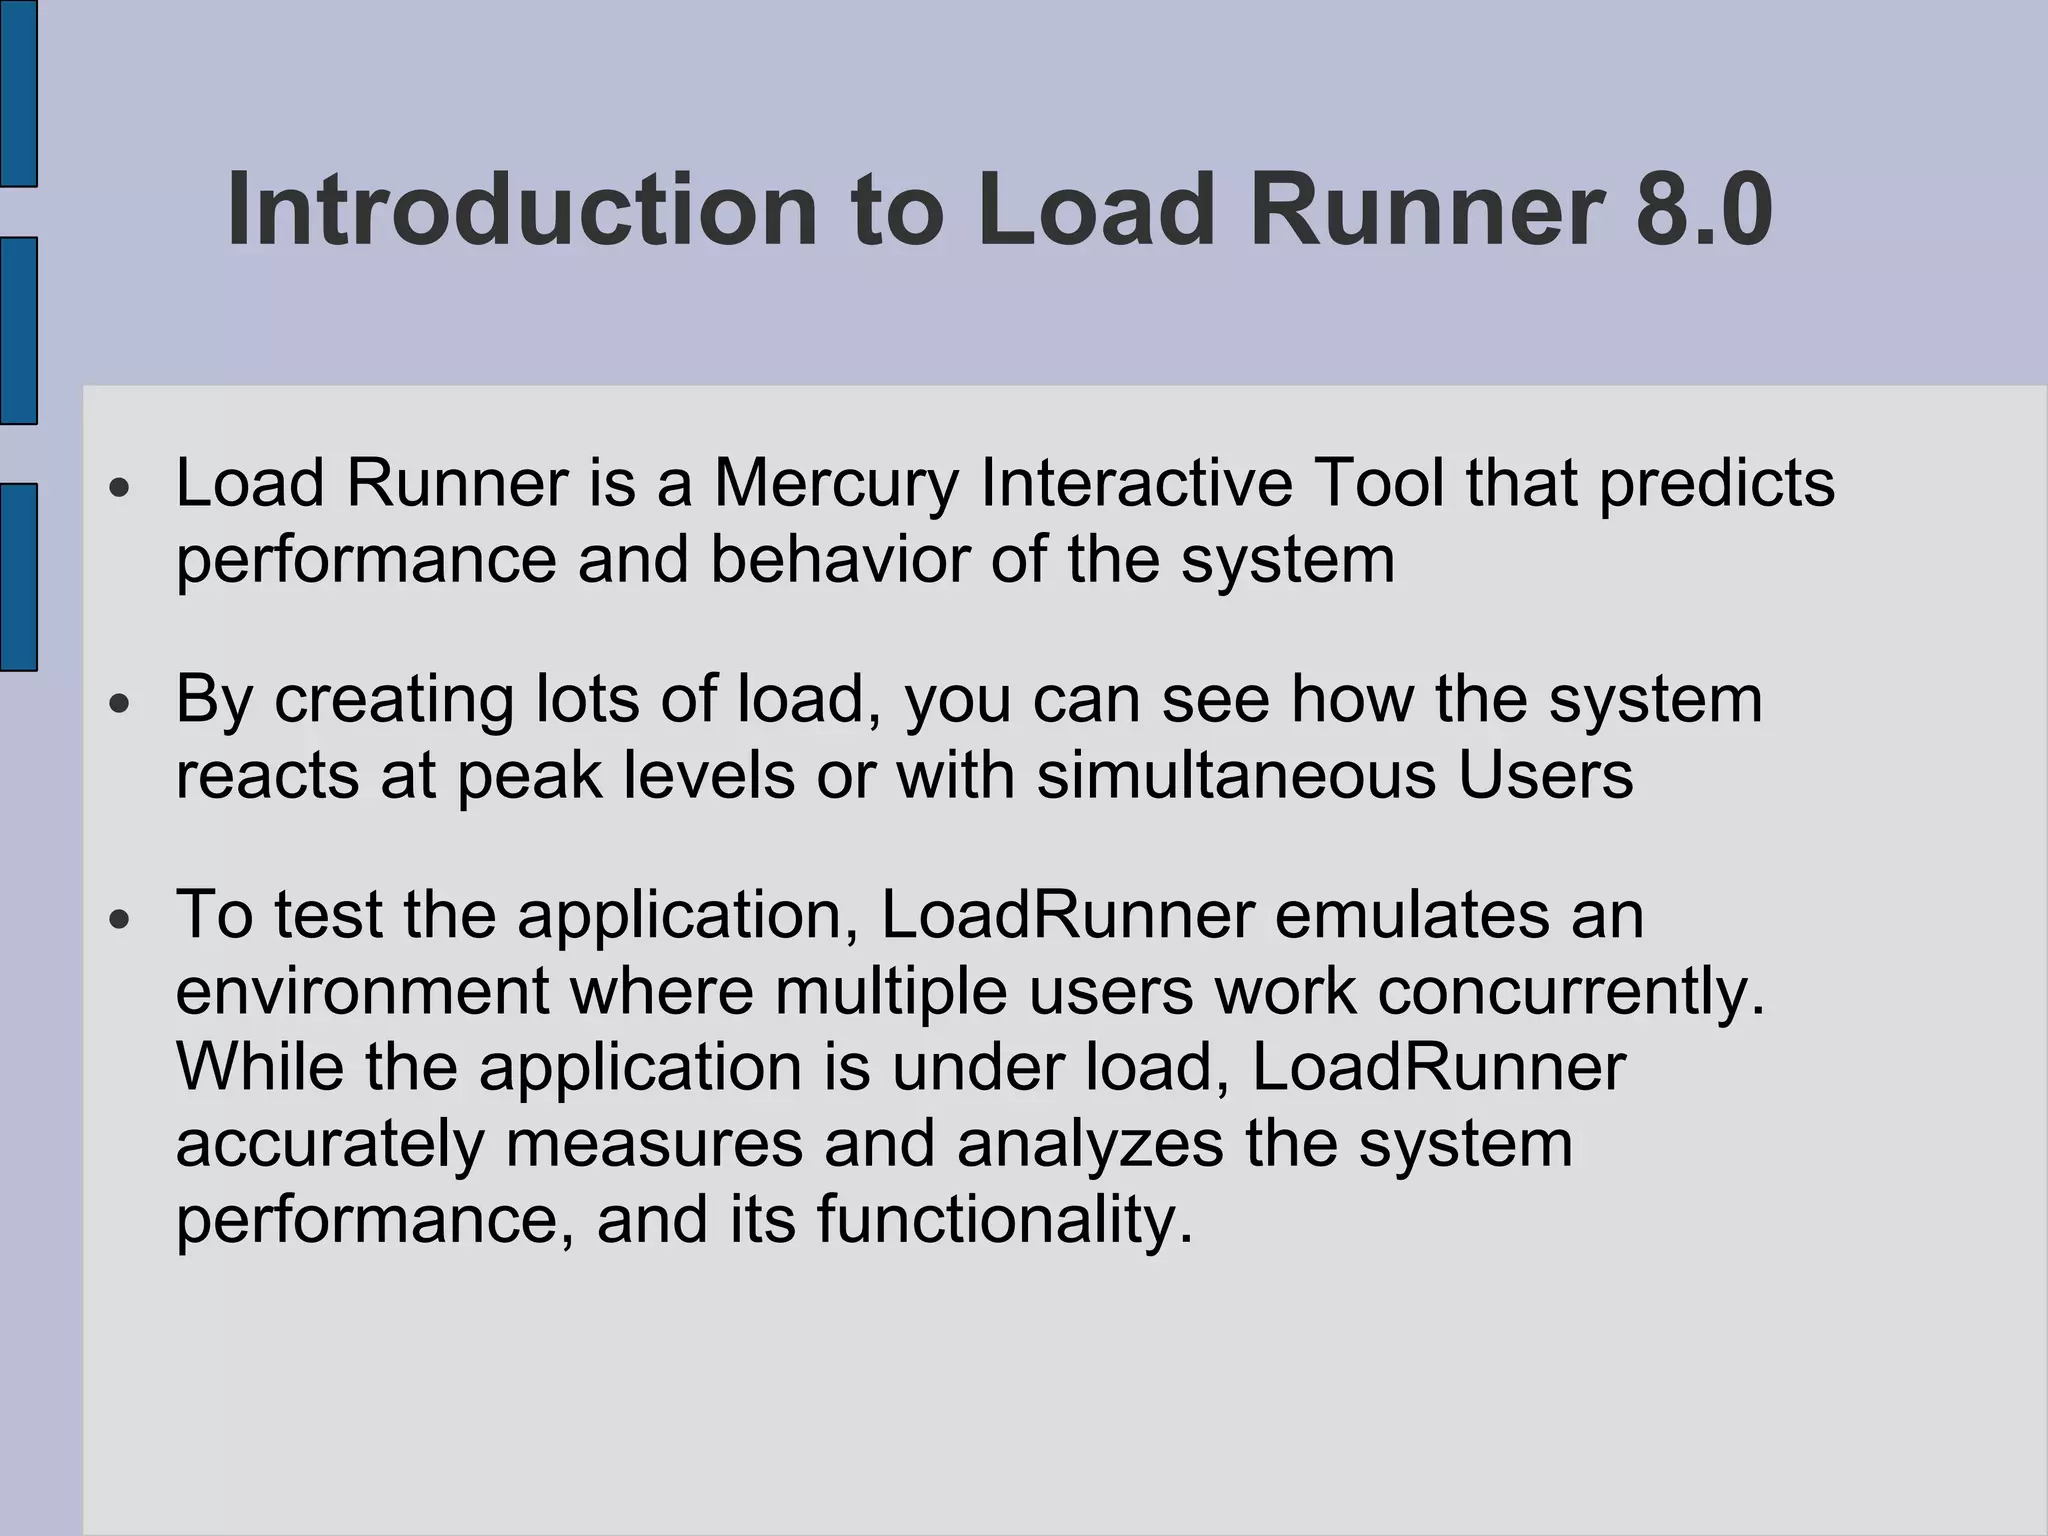
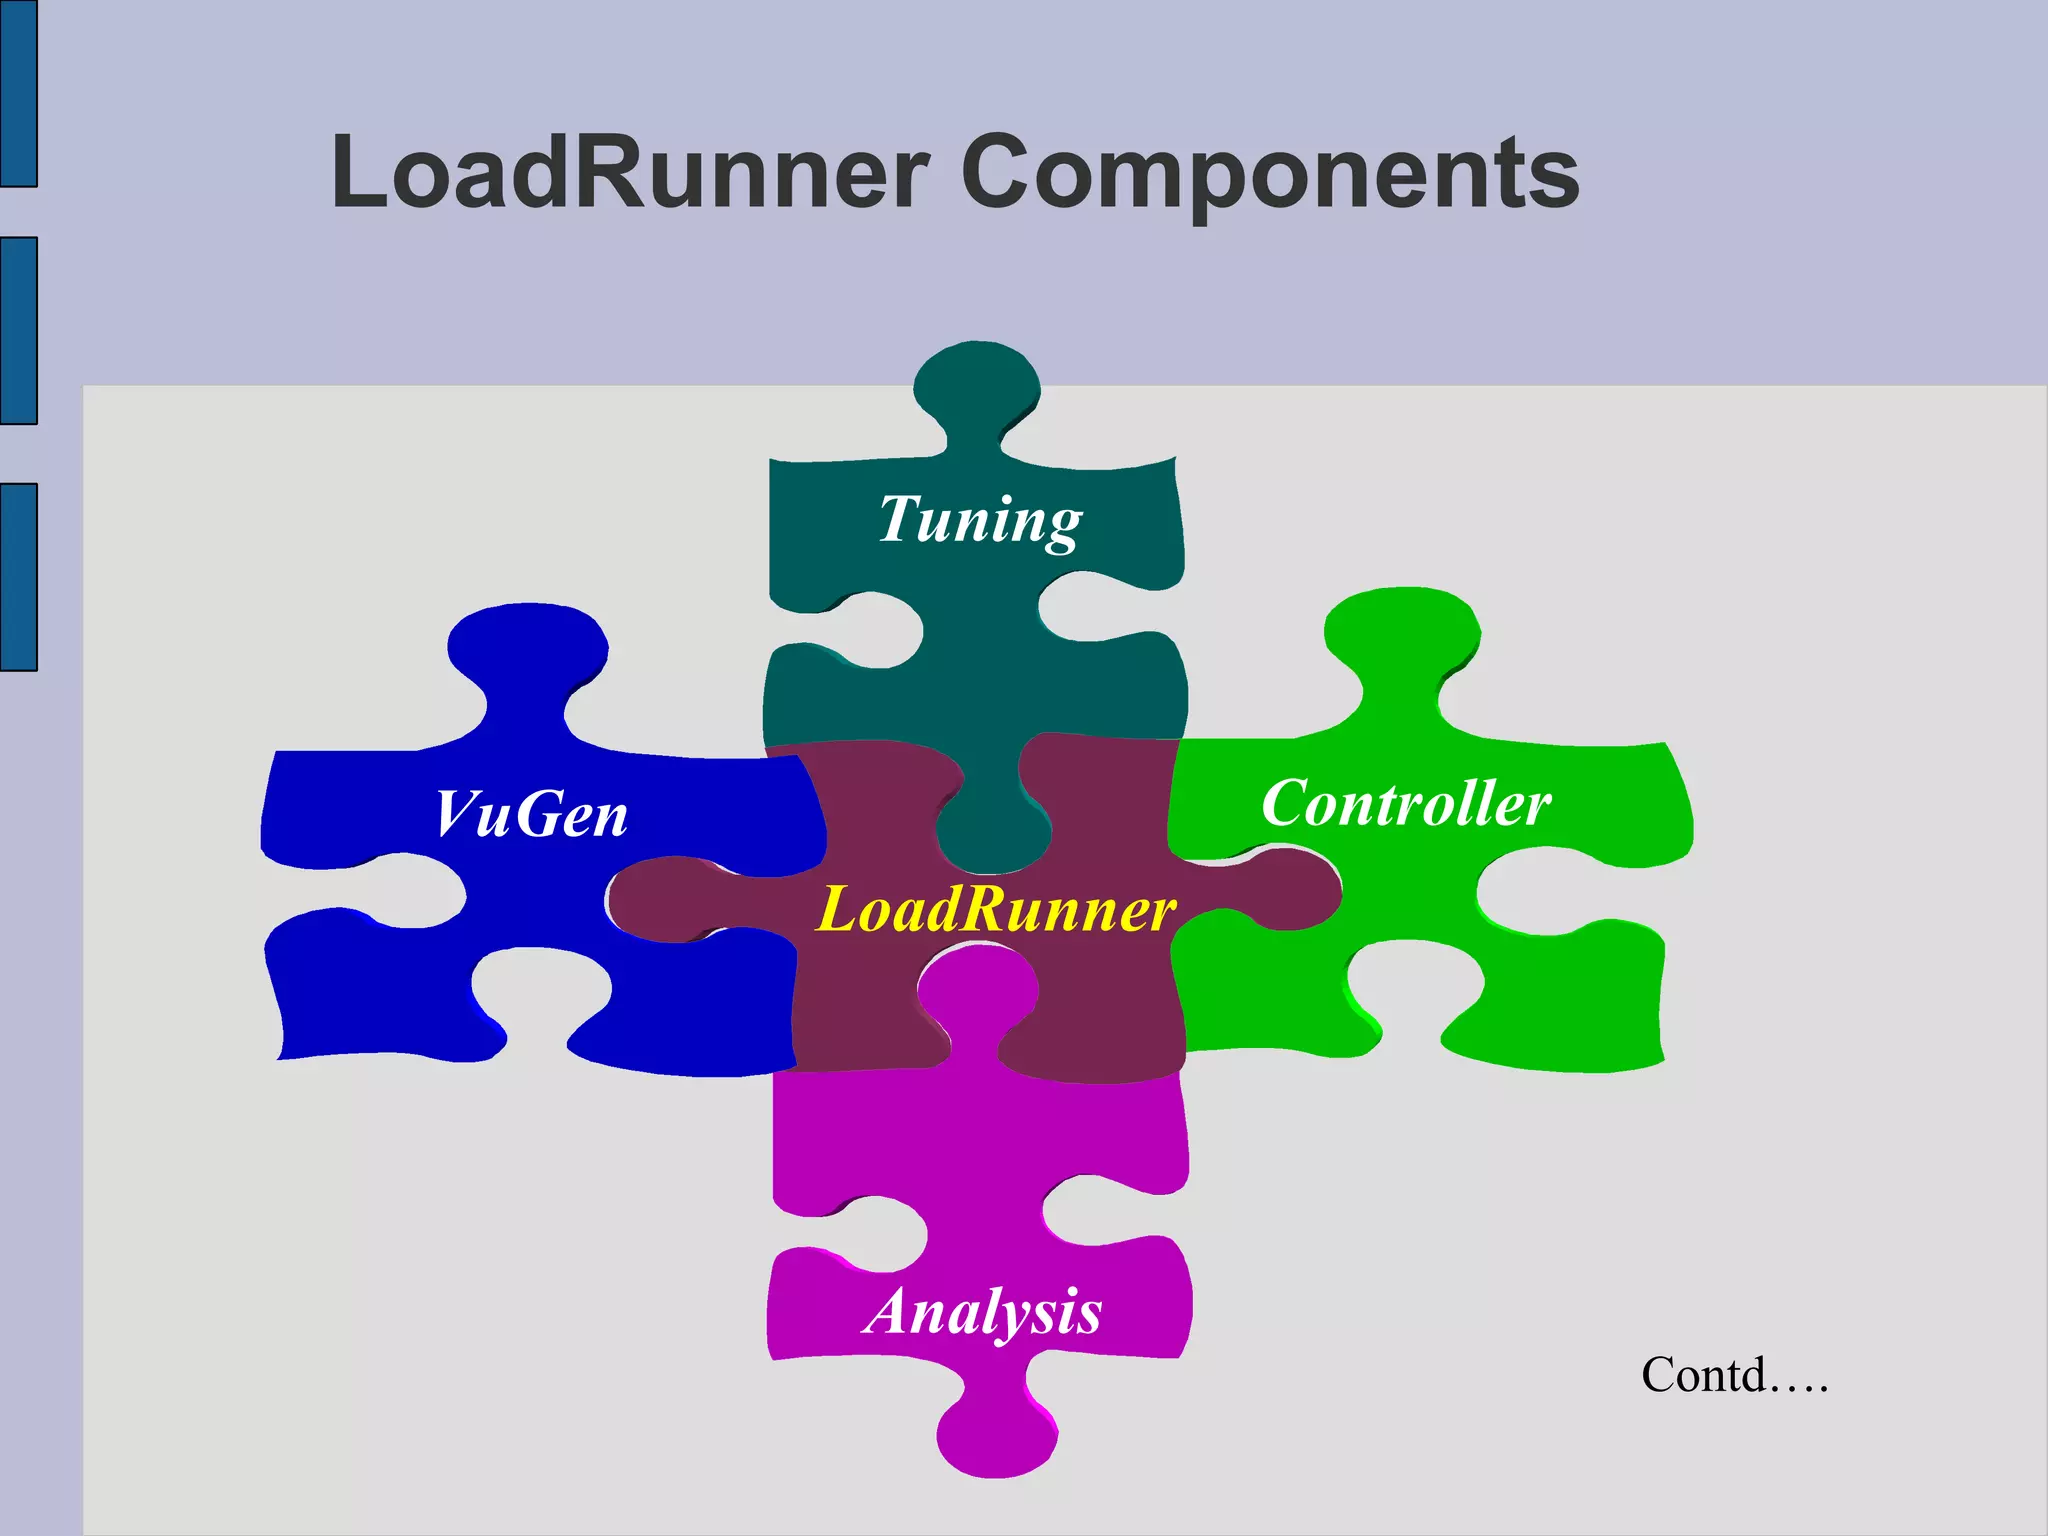
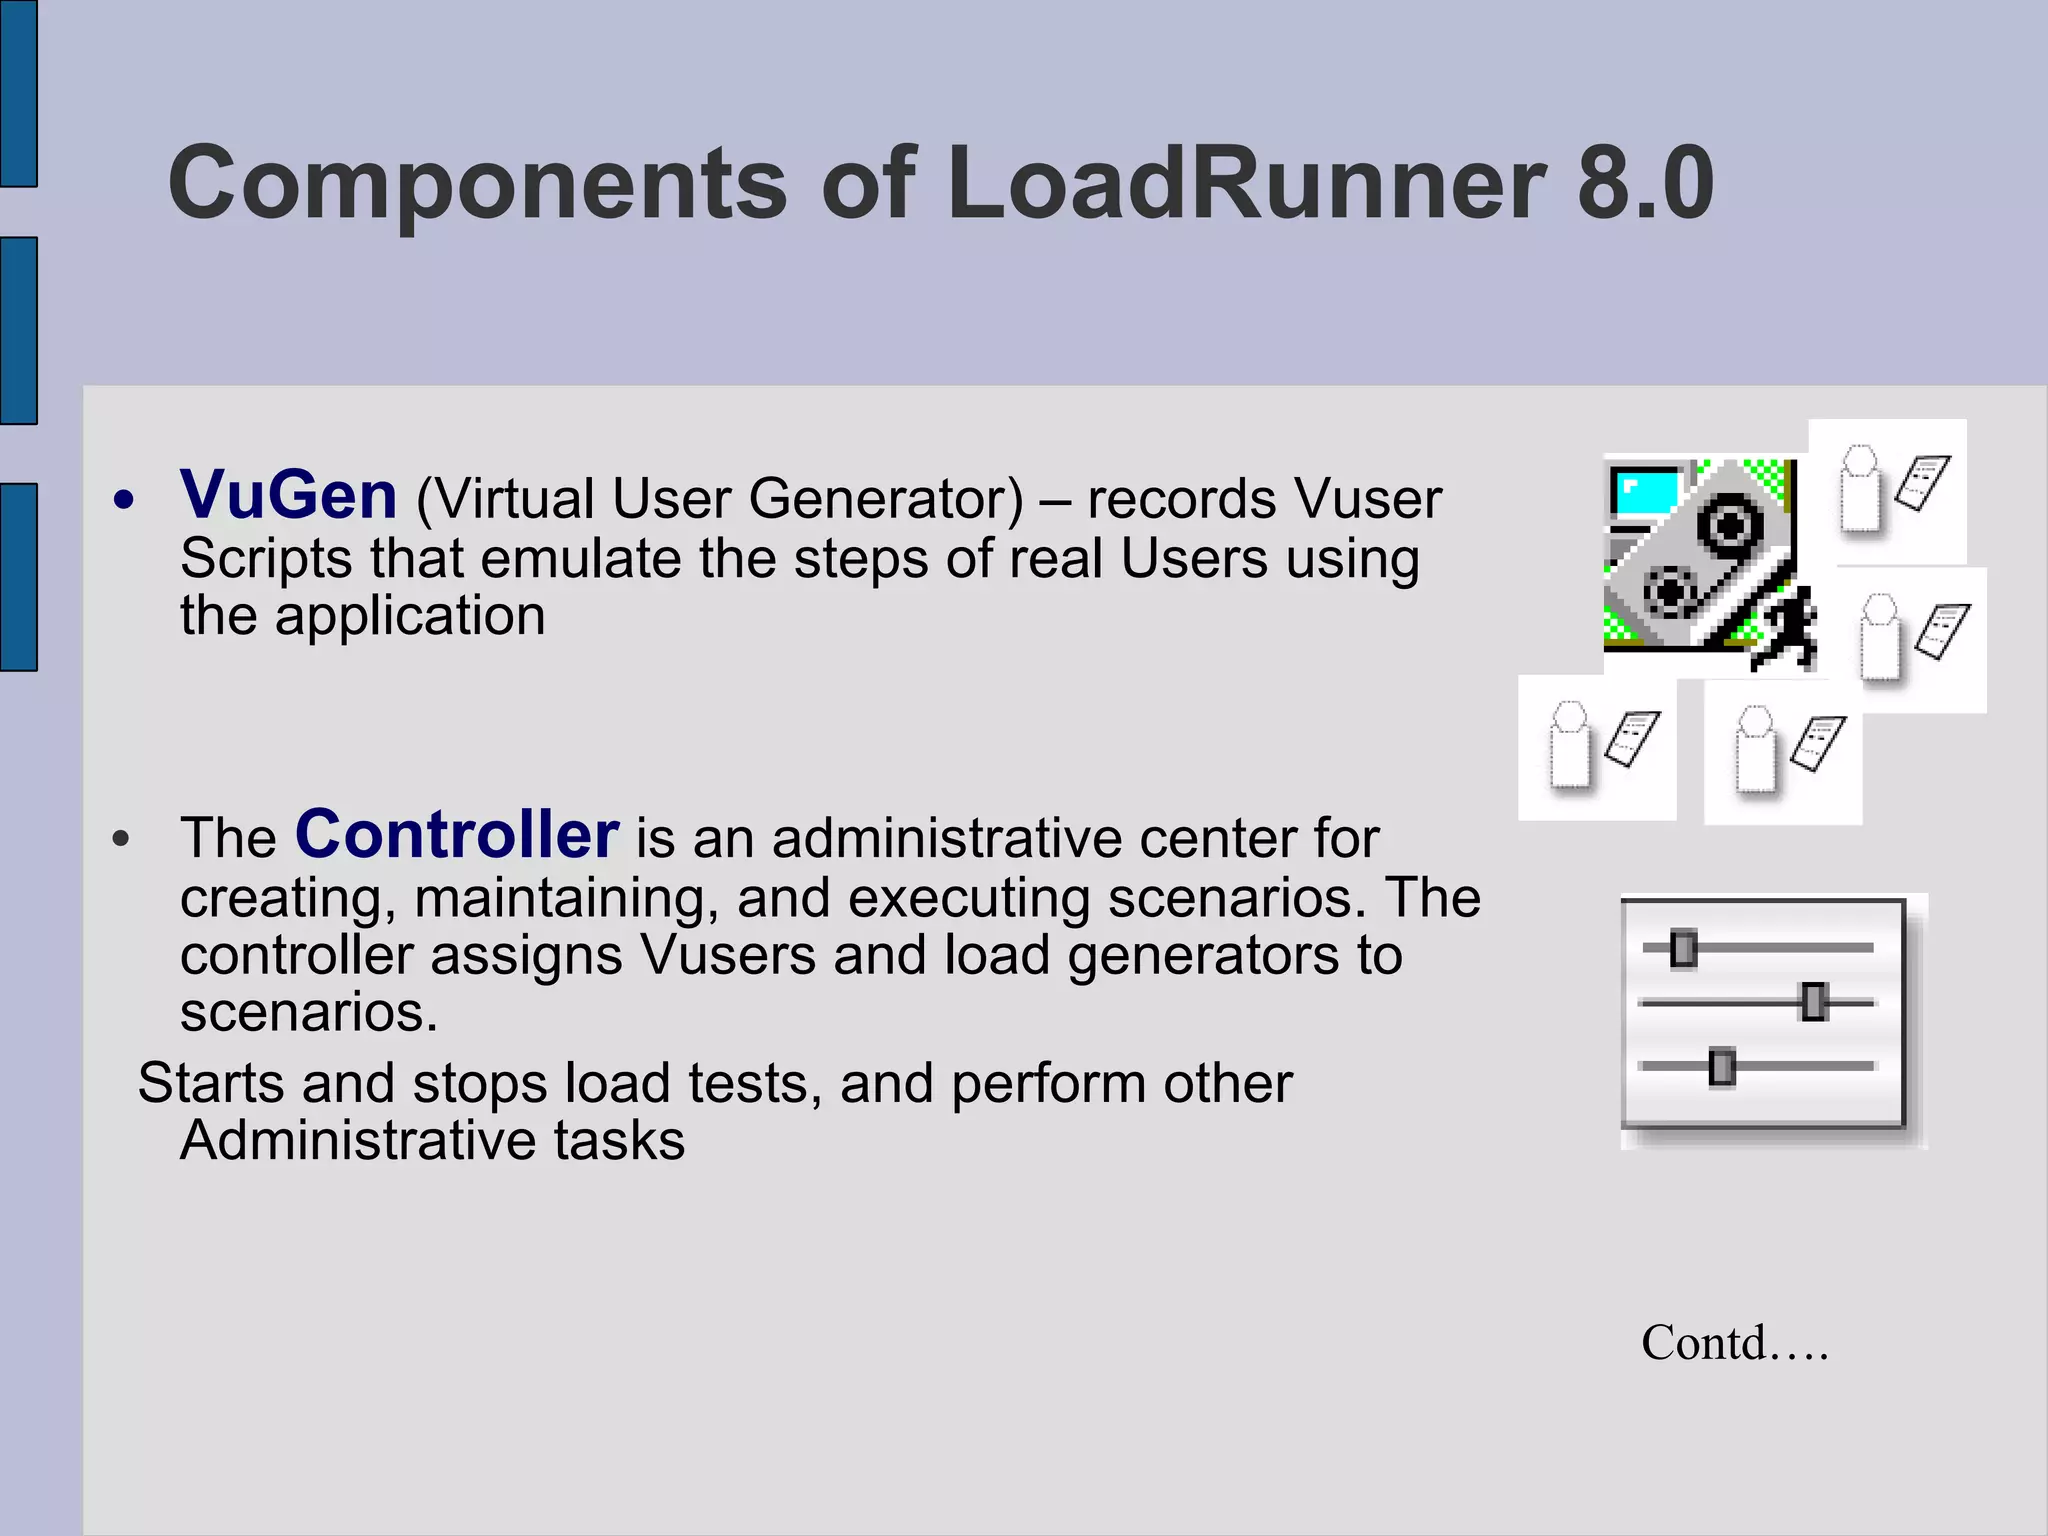
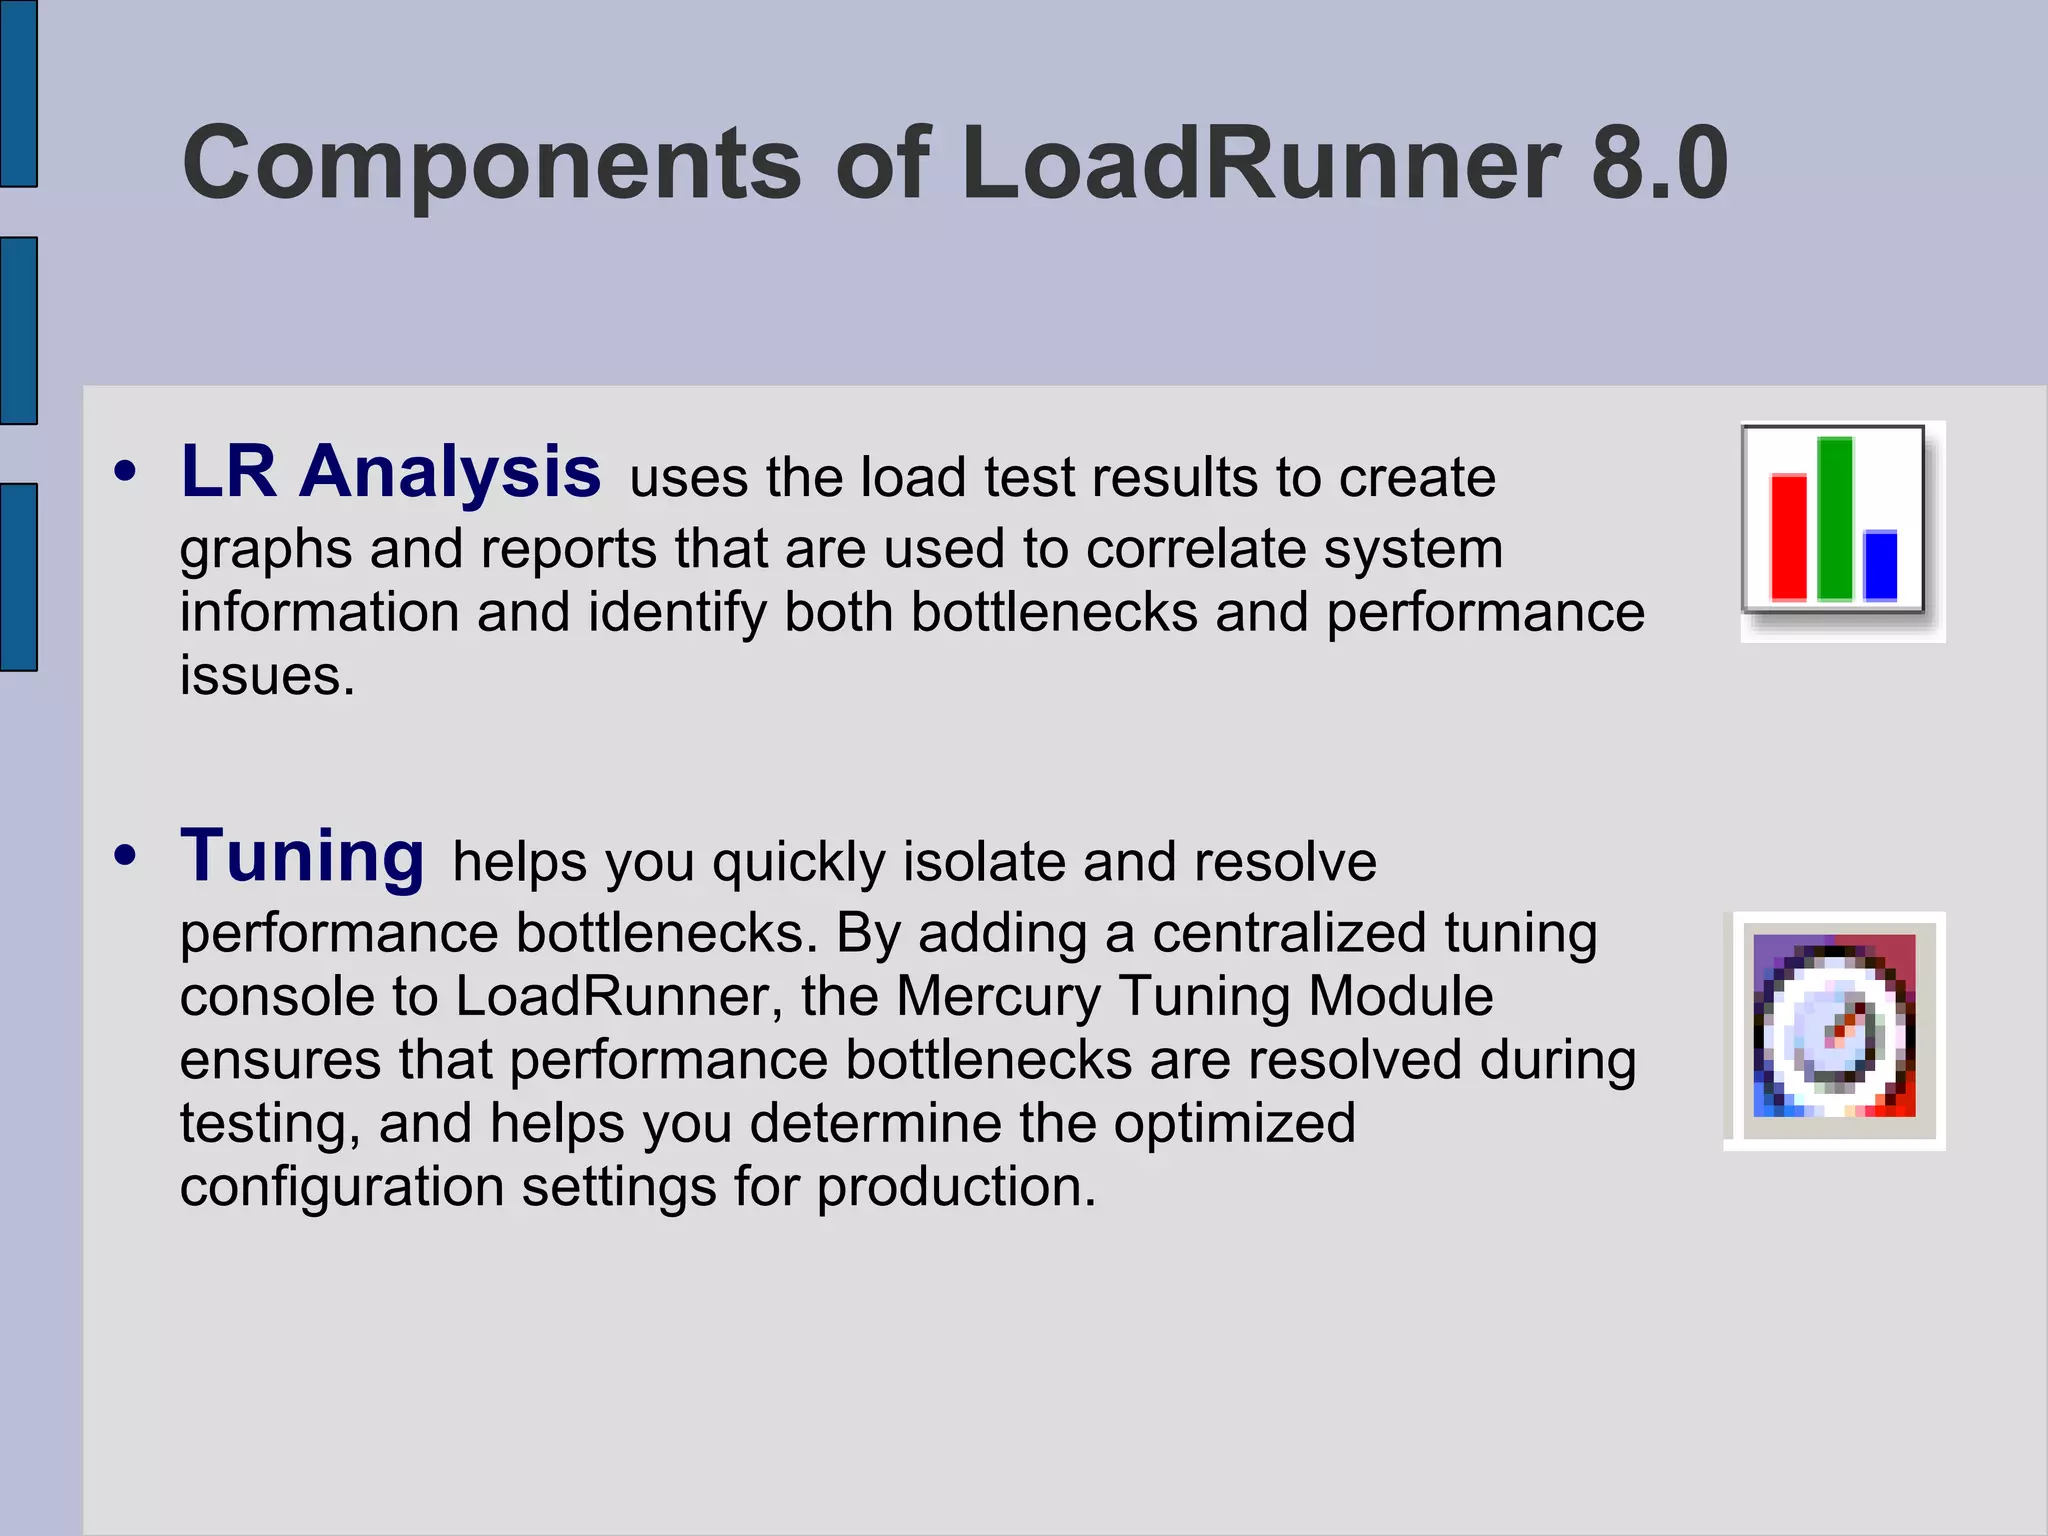
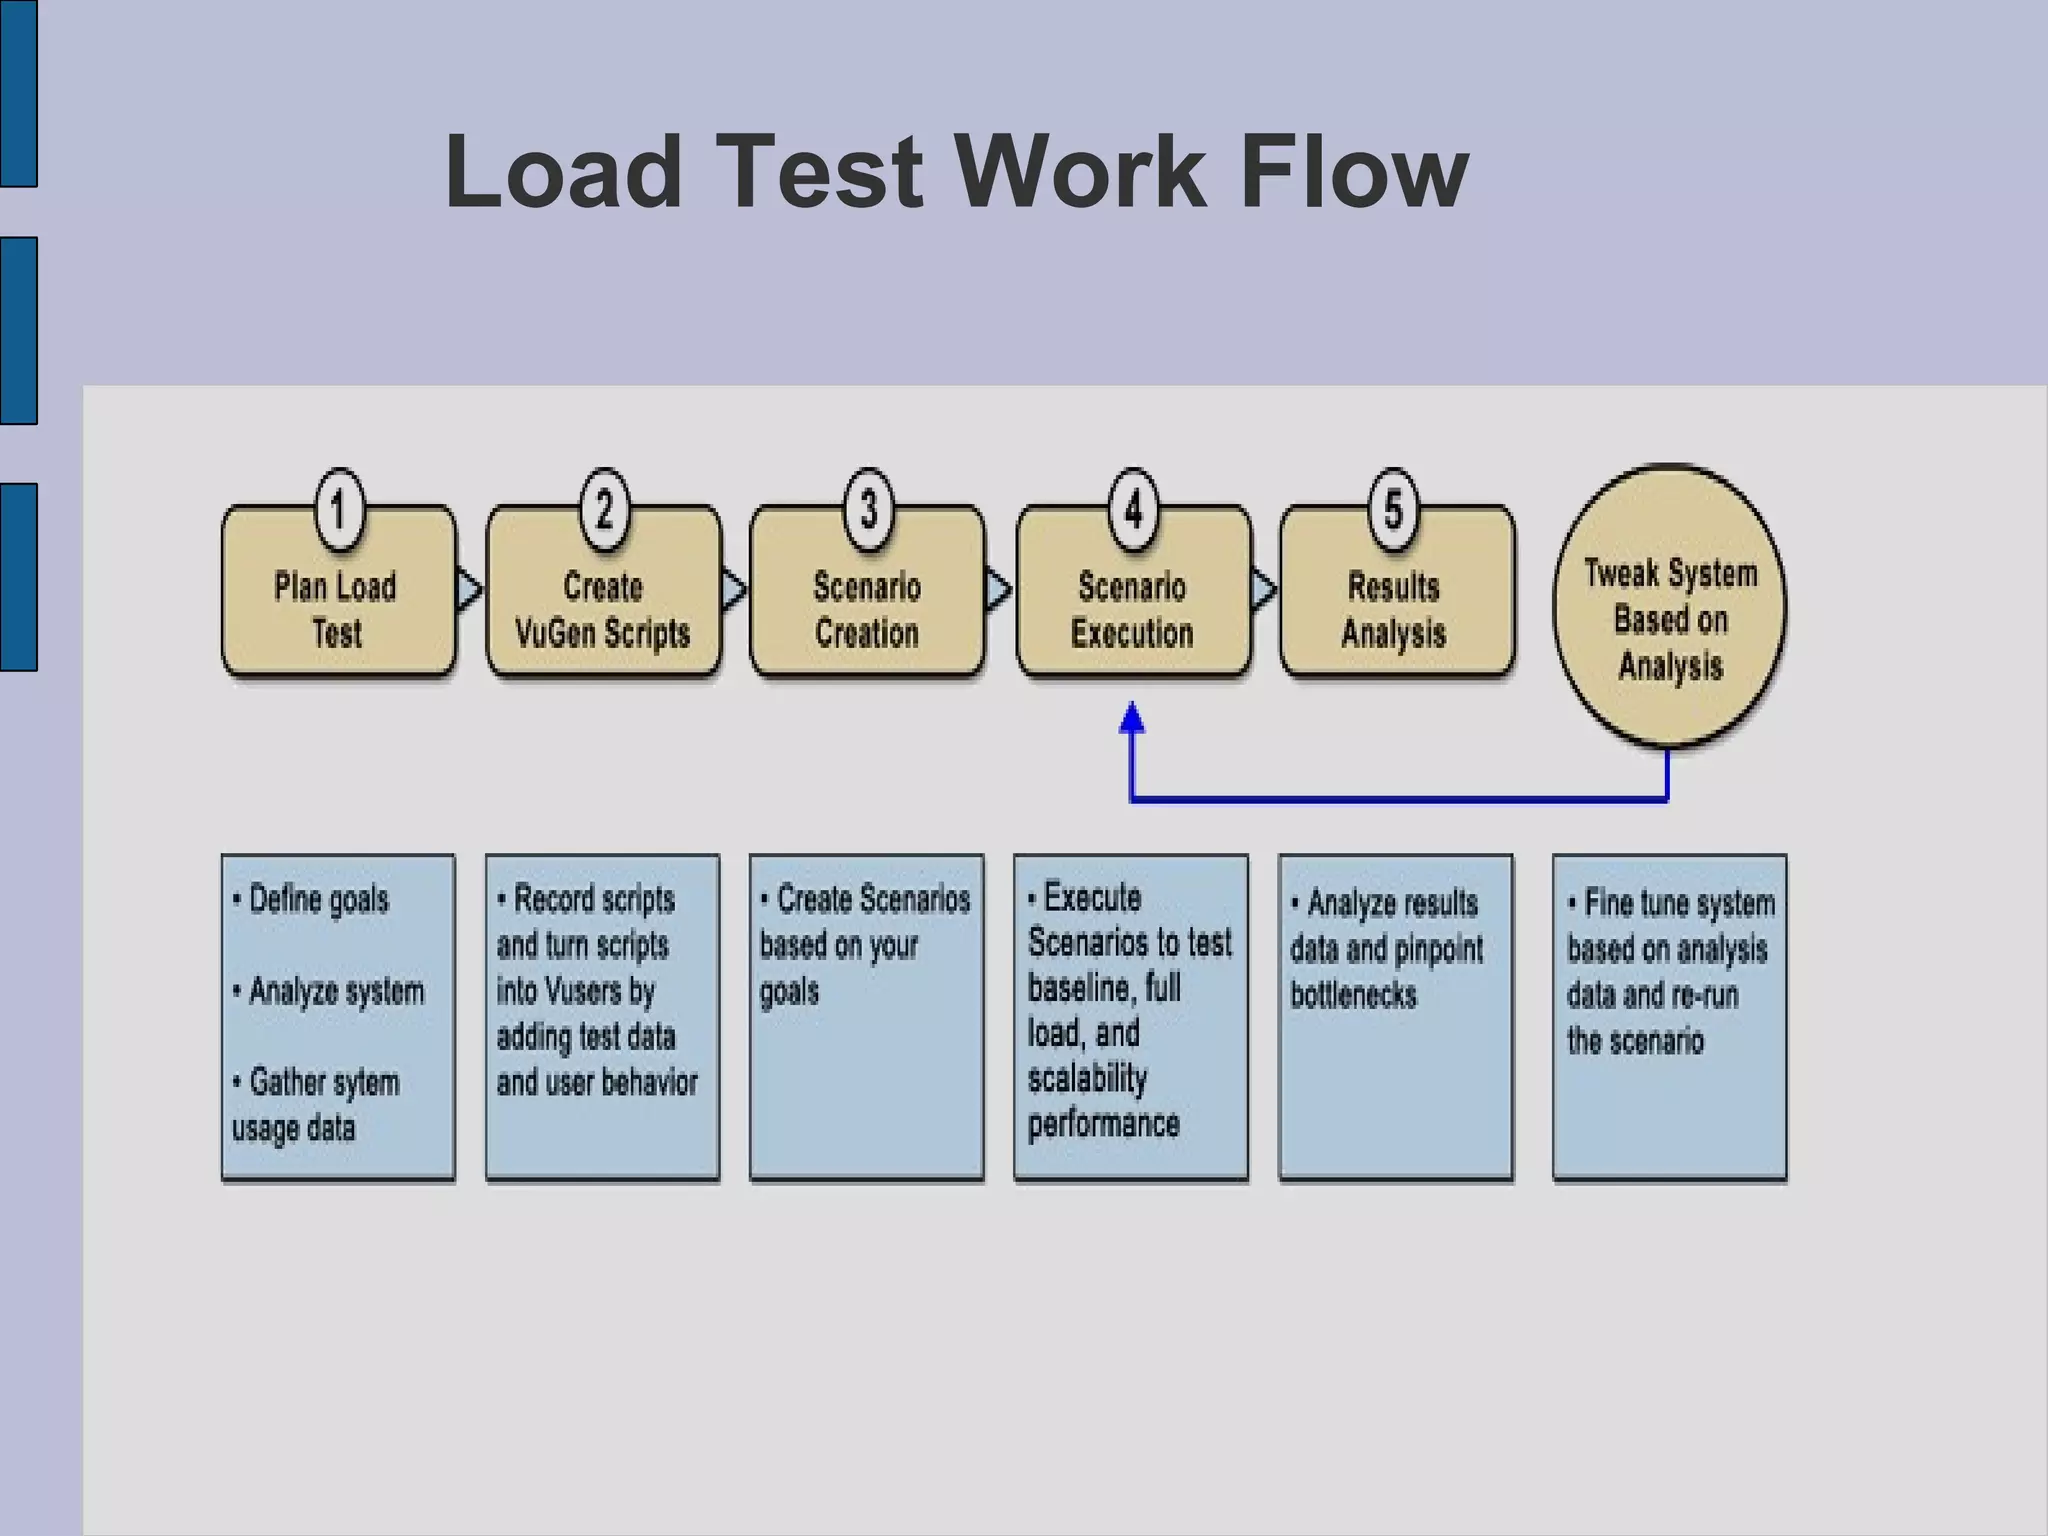
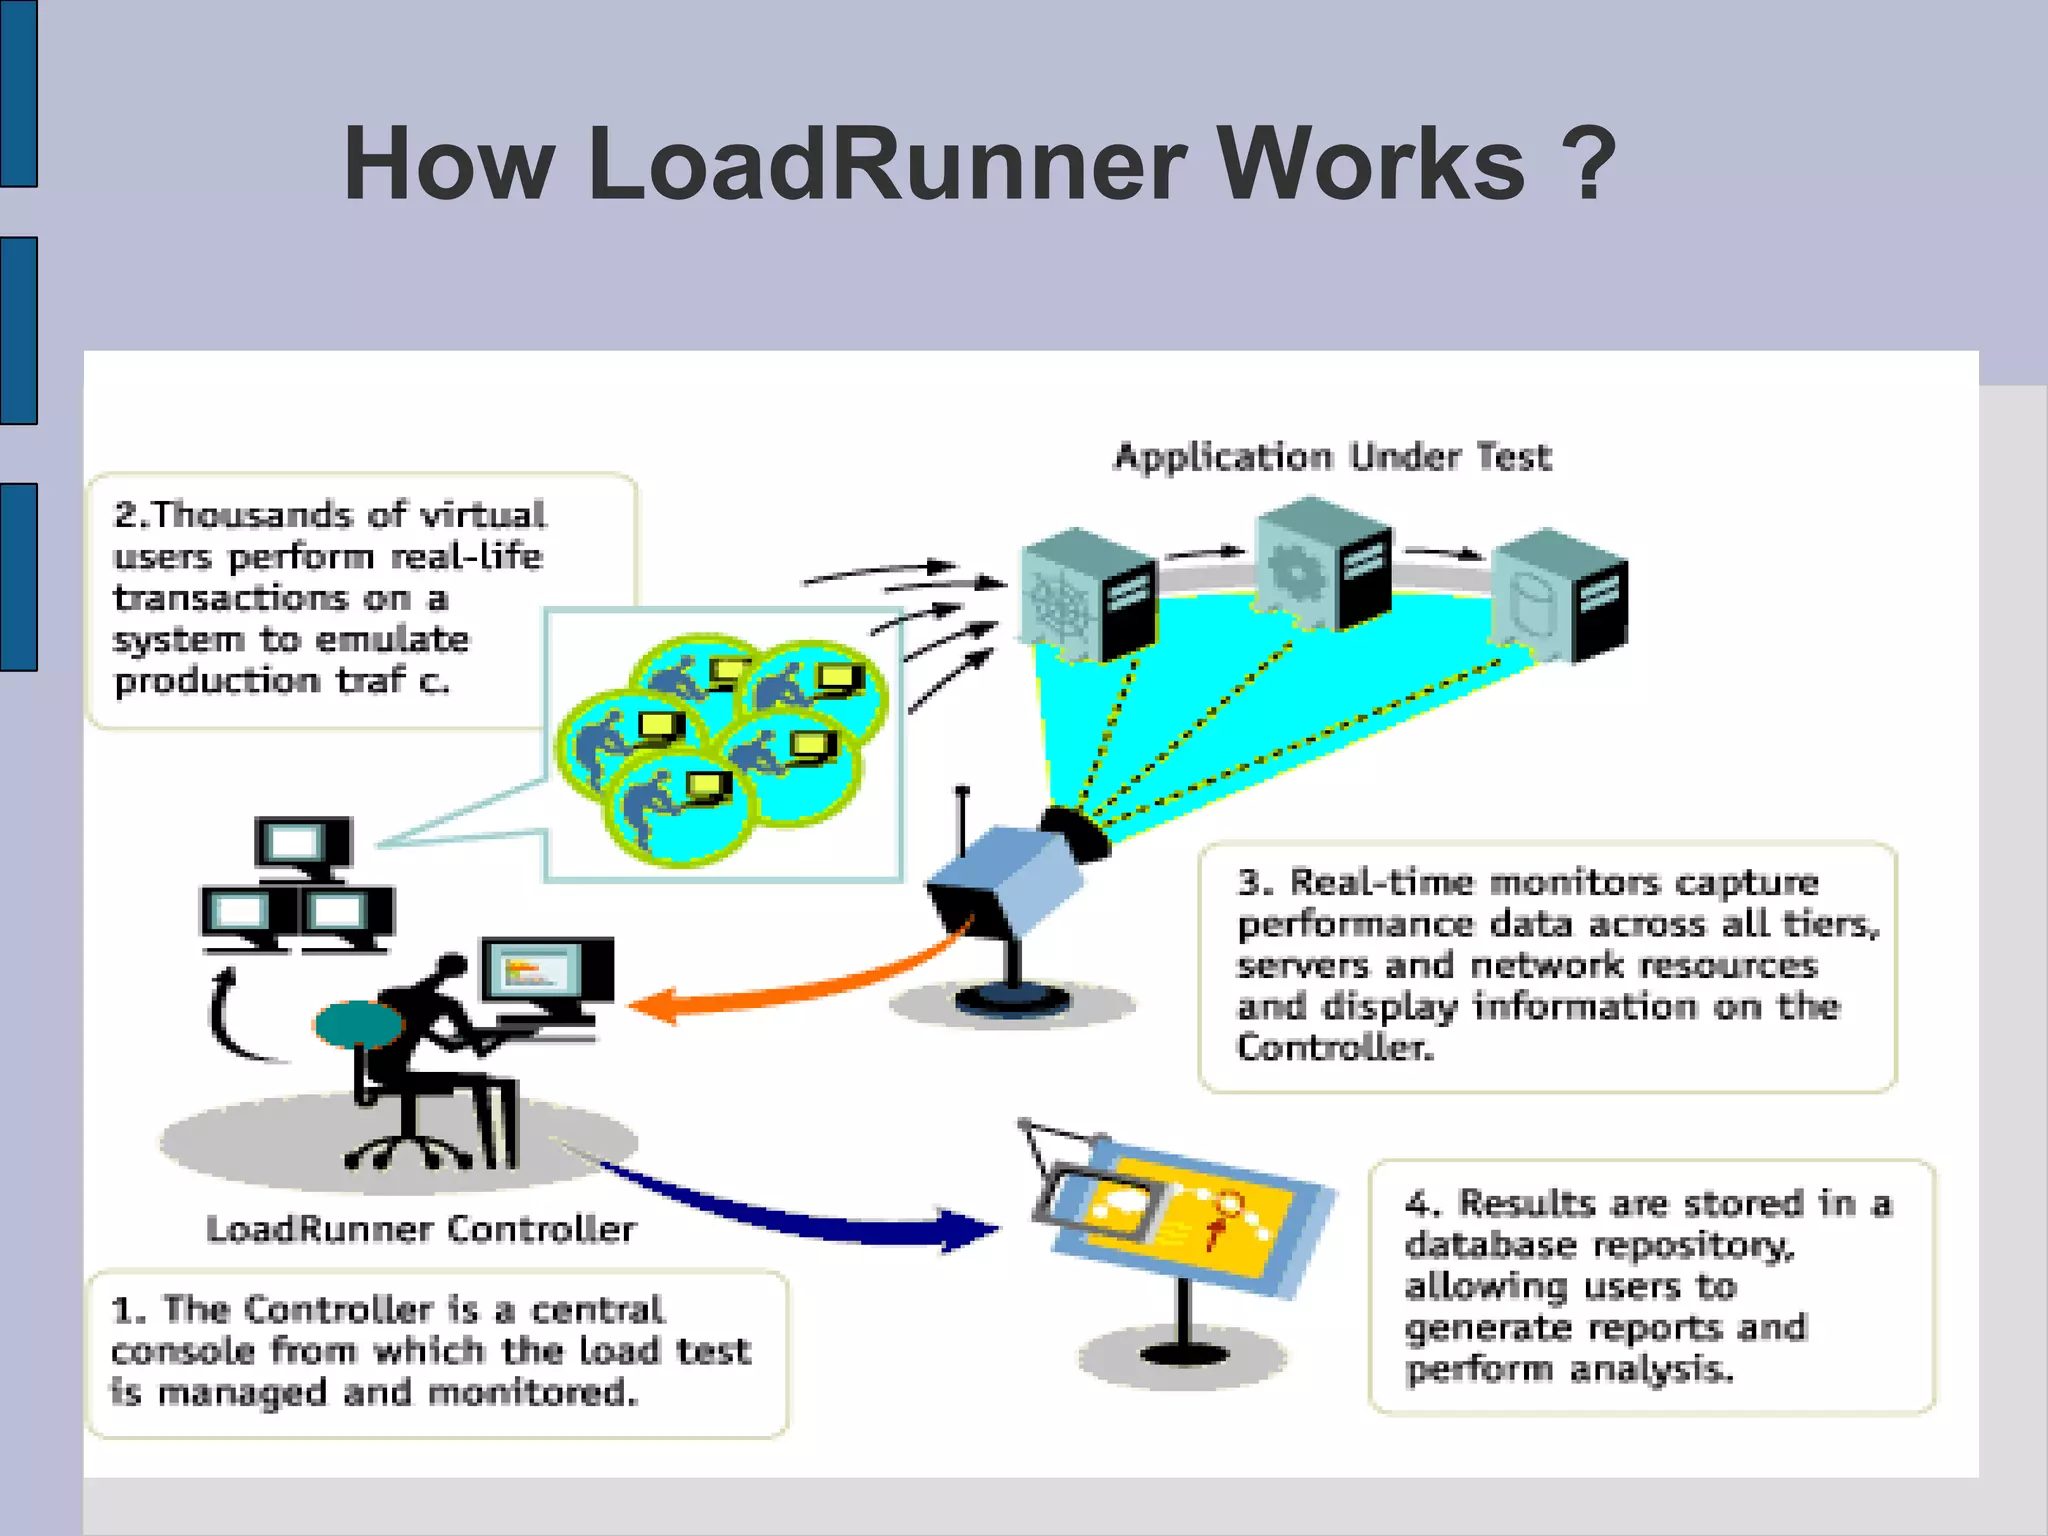
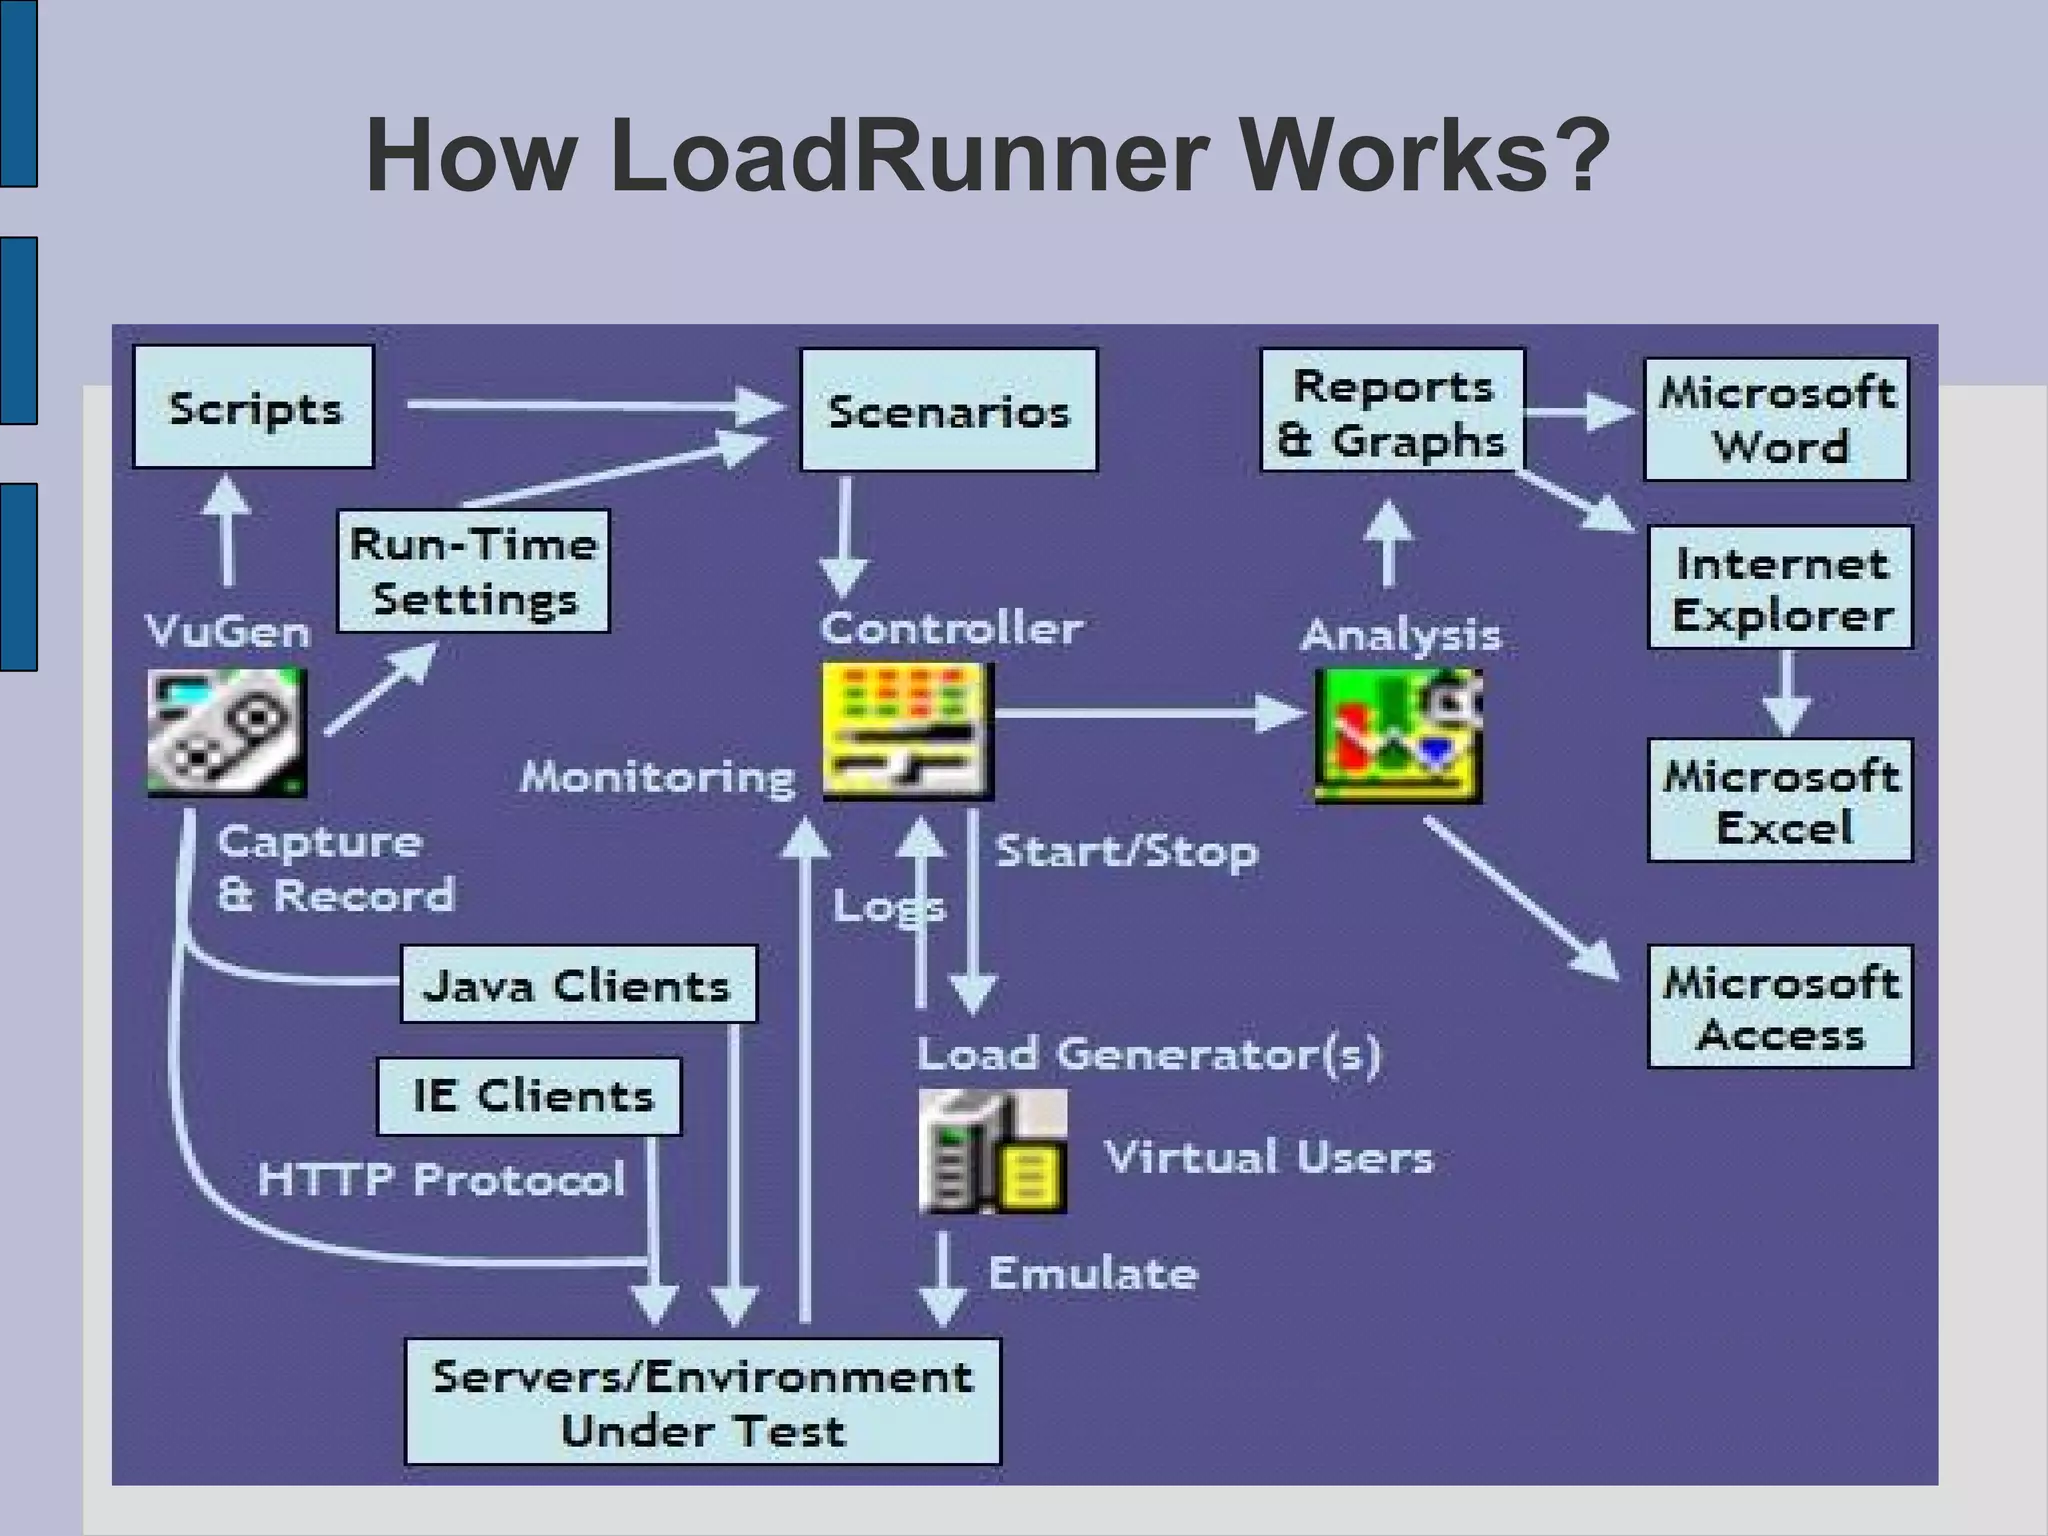
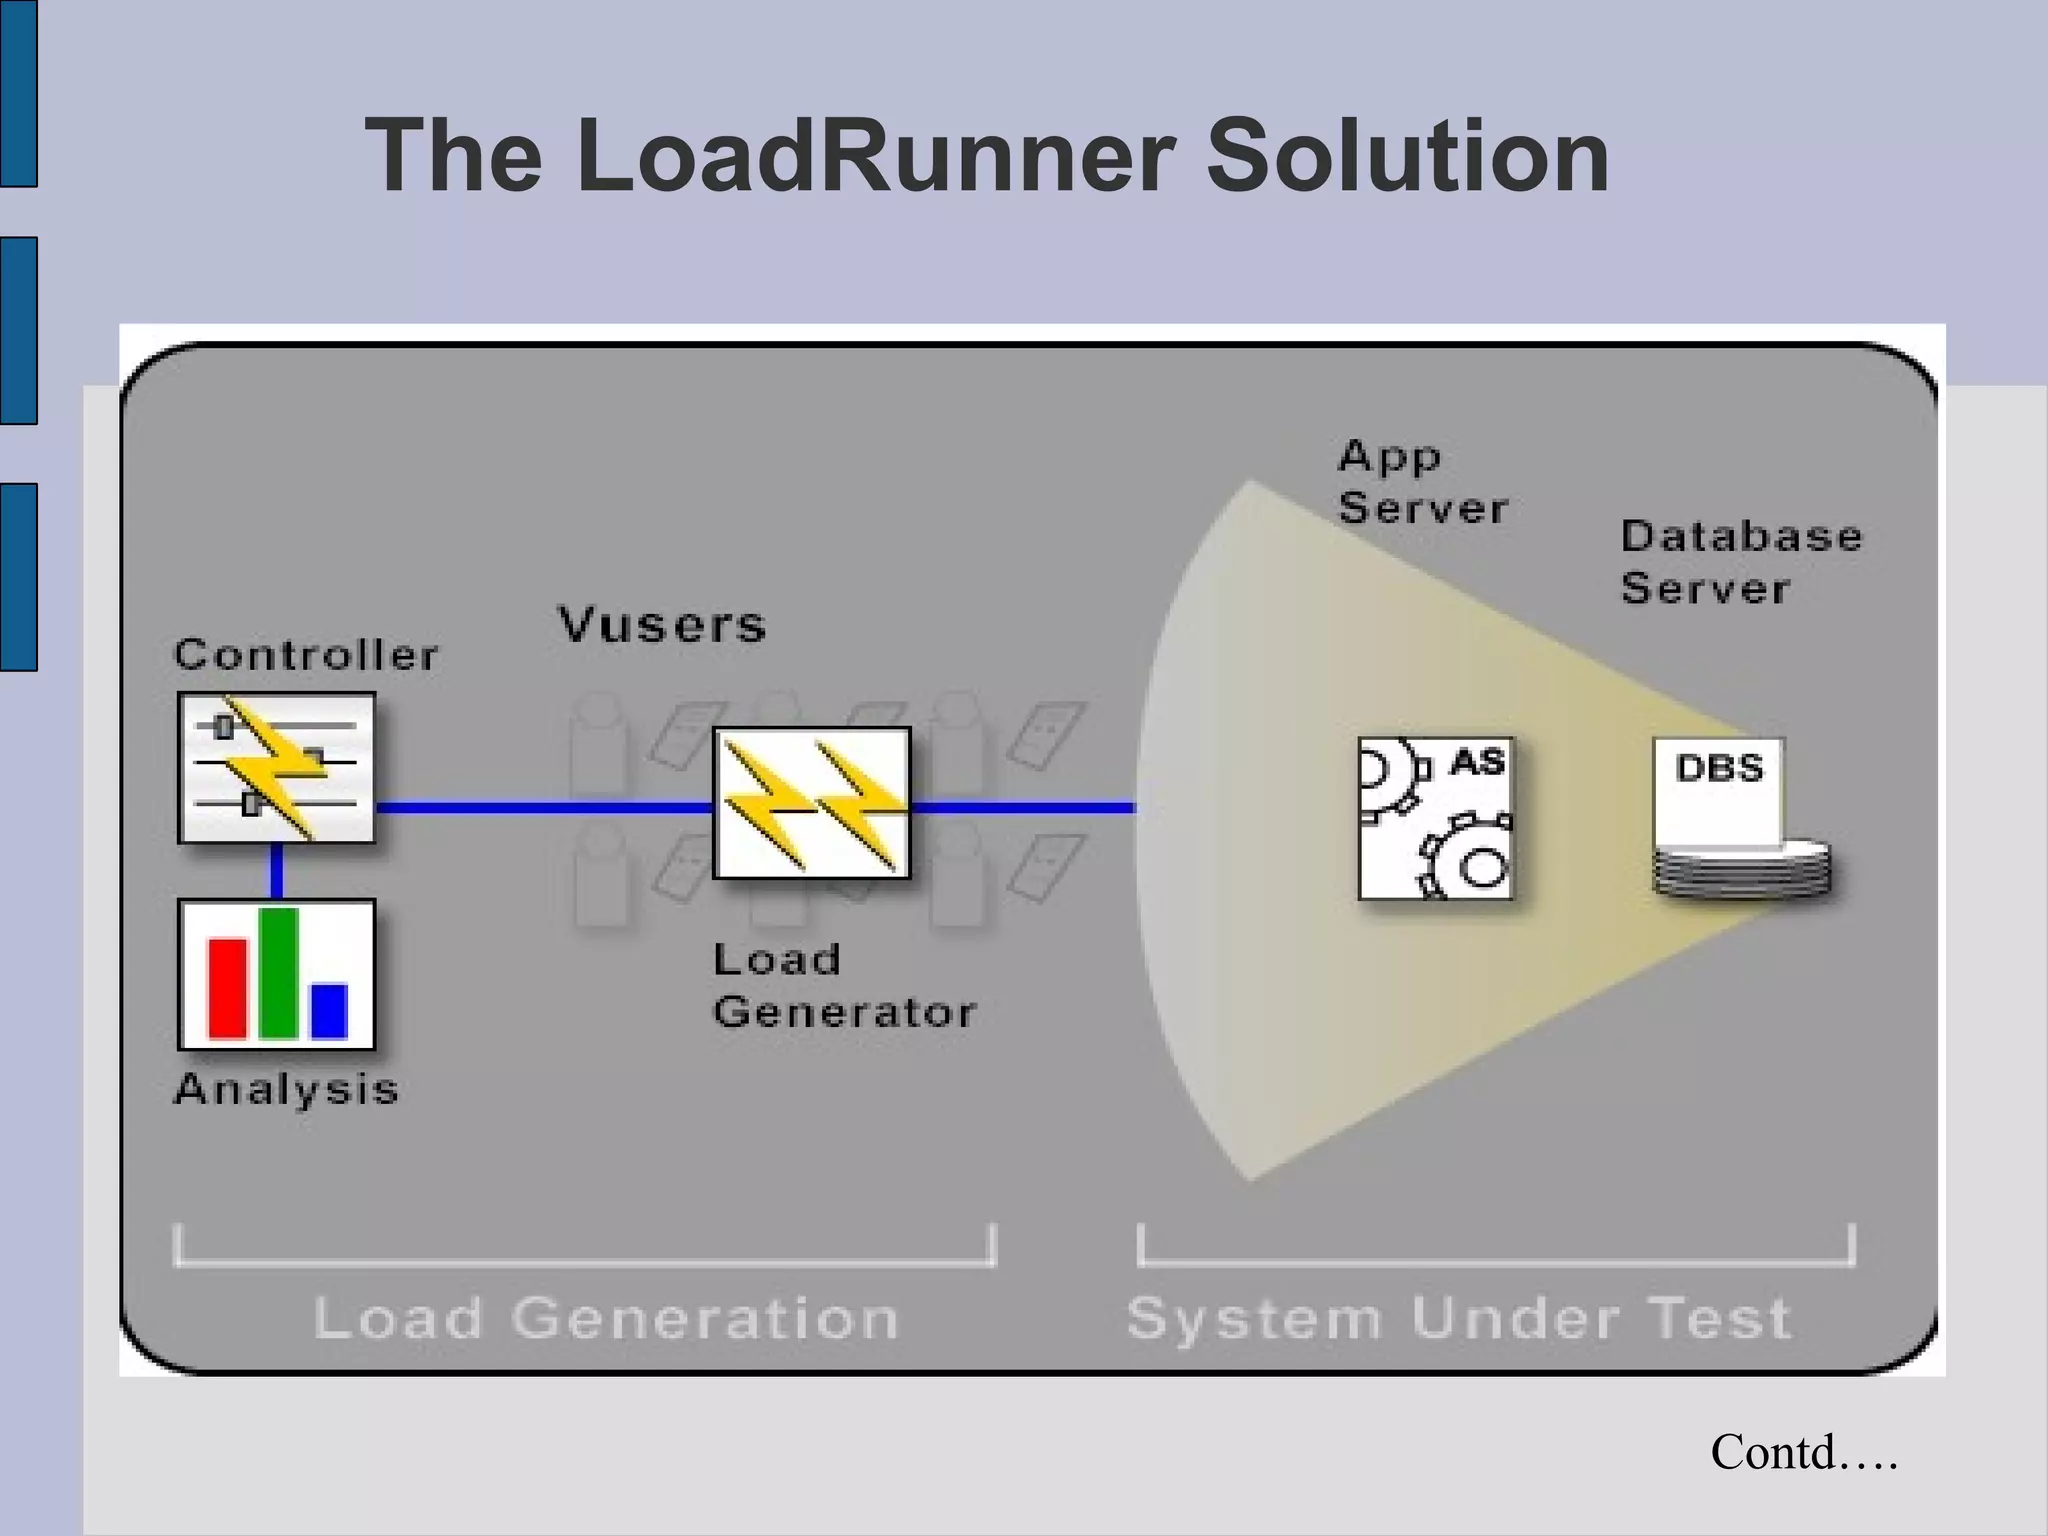
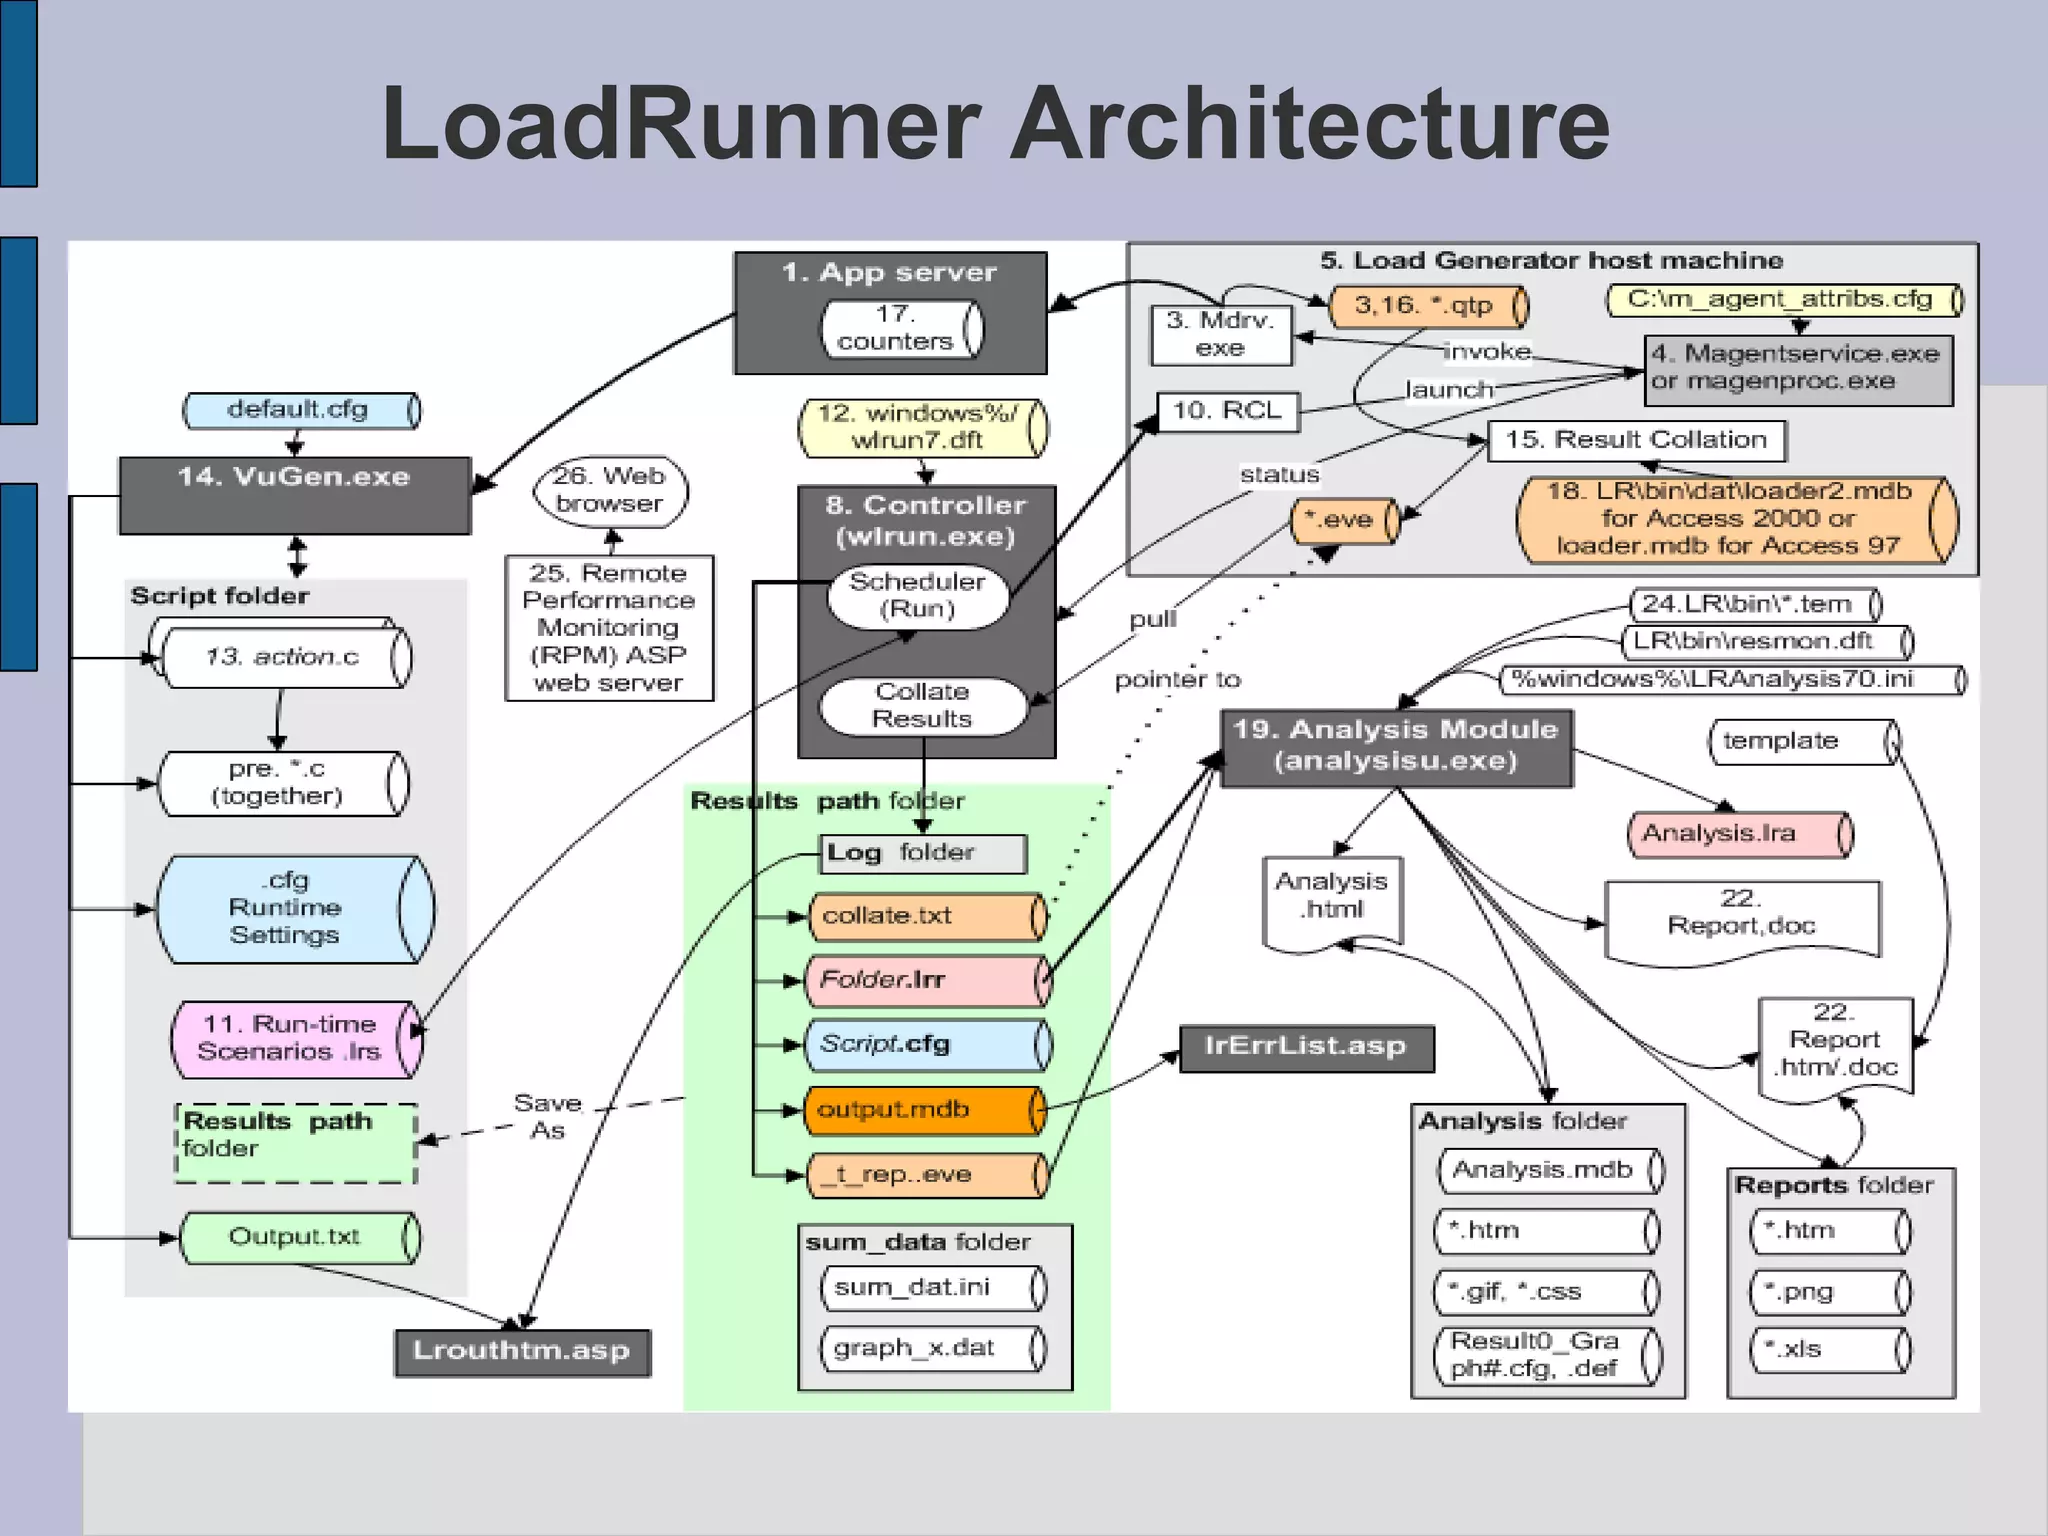
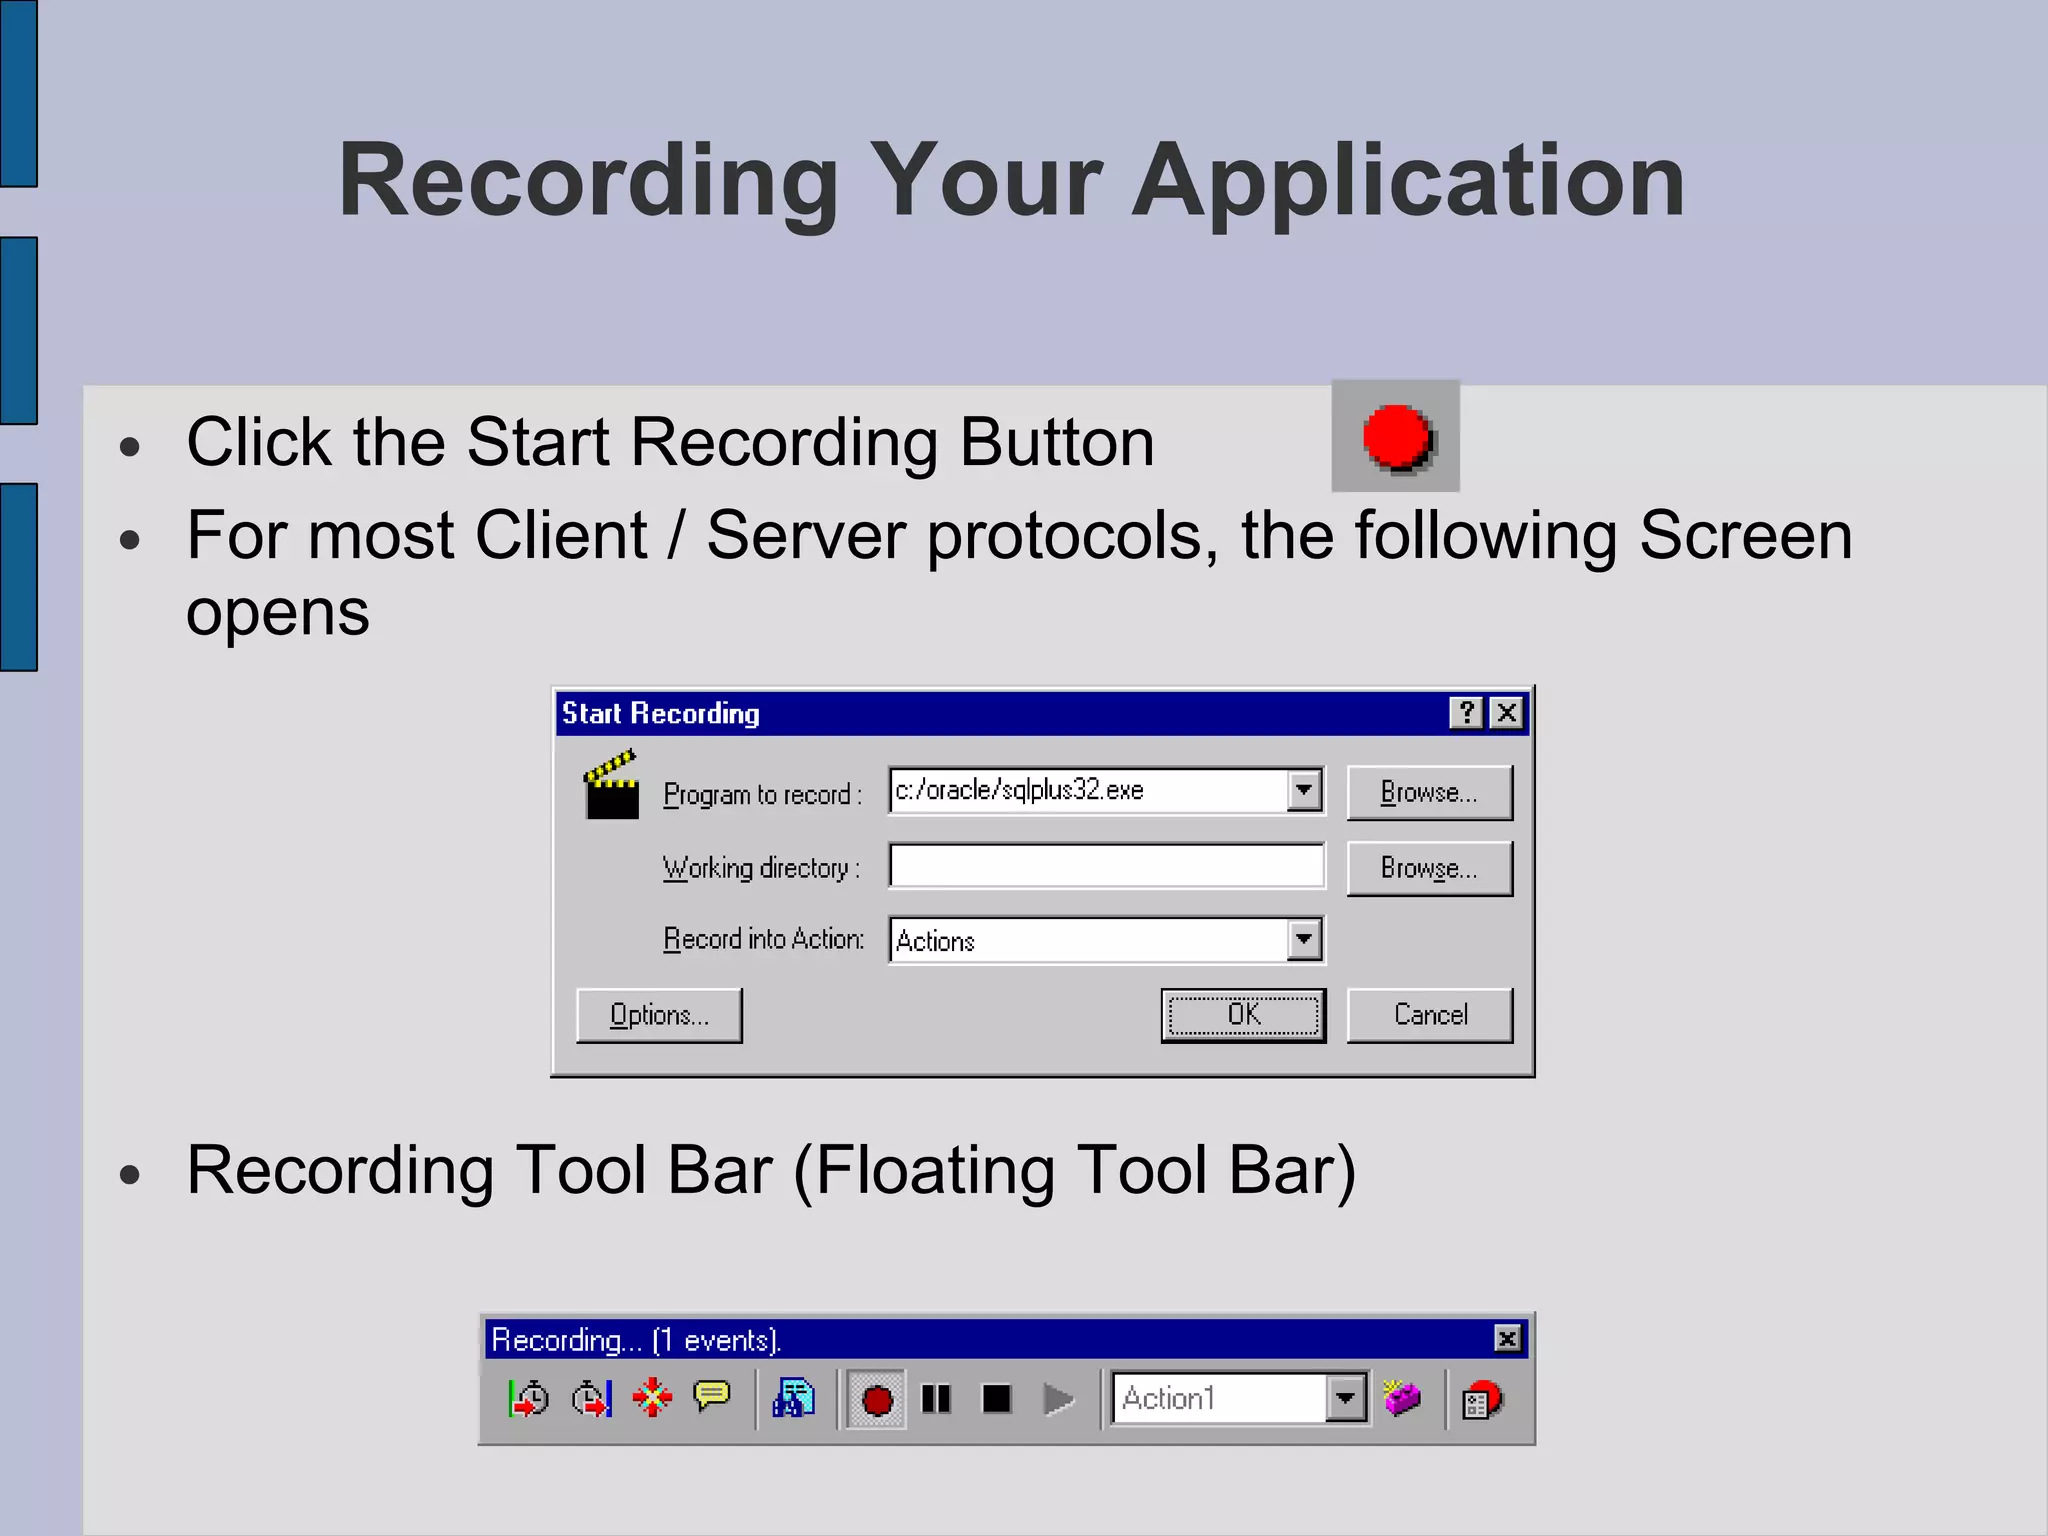
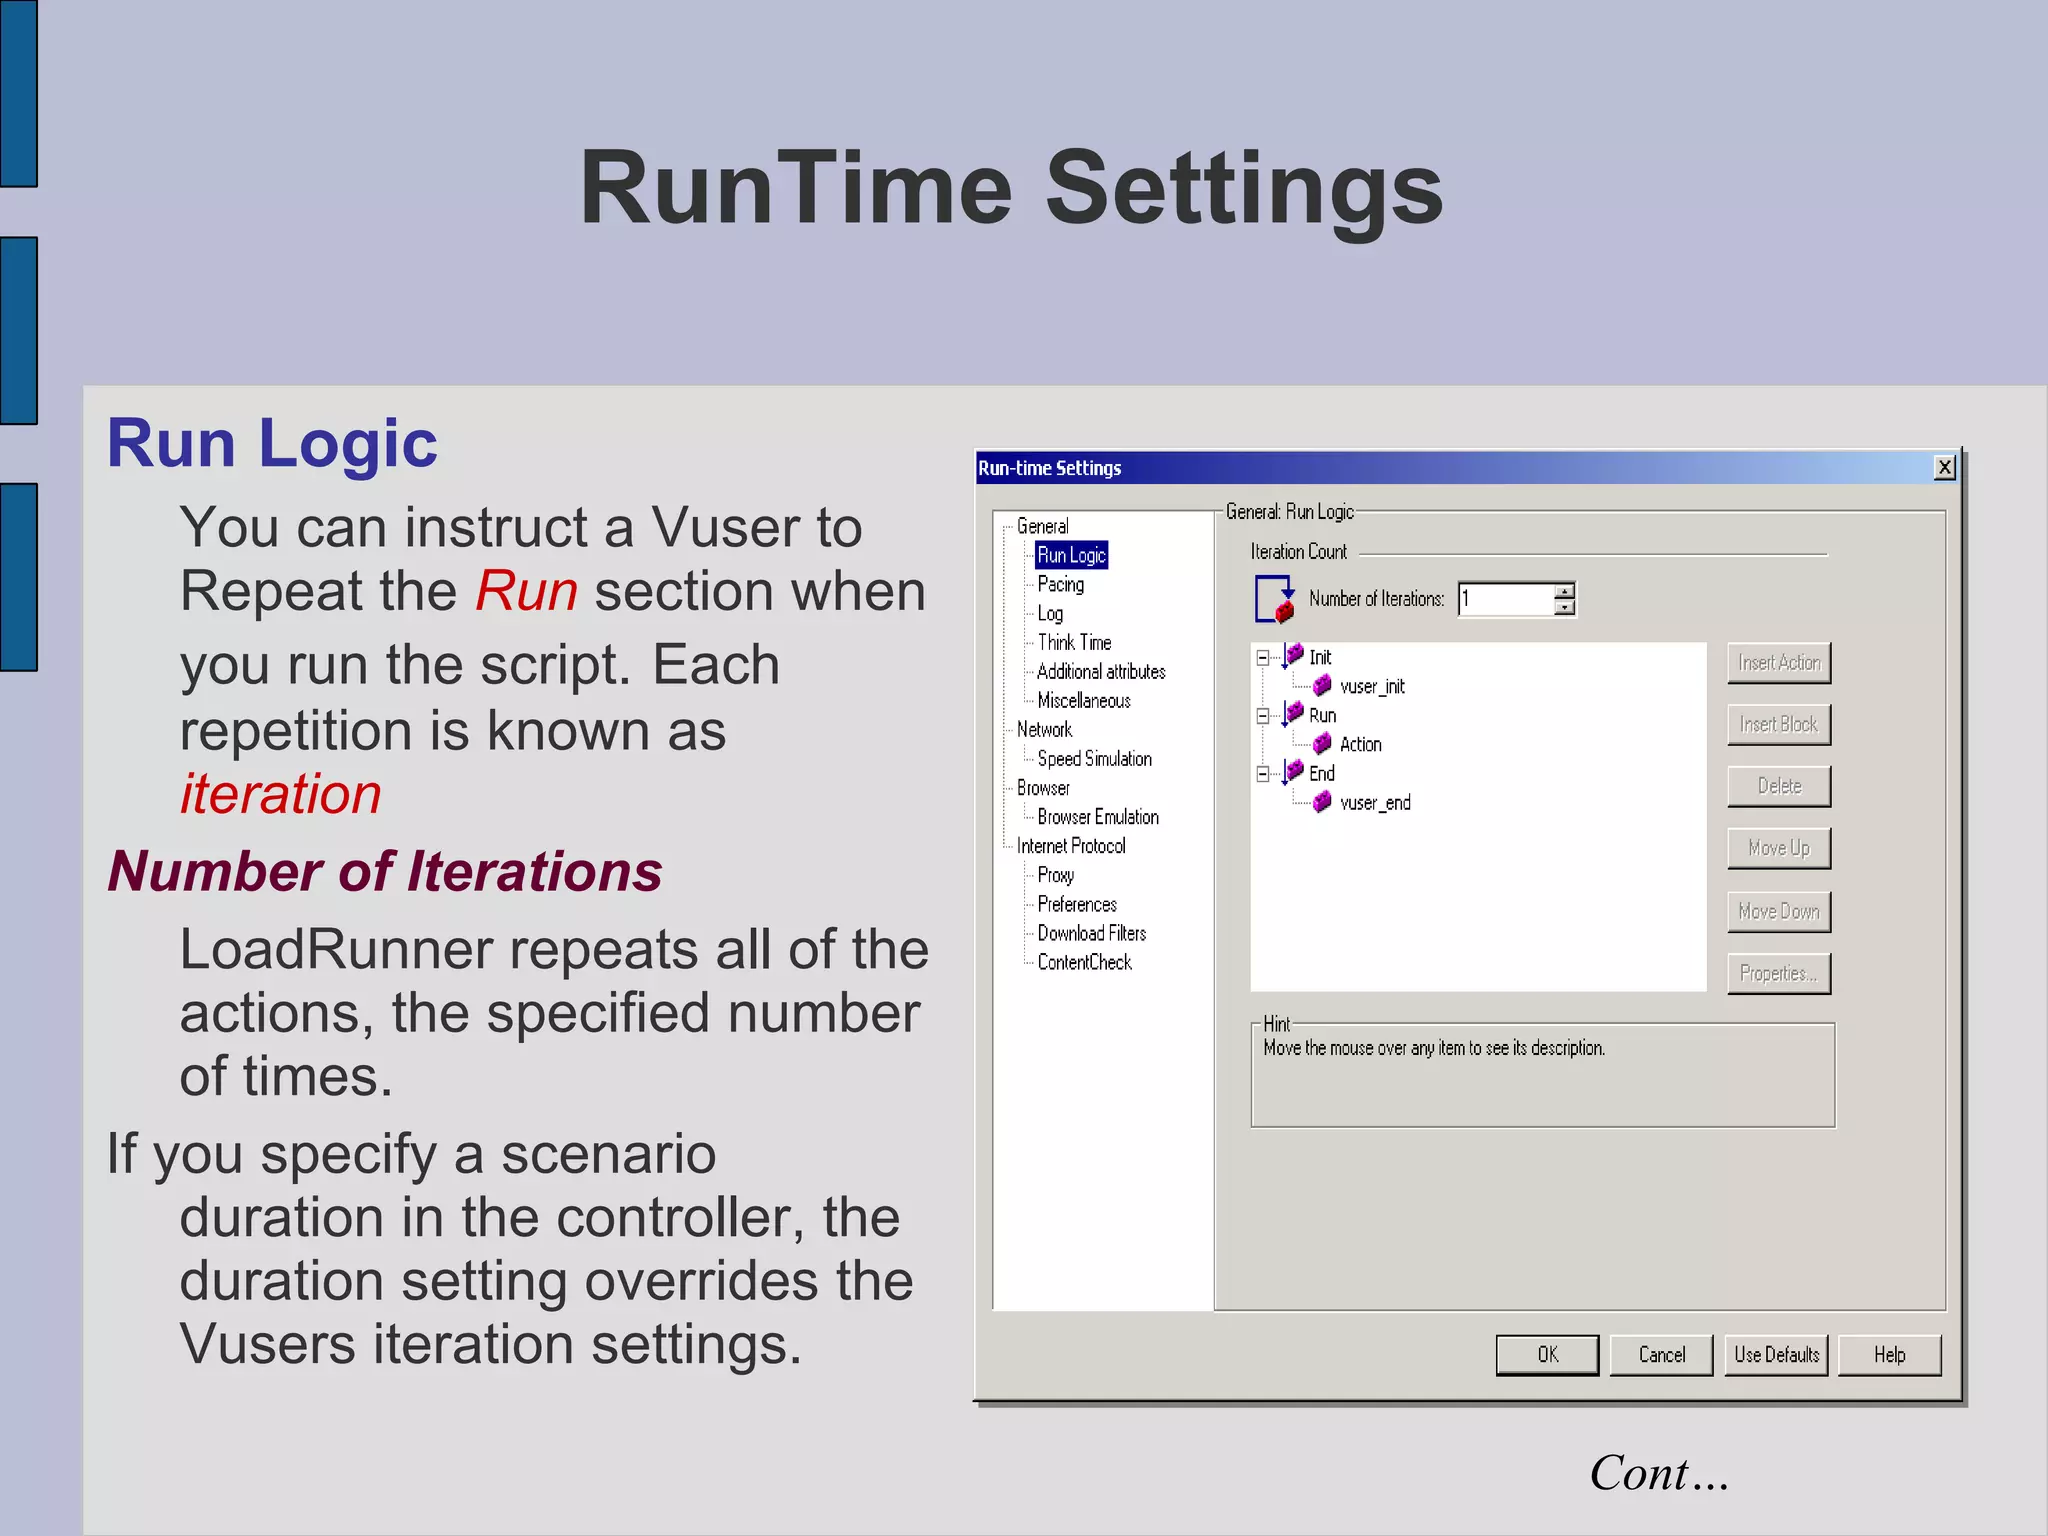
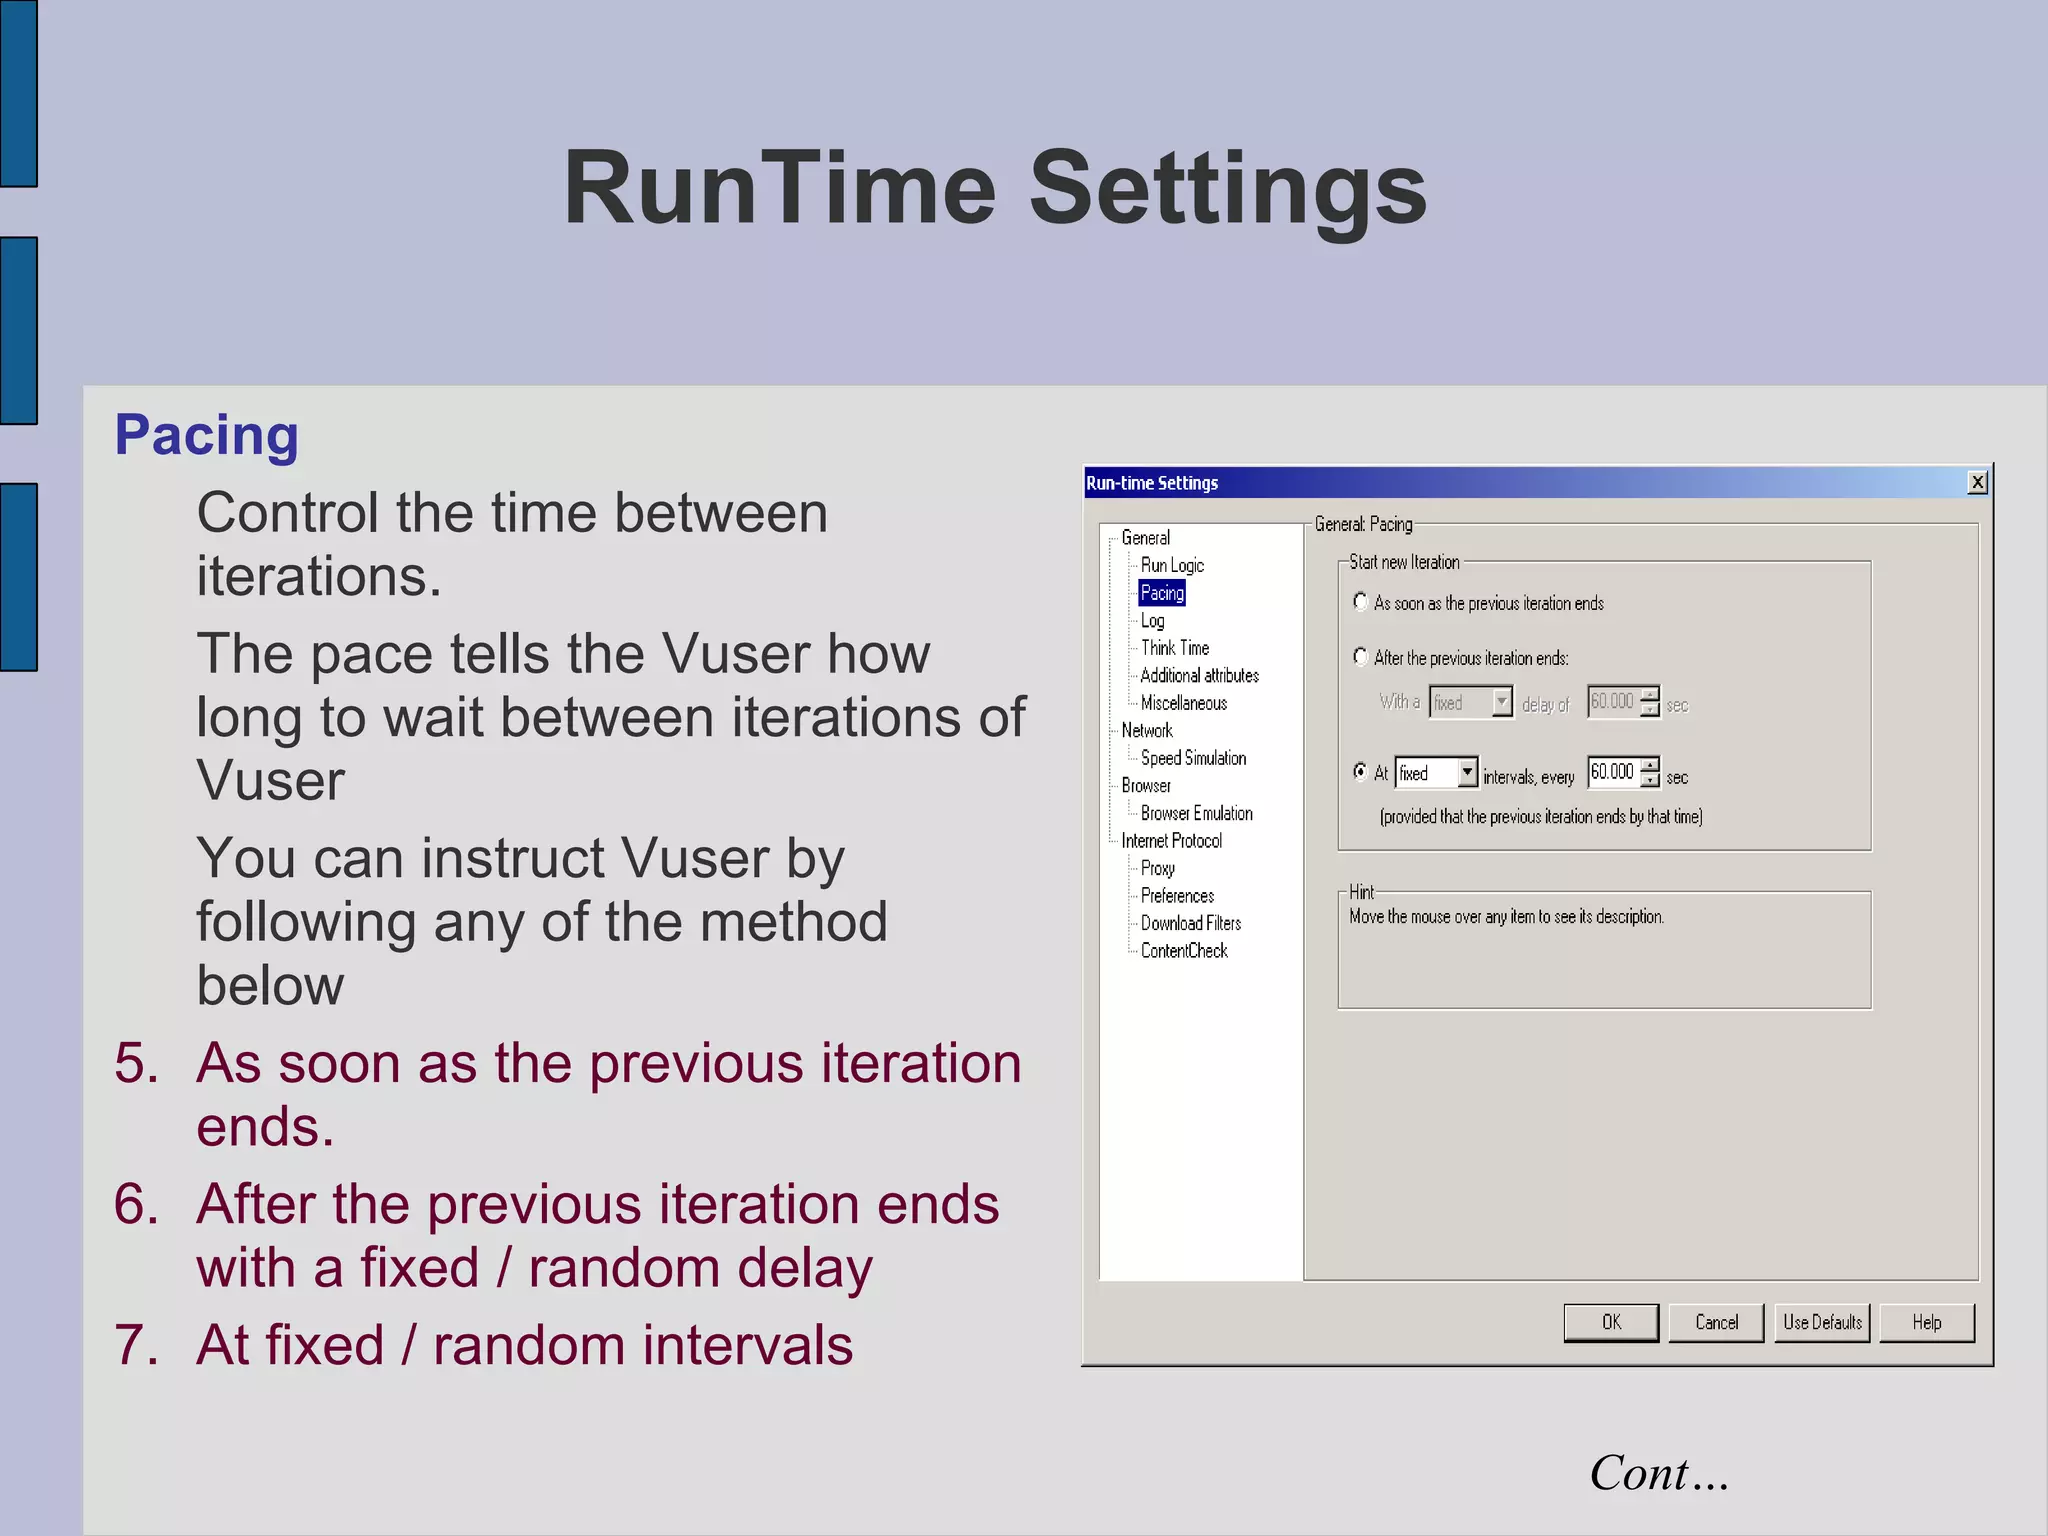
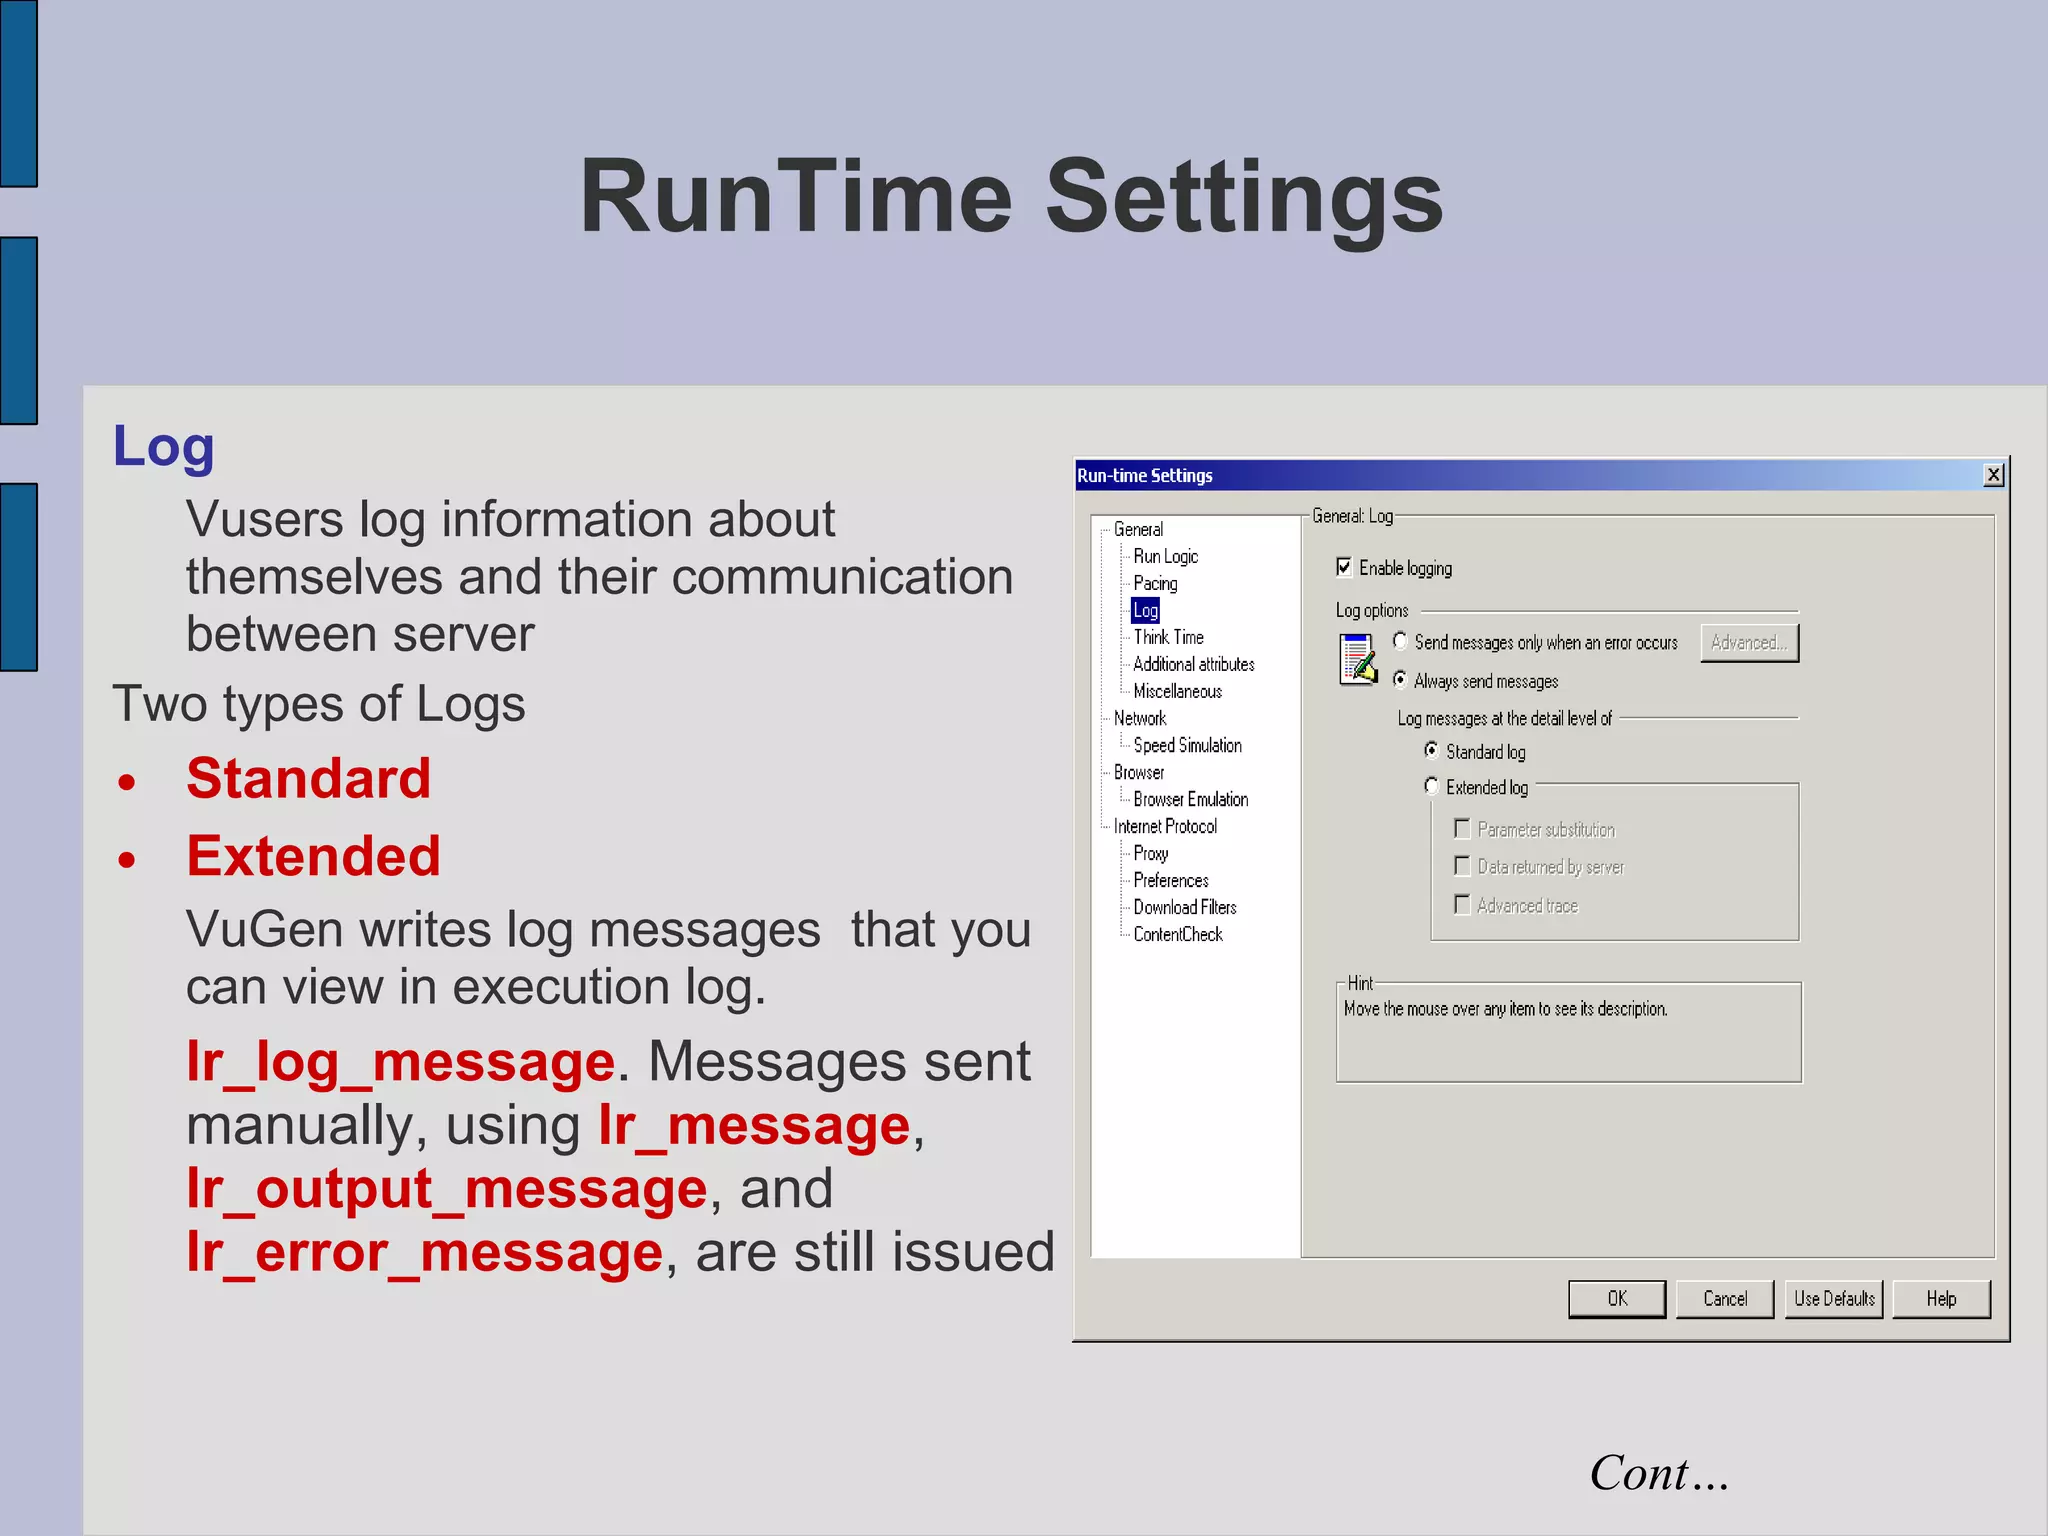
LoadRunner 8.0 Mercury
D a y  -  1
Agenda – Day 1 ( LoadRunner Overview)‏ Introducing LoadRunner What’s New in LoadRunner 8.0? LoadRunner Terminology LoadRunner Components Load Test Workflow How LoadRunner Works? LoadRunner Solution Types of Performance Testing Objectives of Performance Testing When is Load Testing Needed? Why Load Test your Application? Questions A Performance Test Should Answer. Supporting Environments
Introduction to Load Runner 8.0  Load Runner is a Mercury Interactive Tool that predicts performance and behavior of the system By creating lots of load, you can see how the system reacts at peak levels or with simultaneous Users To test the application, LoadRunner emulates an environment where multiple users work concurrently. While the application is under load, LoadRunner accurately measures and analyzes the system performance, and its functionality.
What's New in LoadRunner 8.0 ? What’s new In Load Testing? The first unified application for Performance Testing, Tuning and Diagnostics. Accurate prediction of system performance, pinpoint application bottlenecks and resolve infrastructure bottlenecks Provides a web-based, enterprise-wide load testing solutions Contd… Load Testing
What's New in LoadRunner  8.0 ? What’s new In Diagnosing? Introduces J2EE Diagnostics, Siebel Diagnostics, and Oracle Diagnostics Gives the complete visibility into J2EE, Siebel and Oracle component Performance under Load First time you can drill down from a slow end user transaction all the way to the slow method Diagnosing Contd…
What’s New in LoadRunner  8.0 ? What’s new In Tuning? A complete solution to help you identify, isolate, and resolve performance problems in your infrastructure Tuning console is a part of Mercury Interactive’s  performance center product line, which is a comprehensive solution for performance testing, tuning, and diagnostics. Tuning
LoadRunner Terminology Scenarios Using LoadRunner, you divide your application performance testing requirements into scenarios. A scenario defines the events that occur during each testing sessions. For example, a scenario defines and controls the number of users to emulate, the actions that they perform, and the machines on which they run their emulations.   Vusers In a scenario, LoadRunner replaces human users with virtual users or Vusers. When you run a scenario, Vusers emulate the actions of human users—submitting input to the server.   A scenario can contain tens, hundreds, or even thousands of Vusers.   Contd….
LoadRunner Terminology Vuser Scripts The actions that a Vuser performs during the scenario are described in a Vuser script. When you run a scenario, each Vuser executes a Vuser script. Vuser scripts include functions that measure and record the performance of the server during the scenario.   Transactions To measure the performance of the server, you define transactions.  Transactions measure the time that it takes for the server to respond to tasks submitted by Vusers.   Contd….
LoadRunner Terminology Rendezvous Points You insert rendezvous points into Vuser scripts to emulate heavy user load on the server.  Rendezvous points instruct multiple Vusers to perform tasks at exactly the same time.  For example, to emulate peak load on the bank server, you insert a rendezvous point to instruct 100 Vusers to simultaneously deposit cash into their accounts.   Controller You use the LoadRunner Controller to manage and maintain your scenarios.  Using the Controller, you control all the Vusers in a scenario from a single workstation.   Contd….
LoadRunner Terminology Hosts When you execute a scenario, the LoadRunner Controller distributes each Vuser in the scenario to a host.  The host is the machine that executes the Vuser script, enabling the Vuser to emulate the actions of a human user.   Performance Analysis Vuser scripts include functions that measure and record system performance during load-testing sessions.  During a scenario run, you can monitor the network and server resources.  Following a scenario run, you can view performance analysis data in reports and graphs.
LoadRunner Components Contd…. Controller VuGen Analysis LoadRunner Tuning
VuGen  (Virtual User Generator) – records Vuser Scripts that emulate the steps of real Users using the application The  Controller  is an administrative center for creating, maintaining, and executing scenarios. The controller assigns Vusers and load generators to scenarios.  Starts and stops load tests, and perform other Administrative tasks Components of LoadRunner 8.0  Contd….
Components of LoadRunner 8.0 LR Analysis   uses the load test results to create graphs and reports that are used to correlate system information and identify both bottlenecks and performance issues. Tuning   helps you quickly isolate and resolve performance bottlenecks. By adding a centralized tuning console to LoadRunner, the Mercury Tuning Module ensures that performance bottlenecks are resolved during testing, and helps you determine the optimized configuration settings for production.
Load Test Work Flow
How LoadRunner Works ?
How LoadRunner Works?
The LoadRunner Solution Contd….
The LoadRunner Solution The LoadRunner automated solution addresses the drawbacks of manual performance testing: LoadRunner reduces the personnel requirements by replacing human users with virtual users or Vusers. These Vusers emulate the behavior of real users — operating real applications. Because numerous Vusers can run on a single computer, LoadRunner reduces the hardware requirements. The LoadRunner Controller allows you to easily and effectively control all the Vusers — from a single point of control. LoadRunner monitors the application performance online, enabling you to fine-tune your system during test execution. Contd….
The LoadRunner Solution LoadRunner automatically records the performance of the application during a test. You can choose from a wide variety of graphs and reports to view the performance data. LoadRunner checks where performance delays occur: network or client delays, CPU performance, I/O delays, database locking, or other issues at the database server. LoadRunner monitors the network and server resources to help you improve performance. Because LoadRunner tests are fully automated, you can easily repeat them as often as you need.
Types of Performance Testing Find out whether the system can handle the expected load upon deployment under real-world conditions.  Find the application's breaking point. Apply testing that measures whether the application's environment is properly configured to handle expected or potentially unexpected high transaction volumes. Find the stability of the system with respect to  handling large amounts of data over extended time periods. Find the behavior and performance of each tier .  Load  Testing Stress  Testing Volume Testing Component Testing
Objectives of Performance Testing How long does it take to complete a task? Application Response Time Reliability Configuration Sizing Capacity Planning Acceptance Bottleneck Identification Regression Product Evaluation How Stable is the system under a heavy work load? Which configuration provides the best performance level? At what point does degradation in performance occur? Is the system stable enough to go into Production? What is the cause of degradation in performance? Does the new version of Software adversely affect response time? What is the best server for 100 users?
When is Load Testing Needed ? Production What is the cause of performance degradation? Deployment Is the system reliable enough to go into production? Development Does the system response time meet requirements? Planning and Design What is the best server to support 1000 users? Evolution How many users can be added without decreasing system performance? Change Management
Why Load Test? The failure of a mission-critical application can be costly. Assure performance and functionality under real-world conditions. Locate potential problems before your customers do. Reduce development Time. Reduce infrastructure costs
Questions a performance test should Answer Does the Application respond quickly enough for the intended users? Will the application handle the expected user load and beyond? Will the application handle the number of transactions required by the business? Is the application stable under expected and unexpected user loads? Are you sure that users will have a positive experience on go-live day?
Supporting Environments Application Deployment Solution  -  The Citrix protocol.  Client/Server  - MS SQL, ODBC, Oracle Web Applications 11i, DB2 CLI, Sybase Ctlib, Sybase Dblib, Windows Sockets, and DNS protocols.  Custom  -  C templates, Visual Basic templates, Java templates, Javascript, and VBScript type scripts.  Distributed Components  - COM/DCOM, Corba-Java, and Rmi-Java protocols.  E-Business  - FTP, LDAP, Palm, Web (HTTP/HTML), Web Services, and the dual Web/Winsocket protocols.  Enerprise Java Beans  -EJB Testing and RMI-Java protocols.  ERP/CRM  - Baan, Oracle NCA, Peoplesoft 8, Peoplesoft-Tuxedo, SAP-Web, SAPGUI, SAPGUI/SAP-Web dual, and Siebel (Siebel-DB2 CLI, Siebel-MSSQL, Siebel-Web, and Siebel-Oracle) protocols.  Contd….
Supporting Environments Legacy Terminal Emulation (RTE).  Mailing Services Internet Messaging (IMAP), MS Exchange (MAPI), POP3, and SMTP.   Streaming MediaPlayer and RealPlayer protocols.   Wireless i-Mode, VoiceXML, and WAP protocols.   Internet/Intranet Web Servers Clients App.  Servers Database Server
Supporting Environments Platforms NT, 2000, XP Sun HP IBM Linux
LoadRunner Architecture
Gurpreet Singh QA-Lead Q & A
D a y  -  2
Virtual User Generator & Controller Agenda – Day 2
What is Virtual User (Vuser) ? Virtual users or Vusers emulate the steps of real users. The steps that Vusers perform are recorded in a Vuser Script.
What is VuGen (Virtual User Generator) ? VuGen records Vuser Scripts that emulate the steps of real users using the application VuGen not only records Vuser scripts, but also runs them. Running scripts from VuGen is useful for debugging  VuGen records sessions on Windows platforms only. However, a recorded Vuser script can run on both Windows and UNIX platform.  Cont…
What is VuGen (Virtual User Generator) ? VuGen creates the script by recording the activity between the client and the server.  For example, in database applications, VuGen monitors the client end of the database and traces all the requests sent to, and received from, the database server
Developing Vuser Script Enhance / Edit the Vuser Script Record a Basic Vuser Script Configure the Run-time Settings Run the Vuser Script in Stand-Alone Mode Integrate the Vuser Script
Process of Recording Script Record  a basic script Enhance  the basic script by adding the control-flow statements and other Mercury API functions into the Script Configure  the Run-time settings Verify  that the script runs correctly, run it in stand-alone mode Integrate  into your test : a LoadRunner scenario, Performance Center load test, Tuning module session, Business process monitor profile
Understanding VuGen Code When you record a Vuser script, VuGen generates Vuser functions and inserts them into the script. There are two types of Vuser functions:   General Vuser Functions Protocol-Specific Vuser Functions  The  general  Vuser functions and the  protocol-specific  functions together form the Mercury VuGen API.  This API enables Vusers to communicate directly with a server.
Starting VuGen . Start > Programs > LoadRunner > Applications > Virtual User Generator
Welcome Screen - VuGen Single Protocol Script Multiple Protocol Script Creates a single protocol Vuser script. This is the default option  Creates a multiple protocol Vuser script. VuGen displays all of the available protocols and allows you to specify which protocols to record
Vuser Script Sections Each Vuser script contains at least three sections: vuser_init one or more  Actions  and  vuser_end .  the Vuser finishes or is stopped a logoff procedure vuser_end the Vuser is in "Running" status client activity Actions the Vuser is initialized (loaded)‏ a login to a server vuser_init Is executed when... Used when recording... Script Section
VuGen Editor
Recording Your Application Click the Start Recording Button For most Client / Server protocols, the following Screen opens Recording Tool Bar (Floating Tool Bar)‏
Ending and Saving a Recording Session  To complete the recording:  After you record a typical business process, you complete the recording session by performing the closing steps of your business process and saving the Vuser script.  Switch to the  vuser_end  section in the floating toolbar, and perform the log off or cleanup procedure.  Click the stop  Recording button on the recording Tool Bar
Enhancing Vuser Script After you record the Vuser Script you can enhance its capabilities by adding functions like General Vuser Functions General Vuser functions greatly enhance the functionality of any Vuser Script. All general Vuser functions have an  LR  Prefix Protocol - specific Vuser Functions Library functions used to enhance the script. ( LRS  - Windows,  LRT  - Tuxedo)‏ Standard ANSI C functions Enhancing the Vuser script by adding general C functions.  Like Adding Comments, Control flow statements, and so forth to your Vuser Script Cont…
Enhancing Vuser Script Inserting Transactions into Vuser Script Inserting Rendezvous point Inserting Comments Obtaining Vuser Information Sending Messages to output  Log Messages Lr_log_message Debug Messages Lr_set_debug_message Lr_debug_message Error and Output Messages Lr_error_message Lr_output_message Cont…
Enhancing Vuser Script Handling errors on Vuser Script during execution  ( Runtime settings > Miscellaneous > Error handling )‏ By default when a Vuser detects an error, the Vuser stops the execution You can use the  lr_continue_on_error  function to override the  continue on error  runtime setting  To mark the segment, enclose it with  lr_continue_on_error(1);  and  lr_continue_on_error(0);  statements Synchronizing Vuser Script Synchronize the execution of Vuser script with the output from your application Synchronize applies only to RTE Vuser Scripts Cont…
Enhancing Vuser Script Emulating User Think Time The time that a user waits between performing successive action is known as the Think Time Vuser uses the  lr_think_time  function to emulate user think time Vuser > Run-time settings > Think Time Cont…
Enhancing Vuser Script PARAMETERIZING
Enhancing Vuser Script Parameterizing Parameterization involves the following two tasks :  Replacing the constant values in the Vuser script with parameters  Setting the properties and data source for the parameters   Parameterization Limitations You can use parameterization only for the arguments within a function You can’t parameterize text strings that are not function arguments Cont…
Enhancing Vuser Script Creating Parameters In a script View :   Select a string  and  select replace with parameter  from the Right click menu Type the Name of the parameter in the appropriate box or select from the list Select parameter type from the parameter type list. The available types in the list are  Date/Time, file, Group Name, Random number, Unique number, User defined function, or Vuser ID,  Cont…
Enhancing Vuser Script VuGen creates new parameter, but does not automatically replace any selected string in the script Cont… Vuser >Parameter List  (or)‏
Enhancing Vuser Script Tree View Script View Cont…
Enhancing Vuser Script Select Next Row Sequential Random Unique Same line as   <Pameter_Name> Update Value on Each iteration Instructs the Vuser to use a new value for each script iteration Each occurrence Instructs the Vuser to use a new value for each occurrence of the parameter Once Instructs the Vuser to update the parameter value only once during the execution Cont…
Enhancing Vuser Script DATA WIZARD Cont… 1 2 3 4
Enhancing Vuser Script CORRELATION
Enhancing Vuser Script Determine which value to correlate Using   WDiff   you can find which string to correlate Save the results using  Web_reg_save_param  and  lrs_save_param Replace the Saved variable in your query or in your statements Primary reasons for correlating  -  To Generate dynamic code Cont…
Enhancing Vuser Script web_reg_save_param (“ myval &quot;, &quot; LB =userSession value=&quot;,  &quot; RB =>&quot;, &quot;Ord=1&quot;, &quot;RelFrameId=1.2.1&quot;, &quot;Search=Body&quot;, LAST); &quot;Name=userSession&quot;, &quot;Value= { myval } &quot; Storage Variable Left boundary Value Right boundary Value
LoadRunner 8.0 Run-time Settings
RunTime Settings Run Logic You can instruct a Vuser to Repeat the  Run  section when you run the script.   Each repetition is known as  iteration Number of Iterations LoadRunner repeats all of the actions, the specified number of times. If you specify a scenario duration in the controller, the duration setting overrides the Vusers iteration settings. Cont…
RunTime Settings Pacing Control the time between iterations.  The pace tells the Vuser how long to wait between iterations of Vuser You can instruct Vuser by following any of the method below As soon as the previous iteration ends. After the previous iteration ends with a fixed / random delay  At fixed / random intervals Cont…
RunTime Settings Log Vusers log information about themselves and their communication between server Two types of Logs Standard Extended VuGen writes log messages  that you can view in execution log. lr_log_message . Messages sent manually, using  lr_message ,  lr_output_message , and  lr_error_message , are still issued  Cont…
RunTime Settings Think Time When you run a Vuser script, the Vuser uses the think time values that were recorded into the script during the recording session.   VuGen allows you to use the recorded think time, ignore it, or use a value related to the recorded time:   Cont…
Miscellaneous You can set the following Miscellaneous run-time options for a Vuser script:  Error Handling Multithreading Vusers support multithreaded environments. The primary advantage of a multithread environment is the ability to run more Vusers per load generator.  Automatic Transactions RunTime Settings
LoadRunner 8.0 CONTROLLER
LoadRunner 8.0 - Controller What is Scenario? A scenario is a file that defines the Vusers execution, the  number of Vusers to run, the goals of the test, the computer  that hosts the Vusers,  and the conditions under which to run  the Load Test
LoadRunner 8.0 - Controller Controller organizes and manages scenario elements During scenario execution the controller : Runs Vuser Groups Controls the initialize, run, pause, and stop conditions of each Vuser Displays the status of each Vuser Displays any messages from Vusers Monitors system and network resources
LoadRunner 8.0 - Controller Types of Scenarios Manual Scenario Manage your Load Test by specifying the number of Virtual users to run Goal-Oriented Scenario Allow LoadRunner Controller to create a Scenario based on the goals you specify
LoadRunner 8.0 - Controller Manual Scenario You control the number of Running Vusers at the time which they Run. You can specify how many Vusers run simultaneously Allows you to run the Vuser in Percentage mode
LoadRunner 8.0 - Controller Goal-Oriented Scenario Determine your system to achieve the particular goal The goal may be  number of hits per second ,  Number of transaction per second, etc., Manages Vusers Automatically to maintain and achieve the goal
LoadRunner 8.0 - Controller Which scenario to use? Examples Manual Scenario with 1000 users Script Should define Update When running the Load Test at peak load achieve 1000 concurrent users Goal-Oriented with transaction time as the ‘Goal Type’ Define search transaction Response time of 8 seconds with 2000 concurrent users during non-peak hours Achieve response time of 12 Secs with 5000 concurrent users during peak hours Scenario Type Scenario Outline
LoadRunner 8.0 - Controller Vuser Groups Scenario consists of group of Vusers which emulate the Human users to interact with your application Each script you select is assigned a Vuser group Each Vuser group is assigned a number of Vusers You can Assign different script to each Vuser or You can assign the same script to all the Vusers
LoadRunner 8.0 - Controller Adding Vuser Group Group Name Vuser Quantity Load Generator name
LoadRunner 8.0 - Controller Load Generator for your Scenario Load Generator is a machine that serves as the host for running Vusers Its important to know that which script need to be run from which location For example customer activity, the function of location, workload of location…etc.,
LoadRunner 8.0 - Controller Adding Load Generator Click the generators button to open the dialogue box Now click the add button to open the Add load generator dialogue box Enter the name and load generator platform which you want to add A machine must have installed LoadRunner agent to use as a Load Generator
LoadRunner 8.0 - Controller Assigning Number of Vusers  Simple scenarios use just one Vuser Script To profile a more complex mix of users, assign several Vuser scripts based on “User profile” in one scenario
Gurpreet Singh QA-Lead Q & A
D a y  -  3
Agenda – Day 3 Analysis & Reports
LoadRunner Analysis Analysis provides graphs and reports to help you analyze the performance of your system. These graphs and reports summarize the scenario execution. Using these graphs and reports, you can easily pinpoint and  identify the bottlenecks in your Application
LoadRunner Analysis To view a summary of the results  after  test execution, you can use one or more of the following tools: Vuser log files  contain a full trace of the scenario run for each Vuser. These files are located in the scenario results directory. Controller Output window  displays information about the scenario run. Analysis graphs  help you determine system performance and provide information about transactions and Vusers. Graph Data  and  Raw Data  views display the actual data used to generate the graph in a spreadsheet format. Report  utilities enable you to view a Summary HTML report for each graph or a variety of Performance and Activity reports. You can create a report as a Microsoft Word document, which automatically summarizes and displays the test’s significant data in graphical and tabular format.
Analysis Basis
LoadRunner - Analysis Creating Analysis Session When you run a scenario, data is stored in a result file with an  .lrr  extension. Analysis is the utility that processes the gathered result information and generates graphs and reports. When you work with the Analysis utility, you work within a  sessio n. An Analysis session contains at least one set of scenario results  (lrr file).  Analysis stores the display information and layout settings for the active graphs in a file with an  .lra  extension.
LoadRunner - Analysis Methods of opening LoadRunner Analysis Open  Analysis  directly from the  controller ( Results > Analyze Results)‏ Start > Programs > Mercury LoadRunner > Applications > Analysis Start > Programs > Mercury LoadRunner > LoadRunner , select the  Load Testing  or  Tuning tab , and then click  Analyze Load Tests  or  Analyze Tuning   Sessions. You can also instruct controller to open analysis automatically after the Scenario execution by selecting  Results > Auto Analysis
Collating Execution Results  When you run a scenario, by default all Vuser information is  stored locally  on each  Vuser host After scenario execution the results are automatically collated or consolidated – results from all the hosts are transfer to results directory You disable automatic collation by choosing  Results > Auto collate Results  from the controller window You can collate manually by selecting  Results > Collate Results If your results are not collated Analysis will automatically collate the results before generating the analysis data
Viewing Summary Data Analysis : Tools    Options Generate Summary data only View the summary data only. If this option is selected Analysis won’t Process the data for  advanced use with filtration Generate Complete data only View only the complete data only after it has  been Processed. Do not display the Summary Display Summary while generate  Complete data only View summary data while the complete data is being processed. After the processing, view the complete data. A bar below the graph indicates the complete data generation progress.
Data Aggregation Aggregate Data: Specify the data you want to aggregate in order to reduce the size of the database. Select the type of data to aggregate:   Specify the type(s) of graphs for which you want to aggregate data. Select the graph properties to aggregate:   Specify the graph properties— Vuser ID, Group Name, and Script Name—you want to aggregate. If you do not want to aggregate the failed Vuser data, select Do not aggregate failed Vusers.
Setting Database Options You can choose the database in which to store Analysis session result data and you can repair and compress your Analysis results and optimize the database that may have become fragmented. By default, LoadRunner stores Analysis result data in an Access 2000 database.  If your Analysis result data exceeds two gigabytes, it is recommended that you store it on an SQL server
Session Information You can view the properties of the current Analysis session in the  Session Information dialog box.
Analysis Graphs Vuser Graphs  - Provide information about Vuser states and other Vuser statistics. Error Graphs  - Provide information about the errors that occurred during the scenario. Transaction Graphs  - Provide information about transaction performance and response time. Web Resource Graphs  - Provide information about the throughput, hits per second, HTTP responses per second, number of retries per second, and downloaded pages per second for Web Vusers. Web Page Breakdown Graphs  - Provide information about the size and download time of each Web page component .  Analysis graphs are divided into the following categories:
Analysis Graphs User-Defined Data Point Graphs  - Provide information about the custom data points that were gathered by the online monitor. System Resource Graphs  - Provide statistics relating to the system resources that were monitored during the scenario using the online monitor.  Network Monitor Graphs  - Provide information about the network delays.  Firewall Server Monitor Graphs  - Provide information about firewall server resource usage.  Web Server Resource Graphs  - Provide information about the resource usage for the Apache, iPlanet/Netscape, iPlanet(SNMP), and MS IIS Web servers.
Analysis Graphs Web Application Server Resource Graphs  - Provide information about the resource usage for various Web application servers. Database Server Resource Graphs  - Provide information about database resources.  Streaming Media Graphs  - Provide information about resource usage of streaming media.  ERP/CRM Server Resource Graphs  - Provide information about ERP/CRM server resource usage.  Java Performance Graphs  - Provide information about resource usage of Java-based applications.  Application Component Graphs  - Provide information about resource usage of the Microsoft COM+ server and the Microsoft NET CLR server.  Application Deployment Solutions Graphs  - Provide information about resource usage of the Citrix MetaFrame and 1.8 servers.
Analysis Graphs Middleware Performance Graphs  - Provide information about resource usage of the Tuxedo and IBM WebSphere MQ servers. Security Graphs  - Provide information about simulated attacks on the server using the Distributed Denial of Service graph. Application Traffic Management Graphs  - Provide information about resource usage of the F5 BIG-IP server.  Infrastructure Resources Graphs  - Provide information about resource usage of FTP, POP3, SMTP, IMAP, and DNS Vusers on the network client.  Siebel Diagnostics Graphs  - Provide detailed breakdown diagnostics for transactions generated on Siebel Web, Siebel App, and Siebel Database servers.  Siebel DB Diagnostics Graphs  - Provide detailed breakdown diagnostics for SQLs generated by transactions on the Siebel system.
Analysis Graphs Oracle Diagnostics Graphs  - Provide detailed breakdown diagnostics for SQLs generated by transactions on the Oracle NCA system.  J2EE Diagnostics Graphs  - Provide information to trace, time, and troubleshoot individual transactions through J2EE Web, application, and database servers.
Adding New Graph Graphs that contain data are listed in blue. By default, only graphs that contain data are listed. To view the entire list of LoadRunner graphs, clear Display only graphs containing data. Use the Scenario Elapsed Time field to limit the time range for which graph data is displayed. Graph > Add Graph, or click <New Graph> To view the entire list of LoadRunner graphs, clear Display only graphs containing data.
Filtering & Sorting Graph Data You can filter and sort data that is displayed in a graph. You sort and filter graph data using the same dialog box . Filtering Graph Data You can filter graph data to show fewer transactions for a specific segment of the scenario.  More specifically, you can display four transactions beginning from five minutes into the scenario and ending three minutes before the end of the scenario. You can filter for a single graph, in all graphs in a scenario, or in the summary graph.
Filtering & Sorting Graph Data Sorting Graph Data   You can sort graph data to show the data in more relevant ways. For  example ,  Transaction graphs can be grouped by the Transaction End Status, and Vuser graphs can be grouped by Scenario Elapsed Time, Vuser End Status, Vuser Status, and VuserID.
Configuring Basic Graph Display Options   View    Display Options
Configuring Basic Graph Display Options Adding Comments and Arrows
Web Page Break Down
Analyzing Graph Results   Determining a Point’s Coordinates Drilling Down in a Graph Changing the Granularity of the Data Viewing the Data as a Spreadsheet and as Raw Data Viewing Measurement Trends Auto Correlating Measurements Using the WAN Emulation Overlay
Determining a Point’s Coordinates You can determine the coordinates and values at any point in a graph. Place the cursor over the point you want to evaluate and Analysis displays the axis values and other grouping information.
Drilling Down in a Graph Drill down  enables you to focus on a specific measurement within your graph and display it according to a desired grouping.  The available groupings depend on the graph. For example, the Average Transaction Response Time graph shows one line per transaction.  To determine the response time for each Vuser, you drill down on one transaction and sort it according to Vuser ID.  The graph displays a separate line for each Vuser's transaction response time.   Note: The drill down feature is not available for the Web Page Breakdown graph.
Changing the Granularity of the Data  You can make the graphs easier to read and analyze by changing the granularity (scale) of the x-axis.  The maximum granularity is half of the graph's time range. To ensure readability and clarity, Analysis automatically adjusts the minimum granularity of graphs with ranges of 500 seconds or more.
Viewing the Data as a Spreadsheet and as Raw Data You can view the graph in spreadsheet format using the  Graph Data  tab.   You can view the actual  Raw Data  collected during test execution for the active graph. The  Raw Data  view is not available for all graphs.
Correlating Graph Measurements Automatically  The minimum time range should be more than 5% of the total time range of the measurement. Trends which are smaller than 5% of the  whole measurement will be contained in other larger segments.
Using the WAN Emulation Overlay  During scenario execution, you can use WAN effects such as latency, packet loss, link faults, and dynamic routing to characterize many aspects of the WAN cloud. Using the WAN emulation overlay during Analysis, you can display the time period(s) in a scenario that the WAN emulator was active. By comparing measurements taken during WAN emulation to measurements taken with the WAN emulator feature disabled, you can see the impact of WAN settings on your network performance.  View > Overlay with WAN Emulation
Cross Result and Merged Graphs  The Analysis utility lets you compare results and graphs to determine the source of a problem.  Comparing results is essential for determining bottlenecks and problems. You use Cross Result graphs to compare the results of multiple scenario runs. You create Merged graphs to compare results from different graphs within the same scenario run.
Cross Result Graphs Cross Result graphs are useful for:  Benchmarking hardware –  Between Two Configurations Testing software versions –  Between Two Versions Determining system capacity –  To determine the capacity of the system If you want to benchmark two hardware configurations,  you run the same scenario with both configurations and compare  the transaction response times using a single Cross Result graph.   Suppose that your vendor claims that a new software version is optimized to run quicker than a previous version.  You can verify this claim by running the same scenario on both versions  of the software, and comparing the scenario results.
Generating Cross Result Graphs   File  >  Cross With Result You can create a Cross Result graph for two or more result sets.  The Cross Result dialog box enables you to compare the results of multiple scenario runs.   Click Add to add an additional result set to the Result List. Locate a results directory and select its result file ( .lrr ). Click  OK . The scenario is added to the Result List.
Generating Cross Result Graphs
Merging Graphs Analysis lets you merge the results of two graphs from the same scenario into a single graph. The merging allows you to compare several different measurements at once. For example, you can make a merged graph to display the network delay and number of running Vusers, as a function of the elapsed time.   Select a graph with which you want to merge your active graph. Only the graphs with a common x-axis to the active graph are available.   View > Merge Graphs
Merging Graphs
Understanding the Merge Graphs Dialog Box  The Merge Graphs dialog box enables you to merge two graphs into a single graph. In order to merge graphs, the graphs ' x-axes must be the same measurement . For example, you can merge Web Throughput and Hits per Second graphs, because their x-axes are Scenario Elapsed Time. Three Types of Merging : 1. Overlay 2. Tile 3. Correlate
Understanding the Merge Graphs Dialog Box Overlay:   Superimpose the contents of two graphs that share a common x-axis. The left y-axis on the merged graph shows the current graph's values. The right y-axis shows the values of the graph that was merged. There is no limit to the number of graphs that you can overlay. When you overlay two graphs, the y-axis for each graph is displayed separately to the right and left of the graph.
Understanding the Merge Graphs Dialog Box Tile:  View contents of two graphs that share a common x-axis in a tiled layout, one above the other. In the following example the Throughput and Hits per Second graph are tiled one above the other.
Understanding the Merge Graphs Dialog Box Correlate:   Plot the y-axis of two graphs against each other. The active graph's y-axis becomes the x-axis of the merged graph. The y-axis of the graph that was merged, becomes the merged graph's y-axis.
Managing Results Using Quality Center   LoadRunner's integration with Quality Center lets you manage Analysis result sessions using Quality Center, Mercury's test management tool.  LoadRunner works together with Quality Center to provide an efficient method for storing and retrieving scenarios and collecting results.
Importing External Data   The LoadRunner Analysis Import Data   tool enables you to import and integrate non-Mercury data into a LoadRunner Analysis session.
Importing External Data…Supporting Formats NT Performance Monitor (.csv)‏ Windows 2000 Performance Monitor (.csv)‏ Standard Comma Separated File (.csv)‏ Master-Detail Comma Separator File (.csv)‏ Microsoft Excel File (.xls)‏ Master-Detail Microsoft Excel File (.xls)‏
Analysis Diagnostics  Siebel Diagnostics Graphs Siebel DB Diagnostics Graphs Oracle Diagnostics Graphs J2EE Diagnostics Graphs After a scenario run, you can use the Siebel diagnostics graphs to analyze Siebel CRM server performance.   Siebel diagnostics graphs enable you to trace, time, and troubleshoot individual transactions through Web, application, and database servers .
Analysis Reports  Analysis Reports includes the following sections:   Understanding Analysis Reports Creating a Microsoft Word Report After running a scenario, you can use the Analysis reports to analyze the performance of your application.  About Analysis Reports Viewing Summary Reports Creating HTML Reports Working with Transaction Reports Data Point Reports Failed Transaction Report Failed Vuser Report Data Point Report Detailed Transaction Report Transaction Performance by Vuser Report
Analysis Reports Analysis Provides the following Reports Summary Report HTML Reports Transaction Reports
Summary Report The Summary report provides general information about the scenario run.  You can view the Summary report at any time from the  Analysis window.
HTML Report Reports    HTML Report You can instruct Analysis  to create an HTML report.  Analysis creates an HTML  report for each one of the  open graphs.
Transaction Report Transaction reports provide performance information about the transactions defined within the Vuser scripts. These reports give you a statistical breakdown of your results and allow you to print and export the data.  Transaction Reports are divided into the following categories Activity Performance Data Point, Detailed Transaction, Transaction Performance by Vuser Activity reports  provide information about the number of Vusers and the  number of transactions executed during the scenario run.  The available Activity reports are  Scenario Execution ,  Failed Transaction ,  and  Failed Vusers .  Performance reports  analyze Vuser performance and transaction times.  The available Performance reports are  Data Point ,  Detailed Transaction , and  Transaction Performance by Vuser .
Activity Report Scenario Execution Failed Transaction Failed Vusers
Scenario Execution Report   The Scenario Execution report is an Activity report that provides details about major events that occurred during the scenario run. This includes information on every Vuser, such as when it was ready to run and for how long it ran.
Failed Transaction Report  The Failed Transaction report is an Activity report that provides details about the beginning time, end time, and duration of the failed, but completed transaction.
Failed Vuser Report   The Failed Vuser report is an Activity report that provides details about all Vusers that were in the error, stopped, or done : failed states during the scenario execution. The  Ready At  and  Running At  times are relative to the computer's system clock.
Data Point Report  LoadRunner enables you to record your own data for analysis. You instruct LoadRunner to record the value of an external function or variable, also known as a  data point , during the scenario run. The data point is set by including an  lr_user_data_point  function ( user_data_point  for GUI Vusers) in your Vuser script.  The  Data Point  graph shows the value of the data point during the scenario run. The  x- axis represents the number of seconds that elapsed since the start time of the run. The  y-axis  displays the value of each recorded data point statement. The  Data Point  report is a Performance report that lists the name of the data point, its value, and the time its value was recorded. The values are displayed for each Group and Vuser.
Data Point Report
Detailed Transaction Report  The Detailed Transaction (by Vuser) report is a Performance report that provides a list of all transactions executed by each Vuser during a scenario. The report provides details about the execution time of each transaction per Vuser.
Transaction Performance by Vuser Report Is a Performance report that displays the time required by each Vuser to perform transactions during the scenario.  The report indicates if the transaction was successful and what the minimum, maximum, and average times were for each Vuser.  This report is useful when you have several different types of Vusers in a scenario and you want to characterize performance for each type.
Transaction Performance by Vuser Report
Creating a Microsoft Word Report   You can create a report as a Microsoft Word document.   Word Report generation tool to automatically summarize and display the test's significant data in graphical and tabular format and to display and describe all graphs in the current Analysis session.  Other features of the report include the automatic inclusion of an overview of the LoadRunner Scenario configuration, and an executive summary.  The report is structured into logical and intuitive sections with a table of contents and various appendices.
Creating a Microsoft Word Report Reports > Microsoft Word Reports...
Creating a Microsoft Word Report
Q & A Gurpreet Singh QA-Lead

Load runner 8.0

  • 1.
  • 2.
    D a y - 1
  • 3.
    Agenda – Day1 ( LoadRunner Overview)‏ Introducing LoadRunner What’s New in LoadRunner 8.0? LoadRunner Terminology LoadRunner Components Load Test Workflow How LoadRunner Works? LoadRunner Solution Types of Performance Testing Objectives of Performance Testing When is Load Testing Needed? Why Load Test your Application? Questions A Performance Test Should Answer. Supporting Environments
  • 4.
    Introduction to LoadRunner 8.0 Load Runner is a Mercury Interactive Tool that predicts performance and behavior of the system By creating lots of load, you can see how the system reacts at peak levels or with simultaneous Users To test the application, LoadRunner emulates an environment where multiple users work concurrently. While the application is under load, LoadRunner accurately measures and analyzes the system performance, and its functionality.
  • 5.
    What's New inLoadRunner 8.0 ? What’s new In Load Testing? The first unified application for Performance Testing, Tuning and Diagnostics. Accurate prediction of system performance, pinpoint application bottlenecks and resolve infrastructure bottlenecks Provides a web-based, enterprise-wide load testing solutions Contd… Load Testing
  • 6.
    What's New inLoadRunner 8.0 ? What’s new In Diagnosing? Introduces J2EE Diagnostics, Siebel Diagnostics, and Oracle Diagnostics Gives the complete visibility into J2EE, Siebel and Oracle component Performance under Load First time you can drill down from a slow end user transaction all the way to the slow method Diagnosing Contd…
  • 7.
    What’s New inLoadRunner 8.0 ? What’s new In Tuning? A complete solution to help you identify, isolate, and resolve performance problems in your infrastructure Tuning console is a part of Mercury Interactive’s performance center product line, which is a comprehensive solution for performance testing, tuning, and diagnostics. Tuning
  • 8.
    LoadRunner Terminology ScenariosUsing LoadRunner, you divide your application performance testing requirements into scenarios. A scenario defines the events that occur during each testing sessions. For example, a scenario defines and controls the number of users to emulate, the actions that they perform, and the machines on which they run their emulations. Vusers In a scenario, LoadRunner replaces human users with virtual users or Vusers. When you run a scenario, Vusers emulate the actions of human users—submitting input to the server. A scenario can contain tens, hundreds, or even thousands of Vusers. Contd….
  • 9.
    LoadRunner Terminology VuserScripts The actions that a Vuser performs during the scenario are described in a Vuser script. When you run a scenario, each Vuser executes a Vuser script. Vuser scripts include functions that measure and record the performance of the server during the scenario. Transactions To measure the performance of the server, you define transactions. Transactions measure the time that it takes for the server to respond to tasks submitted by Vusers. Contd….
  • 10.
    LoadRunner Terminology RendezvousPoints You insert rendezvous points into Vuser scripts to emulate heavy user load on the server. Rendezvous points instruct multiple Vusers to perform tasks at exactly the same time. For example, to emulate peak load on the bank server, you insert a rendezvous point to instruct 100 Vusers to simultaneously deposit cash into their accounts. Controller You use the LoadRunner Controller to manage and maintain your scenarios. Using the Controller, you control all the Vusers in a scenario from a single workstation. Contd….
  • 11.
    LoadRunner Terminology HostsWhen you execute a scenario, the LoadRunner Controller distributes each Vuser in the scenario to a host. The host is the machine that executes the Vuser script, enabling the Vuser to emulate the actions of a human user. Performance Analysis Vuser scripts include functions that measure and record system performance during load-testing sessions. During a scenario run, you can monitor the network and server resources. Following a scenario run, you can view performance analysis data in reports and graphs.
  • 12.
    LoadRunner Components Contd….Controller VuGen Analysis LoadRunner Tuning
  • 13.
    VuGen (VirtualUser Generator) – records Vuser Scripts that emulate the steps of real Users using the application The Controller is an administrative center for creating, maintaining, and executing scenarios. The controller assigns Vusers and load generators to scenarios. Starts and stops load tests, and perform other Administrative tasks Components of LoadRunner 8.0 Contd….
  • 14.
    Components of LoadRunner8.0 LR Analysis uses the load test results to create graphs and reports that are used to correlate system information and identify both bottlenecks and performance issues. Tuning helps you quickly isolate and resolve performance bottlenecks. By adding a centralized tuning console to LoadRunner, the Mercury Tuning Module ensures that performance bottlenecks are resolved during testing, and helps you determine the optimized configuration settings for production.
  • 15.
  • 16.
  • 17.
  • 18.
  • 19.
    The LoadRunner SolutionThe LoadRunner automated solution addresses the drawbacks of manual performance testing: LoadRunner reduces the personnel requirements by replacing human users with virtual users or Vusers. These Vusers emulate the behavior of real users — operating real applications. Because numerous Vusers can run on a single computer, LoadRunner reduces the hardware requirements. The LoadRunner Controller allows you to easily and effectively control all the Vusers — from a single point of control. LoadRunner monitors the application performance online, enabling you to fine-tune your system during test execution. Contd….
  • 20.
    The LoadRunner SolutionLoadRunner automatically records the performance of the application during a test. You can choose from a wide variety of graphs and reports to view the performance data. LoadRunner checks where performance delays occur: network or client delays, CPU performance, I/O delays, database locking, or other issues at the database server. LoadRunner monitors the network and server resources to help you improve performance. Because LoadRunner tests are fully automated, you can easily repeat them as often as you need.
  • 21.
    Types of PerformanceTesting Find out whether the system can handle the expected load upon deployment under real-world conditions. Find the application's breaking point. Apply testing that measures whether the application's environment is properly configured to handle expected or potentially unexpected high transaction volumes. Find the stability of the system with respect to handling large amounts of data over extended time periods. Find the behavior and performance of each tier . Load Testing Stress Testing Volume Testing Component Testing
  • 22.
    Objectives of PerformanceTesting How long does it take to complete a task? Application Response Time Reliability Configuration Sizing Capacity Planning Acceptance Bottleneck Identification Regression Product Evaluation How Stable is the system under a heavy work load? Which configuration provides the best performance level? At what point does degradation in performance occur? Is the system stable enough to go into Production? What is the cause of degradation in performance? Does the new version of Software adversely affect response time? What is the best server for 100 users?
  • 23.
    When is LoadTesting Needed ? Production What is the cause of performance degradation? Deployment Is the system reliable enough to go into production? Development Does the system response time meet requirements? Planning and Design What is the best server to support 1000 users? Evolution How many users can be added without decreasing system performance? Change Management
  • 24.
    Why Load Test?The failure of a mission-critical application can be costly. Assure performance and functionality under real-world conditions. Locate potential problems before your customers do. Reduce development Time. Reduce infrastructure costs
  • 25.
    Questions a performancetest should Answer Does the Application respond quickly enough for the intended users? Will the application handle the expected user load and beyond? Will the application handle the number of transactions required by the business? Is the application stable under expected and unexpected user loads? Are you sure that users will have a positive experience on go-live day?
  • 26.
    Supporting Environments ApplicationDeployment Solution - The Citrix protocol. Client/Server - MS SQL, ODBC, Oracle Web Applications 11i, DB2 CLI, Sybase Ctlib, Sybase Dblib, Windows Sockets, and DNS protocols. Custom - C templates, Visual Basic templates, Java templates, Javascript, and VBScript type scripts. Distributed Components - COM/DCOM, Corba-Java, and Rmi-Java protocols. E-Business - FTP, LDAP, Palm, Web (HTTP/HTML), Web Services, and the dual Web/Winsocket protocols. Enerprise Java Beans -EJB Testing and RMI-Java protocols. ERP/CRM - Baan, Oracle NCA, Peoplesoft 8, Peoplesoft-Tuxedo, SAP-Web, SAPGUI, SAPGUI/SAP-Web dual, and Siebel (Siebel-DB2 CLI, Siebel-MSSQL, Siebel-Web, and Siebel-Oracle) protocols. Contd….
  • 27.
    Supporting Environments LegacyTerminal Emulation (RTE). Mailing Services Internet Messaging (IMAP), MS Exchange (MAPI), POP3, and SMTP. Streaming MediaPlayer and RealPlayer protocols. Wireless i-Mode, VoiceXML, and WAP protocols. Internet/Intranet Web Servers Clients App. Servers Database Server
  • 28.
    Supporting Environments PlatformsNT, 2000, XP Sun HP IBM Linux
  • 29.
  • 30.
  • 31.
    D a y - 2
  • 32.
    Virtual User Generator& Controller Agenda – Day 2
  • 33.
    What is VirtualUser (Vuser) ? Virtual users or Vusers emulate the steps of real users. The steps that Vusers perform are recorded in a Vuser Script.
  • 34.
    What is VuGen(Virtual User Generator) ? VuGen records Vuser Scripts that emulate the steps of real users using the application VuGen not only records Vuser scripts, but also runs them. Running scripts from VuGen is useful for debugging VuGen records sessions on Windows platforms only. However, a recorded Vuser script can run on both Windows and UNIX platform. Cont…
  • 35.
    What is VuGen(Virtual User Generator) ? VuGen creates the script by recording the activity between the client and the server. For example, in database applications, VuGen monitors the client end of the database and traces all the requests sent to, and received from, the database server
  • 36.
    Developing Vuser ScriptEnhance / Edit the Vuser Script Record a Basic Vuser Script Configure the Run-time Settings Run the Vuser Script in Stand-Alone Mode Integrate the Vuser Script
  • 37.
    Process of RecordingScript Record a basic script Enhance the basic script by adding the control-flow statements and other Mercury API functions into the Script Configure the Run-time settings Verify that the script runs correctly, run it in stand-alone mode Integrate into your test : a LoadRunner scenario, Performance Center load test, Tuning module session, Business process monitor profile
  • 38.
    Understanding VuGen CodeWhen you record a Vuser script, VuGen generates Vuser functions and inserts them into the script. There are two types of Vuser functions: General Vuser Functions Protocol-Specific Vuser Functions The general Vuser functions and the protocol-specific functions together form the Mercury VuGen API. This API enables Vusers to communicate directly with a server.
  • 39.
    Starting VuGen .Start > Programs > LoadRunner > Applications > Virtual User Generator
  • 40.
    Welcome Screen -VuGen Single Protocol Script Multiple Protocol Script Creates a single protocol Vuser script. This is the default option Creates a multiple protocol Vuser script. VuGen displays all of the available protocols and allows you to specify which protocols to record
  • 41.
    Vuser Script SectionsEach Vuser script contains at least three sections: vuser_init one or more Actions and vuser_end . the Vuser finishes or is stopped a logoff procedure vuser_end the Vuser is in &quot;Running&quot; status client activity Actions the Vuser is initialized (loaded)‏ a login to a server vuser_init Is executed when... Used when recording... Script Section
  • 42.
  • 43.
    Recording Your ApplicationClick the Start Recording Button For most Client / Server protocols, the following Screen opens Recording Tool Bar (Floating Tool Bar)‏
  • 44.
    Ending and Savinga Recording Session To complete the recording: After you record a typical business process, you complete the recording session by performing the closing steps of your business process and saving the Vuser script. Switch to the vuser_end section in the floating toolbar, and perform the log off or cleanup procedure. Click the stop Recording button on the recording Tool Bar
  • 45.
    Enhancing Vuser ScriptAfter you record the Vuser Script you can enhance its capabilities by adding functions like General Vuser Functions General Vuser functions greatly enhance the functionality of any Vuser Script. All general Vuser functions have an LR Prefix Protocol - specific Vuser Functions Library functions used to enhance the script. ( LRS - Windows, LRT - Tuxedo)‏ Standard ANSI C functions Enhancing the Vuser script by adding general C functions. Like Adding Comments, Control flow statements, and so forth to your Vuser Script Cont…
  • 46.
    Enhancing Vuser ScriptInserting Transactions into Vuser Script Inserting Rendezvous point Inserting Comments Obtaining Vuser Information Sending Messages to output Log Messages Lr_log_message Debug Messages Lr_set_debug_message Lr_debug_message Error and Output Messages Lr_error_message Lr_output_message Cont…
  • 47.
    Enhancing Vuser ScriptHandling errors on Vuser Script during execution ( Runtime settings > Miscellaneous > Error handling )‏ By default when a Vuser detects an error, the Vuser stops the execution You can use the lr_continue_on_error function to override the continue on error runtime setting To mark the segment, enclose it with lr_continue_on_error(1); and lr_continue_on_error(0); statements Synchronizing Vuser Script Synchronize the execution of Vuser script with the output from your application Synchronize applies only to RTE Vuser Scripts Cont…
  • 48.
    Enhancing Vuser ScriptEmulating User Think Time The time that a user waits between performing successive action is known as the Think Time Vuser uses the lr_think_time function to emulate user think time Vuser > Run-time settings > Think Time Cont…
  • 49.
    Enhancing Vuser ScriptPARAMETERIZING
  • 50.
    Enhancing Vuser ScriptParameterizing Parameterization involves the following two tasks : Replacing the constant values in the Vuser script with parameters Setting the properties and data source for the parameters Parameterization Limitations You can use parameterization only for the arguments within a function You can’t parameterize text strings that are not function arguments Cont…
  • 51.
    Enhancing Vuser ScriptCreating Parameters In a script View : Select a string and select replace with parameter from the Right click menu Type the Name of the parameter in the appropriate box or select from the list Select parameter type from the parameter type list. The available types in the list are Date/Time, file, Group Name, Random number, Unique number, User defined function, or Vuser ID, Cont…
  • 52.
    Enhancing Vuser ScriptVuGen creates new parameter, but does not automatically replace any selected string in the script Cont… Vuser >Parameter List (or)‏
  • 53.
    Enhancing Vuser ScriptTree View Script View Cont…
  • 54.
    Enhancing Vuser ScriptSelect Next Row Sequential Random Unique Same line as <Pameter_Name> Update Value on Each iteration Instructs the Vuser to use a new value for each script iteration Each occurrence Instructs the Vuser to use a new value for each occurrence of the parameter Once Instructs the Vuser to update the parameter value only once during the execution Cont…
  • 55.
    Enhancing Vuser ScriptDATA WIZARD Cont… 1 2 3 4
  • 56.
  • 57.
    Enhancing Vuser ScriptDetermine which value to correlate Using WDiff you can find which string to correlate Save the results using Web_reg_save_param and lrs_save_param Replace the Saved variable in your query or in your statements Primary reasons for correlating - To Generate dynamic code Cont…
  • 58.
    Enhancing Vuser Scriptweb_reg_save_param (“ myval &quot;, &quot; LB =userSession value=&quot;, &quot; RB =>&quot;, &quot;Ord=1&quot;, &quot;RelFrameId=1.2.1&quot;, &quot;Search=Body&quot;, LAST); &quot;Name=userSession&quot;, &quot;Value= { myval } &quot; Storage Variable Left boundary Value Right boundary Value
  • 59.
  • 60.
    RunTime Settings RunLogic You can instruct a Vuser to Repeat the Run section when you run the script. Each repetition is known as iteration Number of Iterations LoadRunner repeats all of the actions, the specified number of times. If you specify a scenario duration in the controller, the duration setting overrides the Vusers iteration settings. Cont…
  • 61.
    RunTime Settings PacingControl the time between iterations. The pace tells the Vuser how long to wait between iterations of Vuser You can instruct Vuser by following any of the method below As soon as the previous iteration ends. After the previous iteration ends with a fixed / random delay At fixed / random intervals Cont…
  • 62.
    RunTime Settings LogVusers log information about themselves and their communication between server Two types of Logs Standard Extended VuGen writes log messages that you can view in execution log. lr_log_message . Messages sent manually, using lr_message , lr_output_message , and lr_error_message , are still issued Cont…
  • 63.
    RunTime Settings ThinkTime When you run a Vuser script, the Vuser uses the think time values that were recorded into the script during the recording session. VuGen allows you to use the recorded think time, ignore it, or use a value related to the recorded time: Cont…
  • 64.
    Miscellaneous You canset the following Miscellaneous run-time options for a Vuser script: Error Handling Multithreading Vusers support multithreaded environments. The primary advantage of a multithread environment is the ability to run more Vusers per load generator. Automatic Transactions RunTime Settings
  • 65.
  • 66.
    LoadRunner 8.0 -Controller What is Scenario? A scenario is a file that defines the Vusers execution, the number of Vusers to run, the goals of the test, the computer that hosts the Vusers, and the conditions under which to run the Load Test
  • 67.
    LoadRunner 8.0 -Controller Controller organizes and manages scenario elements During scenario execution the controller : Runs Vuser Groups Controls the initialize, run, pause, and stop conditions of each Vuser Displays the status of each Vuser Displays any messages from Vusers Monitors system and network resources
  • 68.
    LoadRunner 8.0 -Controller Types of Scenarios Manual Scenario Manage your Load Test by specifying the number of Virtual users to run Goal-Oriented Scenario Allow LoadRunner Controller to create a Scenario based on the goals you specify
  • 69.
    LoadRunner 8.0 -Controller Manual Scenario You control the number of Running Vusers at the time which they Run. You can specify how many Vusers run simultaneously Allows you to run the Vuser in Percentage mode
  • 70.
    LoadRunner 8.0 -Controller Goal-Oriented Scenario Determine your system to achieve the particular goal The goal may be number of hits per second , Number of transaction per second, etc., Manages Vusers Automatically to maintain and achieve the goal
  • 71.
    LoadRunner 8.0 -Controller Which scenario to use? Examples Manual Scenario with 1000 users Script Should define Update When running the Load Test at peak load achieve 1000 concurrent users Goal-Oriented with transaction time as the ‘Goal Type’ Define search transaction Response time of 8 seconds with 2000 concurrent users during non-peak hours Achieve response time of 12 Secs with 5000 concurrent users during peak hours Scenario Type Scenario Outline
  • 72.
    LoadRunner 8.0 -Controller Vuser Groups Scenario consists of group of Vusers which emulate the Human users to interact with your application Each script you select is assigned a Vuser group Each Vuser group is assigned a number of Vusers You can Assign different script to each Vuser or You can assign the same script to all the Vusers
  • 73.
    LoadRunner 8.0 -Controller Adding Vuser Group Group Name Vuser Quantity Load Generator name
  • 74.
    LoadRunner 8.0 -Controller Load Generator for your Scenario Load Generator is a machine that serves as the host for running Vusers Its important to know that which script need to be run from which location For example customer activity, the function of location, workload of location…etc.,
  • 75.
    LoadRunner 8.0 -Controller Adding Load Generator Click the generators button to open the dialogue box Now click the add button to open the Add load generator dialogue box Enter the name and load generator platform which you want to add A machine must have installed LoadRunner agent to use as a Load Generator
  • 76.
    LoadRunner 8.0 -Controller Assigning Number of Vusers Simple scenarios use just one Vuser Script To profile a more complex mix of users, assign several Vuser scripts based on “User profile” in one scenario
  • 77.
  • 78.
    D a y - 3
  • 79.
    Agenda – Day3 Analysis & Reports
  • 80.
    LoadRunner Analysis Analysisprovides graphs and reports to help you analyze the performance of your system. These graphs and reports summarize the scenario execution. Using these graphs and reports, you can easily pinpoint and identify the bottlenecks in your Application
  • 81.
    LoadRunner Analysis Toview a summary of the results after test execution, you can use one or more of the following tools: Vuser log files contain a full trace of the scenario run for each Vuser. These files are located in the scenario results directory. Controller Output window displays information about the scenario run. Analysis graphs help you determine system performance and provide information about transactions and Vusers. Graph Data and Raw Data views display the actual data used to generate the graph in a spreadsheet format. Report utilities enable you to view a Summary HTML report for each graph or a variety of Performance and Activity reports. You can create a report as a Microsoft Word document, which automatically summarizes and displays the test’s significant data in graphical and tabular format.
  • 82.
  • 83.
    LoadRunner - AnalysisCreating Analysis Session When you run a scenario, data is stored in a result file with an .lrr extension. Analysis is the utility that processes the gathered result information and generates graphs and reports. When you work with the Analysis utility, you work within a sessio n. An Analysis session contains at least one set of scenario results (lrr file). Analysis stores the display information and layout settings for the active graphs in a file with an .lra extension.
  • 84.
    LoadRunner - AnalysisMethods of opening LoadRunner Analysis Open Analysis directly from the controller ( Results > Analyze Results)‏ Start > Programs > Mercury LoadRunner > Applications > Analysis Start > Programs > Mercury LoadRunner > LoadRunner , select the Load Testing or Tuning tab , and then click Analyze Load Tests or Analyze Tuning Sessions. You can also instruct controller to open analysis automatically after the Scenario execution by selecting Results > Auto Analysis
  • 85.
    Collating Execution Results When you run a scenario, by default all Vuser information is stored locally on each Vuser host After scenario execution the results are automatically collated or consolidated – results from all the hosts are transfer to results directory You disable automatic collation by choosing Results > Auto collate Results from the controller window You can collate manually by selecting Results > Collate Results If your results are not collated Analysis will automatically collate the results before generating the analysis data
  • 86.
    Viewing Summary DataAnalysis : Tools  Options Generate Summary data only View the summary data only. If this option is selected Analysis won’t Process the data for advanced use with filtration Generate Complete data only View only the complete data only after it has been Processed. Do not display the Summary Display Summary while generate Complete data only View summary data while the complete data is being processed. After the processing, view the complete data. A bar below the graph indicates the complete data generation progress.
  • 87.
    Data Aggregation AggregateData: Specify the data you want to aggregate in order to reduce the size of the database. Select the type of data to aggregate: Specify the type(s) of graphs for which you want to aggregate data. Select the graph properties to aggregate: Specify the graph properties— Vuser ID, Group Name, and Script Name—you want to aggregate. If you do not want to aggregate the failed Vuser data, select Do not aggregate failed Vusers.
  • 88.
    Setting Database OptionsYou can choose the database in which to store Analysis session result data and you can repair and compress your Analysis results and optimize the database that may have become fragmented. By default, LoadRunner stores Analysis result data in an Access 2000 database. If your Analysis result data exceeds two gigabytes, it is recommended that you store it on an SQL server
  • 89.
    Session Information Youcan view the properties of the current Analysis session in the Session Information dialog box.
  • 90.
    Analysis Graphs VuserGraphs - Provide information about Vuser states and other Vuser statistics. Error Graphs - Provide information about the errors that occurred during the scenario. Transaction Graphs - Provide information about transaction performance and response time. Web Resource Graphs - Provide information about the throughput, hits per second, HTTP responses per second, number of retries per second, and downloaded pages per second for Web Vusers. Web Page Breakdown Graphs - Provide information about the size and download time of each Web page component . Analysis graphs are divided into the following categories:
  • 91.
    Analysis Graphs User-DefinedData Point Graphs - Provide information about the custom data points that were gathered by the online monitor. System Resource Graphs - Provide statistics relating to the system resources that were monitored during the scenario using the online monitor. Network Monitor Graphs - Provide information about the network delays. Firewall Server Monitor Graphs - Provide information about firewall server resource usage. Web Server Resource Graphs - Provide information about the resource usage for the Apache, iPlanet/Netscape, iPlanet(SNMP), and MS IIS Web servers.
  • 92.
    Analysis Graphs WebApplication Server Resource Graphs - Provide information about the resource usage for various Web application servers. Database Server Resource Graphs - Provide information about database resources. Streaming Media Graphs - Provide information about resource usage of streaming media. ERP/CRM Server Resource Graphs - Provide information about ERP/CRM server resource usage. Java Performance Graphs - Provide information about resource usage of Java-based applications. Application Component Graphs - Provide information about resource usage of the Microsoft COM+ server and the Microsoft NET CLR server. Application Deployment Solutions Graphs - Provide information about resource usage of the Citrix MetaFrame and 1.8 servers.
  • 93.
    Analysis Graphs MiddlewarePerformance Graphs - Provide information about resource usage of the Tuxedo and IBM WebSphere MQ servers. Security Graphs - Provide information about simulated attacks on the server using the Distributed Denial of Service graph. Application Traffic Management Graphs - Provide information about resource usage of the F5 BIG-IP server. Infrastructure Resources Graphs - Provide information about resource usage of FTP, POP3, SMTP, IMAP, and DNS Vusers on the network client. Siebel Diagnostics Graphs - Provide detailed breakdown diagnostics for transactions generated on Siebel Web, Siebel App, and Siebel Database servers. Siebel DB Diagnostics Graphs - Provide detailed breakdown diagnostics for SQLs generated by transactions on the Siebel system.
  • 94.
    Analysis Graphs OracleDiagnostics Graphs - Provide detailed breakdown diagnostics for SQLs generated by transactions on the Oracle NCA system. J2EE Diagnostics Graphs - Provide information to trace, time, and troubleshoot individual transactions through J2EE Web, application, and database servers.
  • 95.
    Adding New GraphGraphs that contain data are listed in blue. By default, only graphs that contain data are listed. To view the entire list of LoadRunner graphs, clear Display only graphs containing data. Use the Scenario Elapsed Time field to limit the time range for which graph data is displayed. Graph > Add Graph, or click <New Graph> To view the entire list of LoadRunner graphs, clear Display only graphs containing data.
  • 96.
    Filtering & SortingGraph Data You can filter and sort data that is displayed in a graph. You sort and filter graph data using the same dialog box . Filtering Graph Data You can filter graph data to show fewer transactions for a specific segment of the scenario. More specifically, you can display four transactions beginning from five minutes into the scenario and ending three minutes before the end of the scenario. You can filter for a single graph, in all graphs in a scenario, or in the summary graph.
  • 97.
    Filtering & SortingGraph Data Sorting Graph Data You can sort graph data to show the data in more relevant ways. For example , Transaction graphs can be grouped by the Transaction End Status, and Vuser graphs can be grouped by Scenario Elapsed Time, Vuser End Status, Vuser Status, and VuserID.
  • 98.
    Configuring Basic GraphDisplay Options View  Display Options
  • 99.
    Configuring Basic GraphDisplay Options Adding Comments and Arrows
  • 100.
  • 101.
    Analyzing Graph Results Determining a Point’s Coordinates Drilling Down in a Graph Changing the Granularity of the Data Viewing the Data as a Spreadsheet and as Raw Data Viewing Measurement Trends Auto Correlating Measurements Using the WAN Emulation Overlay
  • 102.
    Determining a Point’sCoordinates You can determine the coordinates and values at any point in a graph. Place the cursor over the point you want to evaluate and Analysis displays the axis values and other grouping information.
  • 103.
    Drilling Down ina Graph Drill down enables you to focus on a specific measurement within your graph and display it according to a desired grouping. The available groupings depend on the graph. For example, the Average Transaction Response Time graph shows one line per transaction. To determine the response time for each Vuser, you drill down on one transaction and sort it according to Vuser ID. The graph displays a separate line for each Vuser's transaction response time. Note: The drill down feature is not available for the Web Page Breakdown graph.
  • 104.
    Changing the Granularityof the Data You can make the graphs easier to read and analyze by changing the granularity (scale) of the x-axis. The maximum granularity is half of the graph's time range. To ensure readability and clarity, Analysis automatically adjusts the minimum granularity of graphs with ranges of 500 seconds or more.
  • 105.
    Viewing the Dataas a Spreadsheet and as Raw Data You can view the graph in spreadsheet format using the Graph Data tab. You can view the actual Raw Data collected during test execution for the active graph. The Raw Data view is not available for all graphs.
  • 106.
    Correlating Graph MeasurementsAutomatically The minimum time range should be more than 5% of the total time range of the measurement. Trends which are smaller than 5% of the whole measurement will be contained in other larger segments.
  • 107.
    Using the WANEmulation Overlay During scenario execution, you can use WAN effects such as latency, packet loss, link faults, and dynamic routing to characterize many aspects of the WAN cloud. Using the WAN emulation overlay during Analysis, you can display the time period(s) in a scenario that the WAN emulator was active. By comparing measurements taken during WAN emulation to measurements taken with the WAN emulator feature disabled, you can see the impact of WAN settings on your network performance. View > Overlay with WAN Emulation
  • 108.
    Cross Result andMerged Graphs The Analysis utility lets you compare results and graphs to determine the source of a problem. Comparing results is essential for determining bottlenecks and problems. You use Cross Result graphs to compare the results of multiple scenario runs. You create Merged graphs to compare results from different graphs within the same scenario run.
  • 109.
    Cross Result GraphsCross Result graphs are useful for: Benchmarking hardware – Between Two Configurations Testing software versions – Between Two Versions Determining system capacity – To determine the capacity of the system If you want to benchmark two hardware configurations, you run the same scenario with both configurations and compare the transaction response times using a single Cross Result graph. Suppose that your vendor claims that a new software version is optimized to run quicker than a previous version. You can verify this claim by running the same scenario on both versions of the software, and comparing the scenario results.
  • 110.
    Generating Cross ResultGraphs File > Cross With Result You can create a Cross Result graph for two or more result sets. The Cross Result dialog box enables you to compare the results of multiple scenario runs. Click Add to add an additional result set to the Result List. Locate a results directory and select its result file ( .lrr ). Click OK . The scenario is added to the Result List.
  • 111.
  • 112.
    Merging Graphs Analysislets you merge the results of two graphs from the same scenario into a single graph. The merging allows you to compare several different measurements at once. For example, you can make a merged graph to display the network delay and number of running Vusers, as a function of the elapsed time. Select a graph with which you want to merge your active graph. Only the graphs with a common x-axis to the active graph are available. View > Merge Graphs
  • 113.
  • 114.
    Understanding the MergeGraphs Dialog Box The Merge Graphs dialog box enables you to merge two graphs into a single graph. In order to merge graphs, the graphs ' x-axes must be the same measurement . For example, you can merge Web Throughput and Hits per Second graphs, because their x-axes are Scenario Elapsed Time. Three Types of Merging : 1. Overlay 2. Tile 3. Correlate
  • 115.
    Understanding the MergeGraphs Dialog Box Overlay: Superimpose the contents of two graphs that share a common x-axis. The left y-axis on the merged graph shows the current graph's values. The right y-axis shows the values of the graph that was merged. There is no limit to the number of graphs that you can overlay. When you overlay two graphs, the y-axis for each graph is displayed separately to the right and left of the graph.
  • 116.
    Understanding the MergeGraphs Dialog Box Tile: View contents of two graphs that share a common x-axis in a tiled layout, one above the other. In the following example the Throughput and Hits per Second graph are tiled one above the other.
  • 117.
    Understanding the MergeGraphs Dialog Box Correlate: Plot the y-axis of two graphs against each other. The active graph's y-axis becomes the x-axis of the merged graph. The y-axis of the graph that was merged, becomes the merged graph's y-axis.
  • 118.
    Managing Results UsingQuality Center LoadRunner's integration with Quality Center lets you manage Analysis result sessions using Quality Center, Mercury's test management tool. LoadRunner works together with Quality Center to provide an efficient method for storing and retrieving scenarios and collecting results.
  • 119.
    Importing External Data The LoadRunner Analysis Import Data tool enables you to import and integrate non-Mercury data into a LoadRunner Analysis session.
  • 120.
    Importing External Data…SupportingFormats NT Performance Monitor (.csv)‏ Windows 2000 Performance Monitor (.csv)‏ Standard Comma Separated File (.csv)‏ Master-Detail Comma Separator File (.csv)‏ Microsoft Excel File (.xls)‏ Master-Detail Microsoft Excel File (.xls)‏
  • 121.
    Analysis Diagnostics Siebel Diagnostics Graphs Siebel DB Diagnostics Graphs Oracle Diagnostics Graphs J2EE Diagnostics Graphs After a scenario run, you can use the Siebel diagnostics graphs to analyze Siebel CRM server performance. Siebel diagnostics graphs enable you to trace, time, and troubleshoot individual transactions through Web, application, and database servers .
  • 122.
    Analysis Reports Analysis Reports includes the following sections: Understanding Analysis Reports Creating a Microsoft Word Report After running a scenario, you can use the Analysis reports to analyze the performance of your application. About Analysis Reports Viewing Summary Reports Creating HTML Reports Working with Transaction Reports Data Point Reports Failed Transaction Report Failed Vuser Report Data Point Report Detailed Transaction Report Transaction Performance by Vuser Report
  • 123.
    Analysis Reports AnalysisProvides the following Reports Summary Report HTML Reports Transaction Reports
  • 124.
    Summary Report TheSummary report provides general information about the scenario run. You can view the Summary report at any time from the Analysis window.
  • 125.
    HTML Report Reports  HTML Report You can instruct Analysis to create an HTML report. Analysis creates an HTML report for each one of the open graphs.
  • 126.
    Transaction Report Transactionreports provide performance information about the transactions defined within the Vuser scripts. These reports give you a statistical breakdown of your results and allow you to print and export the data. Transaction Reports are divided into the following categories Activity Performance Data Point, Detailed Transaction, Transaction Performance by Vuser Activity reports provide information about the number of Vusers and the number of transactions executed during the scenario run. The available Activity reports are Scenario Execution , Failed Transaction , and Failed Vusers . Performance reports analyze Vuser performance and transaction times. The available Performance reports are Data Point , Detailed Transaction , and Transaction Performance by Vuser .
  • 127.
    Activity Report ScenarioExecution Failed Transaction Failed Vusers
  • 128.
    Scenario Execution Report The Scenario Execution report is an Activity report that provides details about major events that occurred during the scenario run. This includes information on every Vuser, such as when it was ready to run and for how long it ran.
  • 129.
    Failed Transaction Report The Failed Transaction report is an Activity report that provides details about the beginning time, end time, and duration of the failed, but completed transaction.
  • 130.
    Failed Vuser Report The Failed Vuser report is an Activity report that provides details about all Vusers that were in the error, stopped, or done : failed states during the scenario execution. The Ready At and Running At times are relative to the computer's system clock.
  • 131.
    Data Point Report LoadRunner enables you to record your own data for analysis. You instruct LoadRunner to record the value of an external function or variable, also known as a data point , during the scenario run. The data point is set by including an lr_user_data_point function ( user_data_point for GUI Vusers) in your Vuser script. The Data Point graph shows the value of the data point during the scenario run. The x- axis represents the number of seconds that elapsed since the start time of the run. The y-axis displays the value of each recorded data point statement. The Data Point report is a Performance report that lists the name of the data point, its value, and the time its value was recorded. The values are displayed for each Group and Vuser.
  • 132.
  • 133.
    Detailed Transaction Report The Detailed Transaction (by Vuser) report is a Performance report that provides a list of all transactions executed by each Vuser during a scenario. The report provides details about the execution time of each transaction per Vuser.
  • 134.
    Transaction Performance byVuser Report Is a Performance report that displays the time required by each Vuser to perform transactions during the scenario. The report indicates if the transaction was successful and what the minimum, maximum, and average times were for each Vuser. This report is useful when you have several different types of Vusers in a scenario and you want to characterize performance for each type.
  • 135.
  • 136.
    Creating a MicrosoftWord Report You can create a report as a Microsoft Word document. Word Report generation tool to automatically summarize and display the test's significant data in graphical and tabular format and to display and describe all graphs in the current Analysis session. Other features of the report include the automatic inclusion of an overview of the LoadRunner Scenario configuration, and an executive summary. The report is structured into logical and intuitive sections with a table of contents and various appendices.
  • 137.
    Creating a MicrosoftWord Report Reports > Microsoft Word Reports...
  • 138.
  • 139.
    Q & AGurpreet Singh QA-Lead

Editor's Notes

  • #3 Session on Load Runner8.0 by Mahesh Anton [email_address]
  • #32 Session on Load Runner8.0 by Mahesh Anton [email_address]
  • #79 Session on Load Runner8.0 by Mahesh Anton manton@techmahindra.com