SlideShare a Scribd company logo
1 of 12
Download to read offline
1/12
Economic Bulletin
Q1 2013
At A Glance – Summary of Q1 highlights
EU food and drink industry evolution during Q1 2013 against major economic trends in the EU
EVOLUTION
OF MAIN
AGRICULTURAL
RAW MATERIAL
PRICES
Note 1: Except for imports and exports data which represent evolution of the current quarter compared to the same quarter
of the previous year, all other changes are represented with respect to the previous quarter of the same year.
Note 2: Unless otherwise specified, EU refers to the EU 27 in the text.
Economic trends in the EU
A general overview of the EU economic environment is given by data and trends shown in the table below. This
provides the background against which the analysis for the food and drink sector is carried out in the following
sections of the economic bulletin.
Table 1: Economic trends in the EU in recent periods
* With respect to previous quarter/month
** With respect to the same period (either quarter or month) in the previous year
Source: Eurostat, June 2013
2012q1 2012q2 2012q3 2012q4 2013q1 2013q1
Quarterly variations
(% change)*
Annual variations
(% change)**
Manufacturing sector (NACE Rev. 2)
Industrial production index -0.8 -0.7 0.4 -2.0 0.0 -2.3
All sectors
Private final consumption
(volume)
0.0 -0.3 -0.1 -0.2 0.1 -0.6
2012m11 2012m12 2013m01 2013m02 2013m03 2013m03
Retail trade volumes
Monthly variations
(% change)*
Annual variations
(% change)**
All sectors
0.3 -0.7 0.9 -0.1 -0.1 -1.4
Food, drinks and Tobacco
-0.3 -0.4 0.1 -0.1 1.2 -0.3
2/12
The EU manufacturing industrial production index remained unchanged in Q1 of 2013. In the same period,
private consumption (volumes) registered a slight increase compared to the previous quarter, i.e. 0.1%. The yearly
comparison shows that the industrial production index decreased in Q1 of 2013 compared to the same quarter of the
previous year, i.e. by -2.3%. Private consumption also decreased compared to the change registered in the same
quarter of 2012, but to a far lesser extent, i.e. -0.6%.
The volume of retail trade (all sectors) decreased by 0.1% in March 2013 (compared to February 2013), while
retail trade in food, drinks and tobacco increased by 1.2%. Among the Member States for which data are
available, total retail trade fell in nine, rose in eleven and remained stable in Austria. The largest decreases were
registered in Portugal (-3.0%), Slovenia (-2.6%) and Ireland (-1.9%), and the highest increases in Estonia
(+2.7%), Latvia (+2.1%) and Finland (+1.3%).
1
FOOD AND DRINK INDUSTRY INDICATORS IN Q1 OF 2013
1. Food and drink industry output index increased
After experiencing a decrease in the past quarter, Food and drink industry output (production) in the EU
started to increase again in Q1 of 2013 compared to the previous quarter, i.e. by 0.32%. This is a better
performance than that of the manufacturing production index, which remained unchanged in the same period (see
the above section: Economic trends in the EU).
A large number of the countries that had experienced negative growth in the food and drink industry output in Q4 of
2012 registered positive growth in Q1 of 2013 (i.e. Bulgaria, Czech Republic, Denmark, Hungary, Italy, Latvia,
Romania, Spain, the UK). At the same time, some countries experienced the opposite, i.e. moved from a positive to
a negative output growth path, namely Austria (-5.42%), Belgium (-0.71%), Estonia (-0.36%), France (-2.31%),
significantly Ireland (from +7.98% to -6.06%). Other countries maintained their negative trend also in Q1 of 2013 (i.e.
Finland, Greece).
Table 2: Industry production index, quarterly growth
Member State
2012 Q4/2012 Q3
(% change)
2013 Q1/2012 Q4
(% change)
EU27 -0,58 0,32
Austria 3.19 -5.42
Belgium 0,34 -0,71
Bulgaria -3,01 0,10
Czech Republic -1,46 4,09
Denmark -0,53 1,66
Estonia 1,26 -0,36
Finland -0,89 -0,21
France 0,66 -2,31
Germany 1,36 1,24
Greece -4,02 -0,11
Hungary -3,22 1,54
Ireland 7,98 -6,06
Italy -4,49 2,12
Latvia -1,74 3,55
Lithuania 0,10 1,83
Netherlands 0,11 1,72
Poland 0,82 0,80
Portugal 0,23 1,58
Romania -2,04 2,37
Spain -0,96 0,99
Sweden 0,66 0,99
United Kingdom -2,98 0,54
Source: Eurostat, Short-Term Business Statistics, NACE Rev. 2, June 2013
1
Eurostat news release, Euro indicators, STAT/13/72.
3/12
2. Evolution of main agricultural raw material prices
The following shows a mixed picture for raw material prices:
Oils and oil crops
Grains Dairy Soybean Rape
Cocoa Coffee Sugar Corn/
Maize
Soft
wheat
WMP SMP Oil Bean Meal Seed Oil Palm
oil
Source: FoodDrinkEurope compilation
Cocoa and coffee
Quarterly developments: Continuing the fall in prices in Q4 of 2012, the average price of cocoa fell by 9.9% in Q1
of 2013. Coffee composite prices also experienced a negative trend and were 4% lower in Q1 of 2013 than Q4 of
2012.
Year-on-year developments: The year-on-year comparison shows that, the New York cocoa market recorded a
5.6% decrease with respect to Q1 of 2012. However, coffee composite prices were significantly lower than their level
in the same quarter of 2012, i.e. by 26.1%.
Source: International Cocoa Organisation (ICCO) and International Coffee Organisation (ICO), June 2013
Sugar
Quarterly developments: EU white sugar prices slightly increased (+1.5%) in Q1 of 2013. In the same quarter, U.S.
market price continued to decrease, i.e. by 17.5% compared to Q4 of 2012.
Year-on-year developments: On average, EU market price for white sugar was 4.6% higher in Q1 of 2013 than the
same quarter of the previous year whereas the U.S. market price was 44.2% lower than the average in Q1 of 2012.
In comparison, the world sugar price was 20.8% lower than the average of the same quarter of 2012.
0
1000
2000
3000
4000
5000
6000
Jan-07
Apr-07
Jul-07
Oct-07
Jan-08
Apr-08
Jul-08
Oct-08
Jan-09
Apr-09
Jul-09
Oct-09
Jan-10
Apr-10
Jul-10
Oct-10
Jan-11
Apr-11
Jul-11
Oct-11
Jan-12
Apr-12
Jul-12
Oct-12
Jan-13
Apr-13
Cocoa NY market price and coffee world price
(monthly averages, current price, $/t)
Cocoa price in $/t Coffee composite price in $/t
4/12
Source: European Commission – Circa (Regulations (EC) No 562/2005 Article 6(1) and 479/2010 Article 2), United States
Department of Agriculture, June 2013
Grains
Corn maize prices
Quarterly developments: Following the trend of the previous quarter, EU maize prices slightly decreased in Q1 of
2013 (compared to Q4 of 2012), i.e. by 3.2%. U.S. maize prices also decreased in the same period, i.e. by 6.5%,
thus continuing the negative growth trend of the previous quarter.
Year-on-year developments: On average, EU maize prices were 18% higher in Q1 of 2013 than the same quarter
of the previous year. Similarly but to a lesser extent, U.S. maize prices were 8.8% higher in Q1 of 2013 than in the
same quarter of the previous year.
Source: FAO and European Commission (DG Agri), June 2013
0
200
400
600
800
1000
1200
Jan'07
Mar
May
Jul
Sep
Nov
Jan'08
Mar
May
Jul
Sep
Nov
Jan'09
Mar
May
Jul
Sep
Nov
Jan'10
Mar
May
Jul
Sep
Nov
Jan'11
Mar
May
July
Sep
Nov
Jan'12
Mar
May
Jul
Sep
Nov
Jan'13
Mar
White Sugar prices
(monthly averages, current prices, €/t)
World price US market price EU reference price EU average price
0
50
100
150
200
250
300
Jan-07
May-07
Sep-07
Jan-08
May-08
Sep-08
Jan-09
May-09
Sep-09
Jan-10
May-10
Sep-10
Jan-11
May-11
Sep-11
Jan-12
May-12
Sep-12
Jan-13
Corn/maize market prices
(monthly averages, current prices, €/t
DG Agri EU market price €/t FAO US market price €/t
5/12
Soft wheat prices
Quarterly developments: Contrary to the previous quarter, EU soft wheat prices slightly decreased in Q1 of 2013
(compared to Q4 of 2012) i.e. by 1.2%. U.S. soft wheat prices decreased during the same period i.e. by 13%.
Year-on-year developments: On average, EU soft wheat prices were 24.5% higher in Q1 of 2013 than the same
quarter of the previous year. Similarly, but to a lesser extent, U.S. soft wheat prices were 15.5% higher in Q1 of 2013
than in the same quarter of the previous year.
Source: FAO and European Commission (DG Agri), June 2013
Dairy
Skimmed Milk Powder (SMP)
Quarterly developments: EU SMP prices registered a slight decrease in Q1 of 2013 (compared to Q4 of 2012) i.e.
by 0.64%. While in Q4 of 2012 average EU prices had exceeded world market prices for the first time since Q3 of
2009, this trend was reversed in Q1 of 2013.
Year-on-year developments: The yearly comparison shows that, on average, EU SMP prices were 16.7% higher in
Q1 of 2013 than the same period in 2013.
0
50
100
150
200
250
300
Jan-07
May-07
Sep-07
Jan-08
May-08
Sep-08
Jan-09
May-09
Sep-09
Jan-10
May-10
Sep-10
Jan-11
May-11
Sep-11
Jan-12
May-12
Sep-12
Jan-13
Soft wheat market prices
(monthly averages, current prices, €/t)
DG Agri EU market price €/t FAO US market price €/t
6/12
Source: FAO, CLAL consultancy (discontinued after January 2011 to the benefit of the European Commission source),
European Commission – Circa (Regulations (EC) No 562/2005 Article 6(1) and 479/2010 Article 2), June 2013
Whole Milk Powder (WMP)
Quarterly developments: Generally higher than world market prices since Q3 of 2010, EU WMP average prices
continued to increase in Q1 of 2013, i.e. by 2.5% from the previous quarter.
Year-on-year developments: The yearly comparison shows that, on average, EU WMP prices increased by 5.6% in
Q1 of 2013 compared to the same quarter of 2012.
Source: FAO, CLAL consultancy (discontinued after January 2011 to the benefit of the European Commission source),
European Commission – Circa (Regulations (EC) No 562/2005 Article 6(1) and 479/2010 Article 2), June 2013
0
500
1000
1500
2000
2500
3000
3500
4000
4500
Jan'07
Mar
May
Jul
Sep
Nov
Jan'08
Mar
May
Jul
Sep
Nov
Jan'09
Mar
May
Jul
Sep
Nov
Jan'10
Mar
May
Jul
Sep
Nov
Jan'11
Mar
May
Jul
Sep
Nov
Jan'12
Mar
May
Jul
Sep
Nov
Jan'13
Mar
SMP
(monthly averages, current prices, €/t)
FAO €/t World market price CLAL €/t EU market price
CIRCA €/t EU market price R. 1234/07 €/t EU reference price
1000
1500
2000
2500
3000
3500
4000
Jan'08
Mar
May
Jul
Sep
Nov
Jan'09
Mar
May
Jul
Sep
Nov
Jan'10
Mar
May
Jul
Sep
Nov
Jan'11
Mar
May
Jul
Sep
Nov
Jan'12
Mar
May
Jul
Sep
Nov
Jan'13
Mar
WMP
(monthly averages, current prices, €/t)
World market price CLAL €/t EU market price CIRCA €/t EU market price
7/12
Oils and oil crops
Quarterly developments: In Q1 of 2013 Soybean and Soybean meal prices declined by 6.3% and 9.5%
respectively. Prices for Soybean oil (+0.2%), Palm oil (+5.3%), Rape oil (+0.2%) and Rapeseed (+1.3%) experienced
a general increase. Moreover, after having significantly decreased during the previous quarter, prices of Palm oil (-
18.5%) increased most of all oils and oil crops in Q1 of 2013.
Year-on-year developments: The yearly comparison shows that in Q1 of 2013 only Soybean meal, Soybean and
Rapeseed prices were higher than in the same quarter of 2012: by 35.6%, 9.4% and 2.6% respectively. On the
contrary Palm oil, Soybean oil and Rape oil were 23.0%, 7.4% and 6.3% lower in Q1 of 2013 than the same period
of the previous year.
Source: World Bank and FAO, June 2013
3. Price developments in the food supply chain
Consumer prices (1.34%) and producer prices (0.44%) grew on average in Q1 of 2013, whereas inflation remained
almost unchanged (-0.04%).
0
200
400
600
800
1000
1200
1400
1600
1800
Jan-07
May-07
Sep-07
Jan-08
May-08
Sep-08
Jan-09
May-09
Sep-09
Jan-10
May-10
Sep-10
Jan-11
May-11
Sep-11
Jan-12
May-12
Sep-12
Jan-13
Oils and oilcrop prices
(monthly averages, current prices, $/t)
Soybean oil $/t Soybeans $/t Soybean meal $/t
Palm oil $/t Rape oil $/t Rapeseed $/t
8/12
Source: Eurostat (Food supply chain monitor), June 2013
4. Employment index of the EU food and drink industry grew for two consecutive
quarters
After having experienced a slight decrease in Q3 of 2012, the labour input index for the food and drink industry
increased (+0.28%) in Q4 of last year and further improved (+0.02%) in Q1 of 2013. This is contrary to the
performance shown by the (total) manufacturing sector whose employment index decreased for the past three
quarters and by 0.30% in Q1 of 2013.
When looking at the industry breakdown, the food sector employment index increased by 0.15%, whereas the
beverages industry employment index decreased by 0.5% in comparison with the previous quarter.
Source: Eurostat (SBS), Nace Rev. 2, seasonally adjusted data, June 2013.
95.0
100.0
105.0
110.0
115.0
120.0
125.0
130.0
135.0
140.0
145.0
2007M01
2007M04
2007M07
2007M10
2008M01
2008M04
2008M07
2008M10
2009M01
2009M04
2009M07
2009M10
2010M01
2010M04
2010M07
2010M10
2011M01
2011M04
2011M07
2011M10
2012M01
2012M04
2012M07
2012M10
2013M01
Agricultural Commodity Price Producer Price
Consumer Price Overall inflation (All-items HICP)
EU27: Price developments in the food supply chain (2005 = 100)
80
85
90
95
100
105
110
2010Q1
2010Q2
2010Q3
2010Q4
2011Q1
2011Q2
2011Q3
2011Q4
2012Q1
2012Q2
2012Q3
2012Q4
2013Q1
Labour input index (2010=100) : food and drink industry trends
compared to total manufacturing
Manufacturing Manufacture of food products Manufacture of beverages
9/12
5. Food and drink industry turnover continued to increase
The food and drink industry’s turnover index increased by 1.38% in Q1 of 2013 compared to the previous quarter.
Source: Eurostat (SBS), seasonally adjusted data, June 2013
6. Imported food prices continued to rise in Q1 of 2013
Continuing the trend which started in Q1 of 2010, imported food prices continued to increase in Q1 of 2013, up to
0.63% from the previous quarter.
Source: Eurostat (SBS), June 2013
90.00
95.00
100.00
105.00
110.00
115.00
2007Q1
2007Q2
2007Q3
2007Q4
2008Q1
2008Q2
2008Q3
2008Q4
2009Q1
2009Q2
2009Q3
2009Q4
2010Q1
2010Q2
2010Q3
2010Q4
2011Q1
2011Q2
2011Q3
2011Q4
2012Q1
2012Q2
2012Q3
2012Q4
2013Q1
EU27: Turnover index (2010 = 100)
Manufacture of food products and beverages
80.00
85.00
90.00
95.00
100.00
105.00
110.00
115.00
2007Q1
2007Q2
2007Q3
2007Q4
2008Q1
2008Q2
2008Q3
2008Q4
2009Q1
2009Q2
2009Q3
2009Q4
2010Q1
2010Q2
2010Q3
2010Q4
2011Q1
2011Q2
2011Q3
2011Q4
2012Q1
2012Q2
2012Q3
2012Q4
2013Q1
Euro area
Food and drink import price index (2010 = 100)
10/12
Exchange rates
In Q1 of 2013, the euro has appreciated against most major non-EU currencies in an environment of low volatility
and strengthened investor sentiment towards the euro area
2
. In the past three months, the euro gained 1.84%
against the US dollar, 5.41% against the pound sterling and also strongly appreciated against the Japanese Yen by
15.87%.
The table below gives details for the euro appreciation against the currencies of major trading partners.
Table 3: Evolution of quarterly average exchange rates
1 EUR = 2012 Q4 2013 Q1
Q1 2013/ Q4 2012
%
Australian Dollar 1.25 1.27 1.84
Canadian Dollar 1.29 1.33 3.60
Brazilian Real 2.67 2.64 -1.14
Swiss Franc 1.21 1.23 1.69
Chinese Yuan Renminbi 8.10 8.22 1.45
Japanese Yen 105.12 121.80 15.87
New Zealand Dollar 1.58 1.58 0.46
United States Dollar 1.30 1.32 1.84
Pound Sterling 0.81 0.85 5.41
Source: ECB, bilateral exchange rates, June 2013
7. Trade: Exports increased in Q1 of 2013 year-on-year
The EU trade balance in food and drink products continued to improve during the Q1 of 2013 compared to the same
period of 2012. The export surplus amounted to nearly €5.3 billion, which marks an increase of €0.8 billion year-on-
year.
2
European Central Bank, monthly bulletin, March 2013.
Imports Q1 of 2013 Exports Q1 of 2013
Total food and drink imports amounted to €15.7
billion, i.e. 0.1% less compared to the previous
year. However, a real reduction of imports in terms of
quantity and value was observed for only a limited
group of alcoholic beverages, dairy products, and fruits
and vegetables. For oils and fat products, the import
growth in terms of value was linked to the price factor,
while the imported quantity was in fact significantly
lower than a year ago. Finally, some products
registered a real import reduction both in terms of
volume and value, e.g. dairy (-26% in value and -23.9%
in volume), fruit and vegetables (-8.6% in value and -
10.7% in volume), and less significantly, cider and malt
beverages.
Total food and drink exports amounted to €20.9
billion, i.e. 4.1% more compared to the same period
of 2012. In fact, the total value of exports increased
despite an almost unchanged total export volume
(+0.1%). The year-on-year export growth registered for
oils and fats, prepared animal feeds and bakery and
farinaceous products was also very positive (+23.1%,
15.3%, 10.3% respectively) and matched with a similar
trend in terms of exported quantities. Finally, grain mill
and starch products, and wines contributed also to the
growth in export value, despite witnessing a double-
digit volume reduction. A single-digit volume reduction
was registered for other food products.
11/12
Trade balance in € million
Q1
2012 2013
Total of Food and Drink 4,424 5,251
Meat products 1,043 1,017
Fish and sea food products -2,910 -2,782
Processed fruit and vegetables -739 -504
Oils and fats -2,862 -2,639
Dairy products 2,031 2,074
Grain mill and starch products 325 301
Bakery & farinaceous products 618 681
Other food products 1,926 1,937
Prepared animal feed 477 529
Drinks 4,434 4,636
Trade partner profile – United States of America (USA)
Launch of the Transatlantic Trade and Investment Partnership (TTIP) with the US
At the G8 Summit on 17 June 2013, US President Barack Obama, President of the European Commission José
Manuel Barroso, President of the European Council Herman Van Rompuy and UK Prime Minister David Cameron
officially launched negotiations for TTIP. Beforehand, EU Member States agreed on the negotiating guidelines by
consensus and hence decided to give the European Commission 'the green light' to start negotiations with the
United States. The first round of negotiations is set to start on 8 July in Washington.
The initiative of a transatlantic agreement is based on the recommendations of the EU-US High Level Working
Group on Jobs and Growth that steered the deliberations on the future EU-US relations since late 2011. According to
an independent study by the Centre for Economic Policy Research, London, an ambitious and comprehensive trans-
Atlantic trade and investment partnership could bring the EU economic gains of €119 billion a year once the
agreement is fully implemented. This would translate on average to an extra €545 in disposable income each year
for a family of four in the EU.
3
EU-US food and drink trade
The US represents the first export destination for European food and drink products (followed by Russia,
Switzerland, Japan, China). It is also the third most important source of food imports for the EU, after Brazil and
Argentina. European exports to the US amounted to nearly €13.6 billion in 2012, equivalent to 5% of the EU overall
exports to the US, while imports were close to €4.4 billion. The EU contributes 22% to US food and drink imports,
which gives it the leading position, before Canada (18%), Mexico (10%) and China (7%).
4
Exports from the EU to the US Imports from the US to the EU
Rank
US ranks 1
st
among EU food and
drink export destinations
US ranks 3
rd
among EU food and
drink suppliers
Value €13.6 billion €4.4 billion
Share of non-annex 1 products 44% 22%
Source: Eurostat COMEXT, own calculations
The trade balance is largely positive for the EU as regards processed food products. The EU exports more than
three times as much as it imports from the US. The EU positive trade balance also increased by 34% over the last
decade, which is in line with export growth over the same period.
3
European Commission MEMO, Brussels, 18 June 2013 - The EU's free trade agreements – where are we?
http://trade.ec.europa.eu/doclib/docs/2012/november/tradoc_150129.pdf
4
UN COMTRADE, 2012 data
12/12
Evolution of EU exports and imports from the US, 2002 – 2012, in € million
Source: Eurostat COMEXT
The following charts present the respective weight of different categories of food and drink in the total value of EU-
US food and drink trade. EU food and drink exports to the US are dominated by beverages (57%) – mainly spirits,
wine, beer, and soft drinks – followed by dairy, oils and chocolate. The two biggest categories of products imported
from the US were beverages, fish products followed by animal feed and food preparations.
Exports from the EU Imports to the EU
Source: Eurostat COMEXT
FoodDrinkEurope - represents the European food and drink industry - the leading industrial sector and major EU employer and
exporter. FoodDrinkEurope’s role is to represent the food and drink industry’s interests, at the level of both European and
international institutions. FoodDrinkEurope’s membership consists of 24 national federations and 3 observers, 25 European sector
associations and 18 major food and drink companies.
For further information, please contact:
Lisa McCooey, Communications Director / Deputy Director General. Tel: + 32 2 508 10 24 -
l.mccooey@fooddrinkeurope.eu
0
2
4
6
8
10
12
14
16
2002 2003 2004 2005 2006 2007 2008 2009 2010 2011 2012
Exports
Imports
57%
5%
5%
3%
3%
3%
2% 22%
beverages
dairy
oils
chocolate
coffee
pastries or biscuits
food preparations
other
31%
16%
13%9%
5%
4%
4% 18%
beverages
fish products
animal feed/petfoods
food preparations
processed f&v
oils
meat products
other

More Related Content

What's hot

EU: Unconcentrated Fruit And Vegetable Juices - Market Report. Analysis And F...
EU: Unconcentrated Fruit And Vegetable Juices - Market Report. Analysis And F...EU: Unconcentrated Fruit And Vegetable Juices - Market Report. Analysis And F...
EU: Unconcentrated Fruit And Vegetable Juices - Market Report. Analysis And F...IndexBox Marketing
 
U.S. Organic Tobacco Market. Analysis and Forecast To 2025
U.S. Organic Tobacco Market. Analysis and Forecast To 2025U.S. Organic Tobacco Market. Analysis and Forecast To 2025
U.S. Organic Tobacco Market. Analysis and Forecast To 2025IndexBox Marketing
 
EU: Coffee Extracts, Essences and Concentrates – Market Report. Analysis and ...
EU: Coffee Extracts, Essences and Concentrates – Market Report. Analysis and ...EU: Coffee Extracts, Essences and Concentrates – Market Report. Analysis and ...
EU: Coffee Extracts, Essences and Concentrates – Market Report. Analysis and ...IndexBox Marketing
 
2012 gs indian econ lecture 11
2012 gs indian econ lecture 112012 gs indian econ lecture 11
2012 gs indian econ lecture 11Dr. Subir Maitra
 
EU: Mixtures Of Odoriferous Substances And Their Preparations - Market Report...
EU: Mixtures Of Odoriferous Substances And Their Preparations - Market Report...EU: Mixtures Of Odoriferous Substances And Their Preparations - Market Report...
EU: Mixtures Of Odoriferous Substances And Their Preparations - Market Report...IndexBox Marketing
 
Lithuanian Economy, No. 2 - March 9, 2012
Lithuanian Economy, No. 2 - March 9,  2012Lithuanian Economy, No. 2 - March 9,  2012
Lithuanian Economy, No. 2 - March 9, 2012Swedbank
 
Lithuanian Economy - No 1, January 4, 2012
Lithuanian Economy - No 1, January 4,  2012Lithuanian Economy - No 1, January 4,  2012
Lithuanian Economy - No 1, January 4, 2012Swedbank
 
Panorama COFACE "Barometre Sector Risk" diciembre 2015
Panorama COFACE "Barometre Sector Risk" diciembre 2015Panorama COFACE "Barometre Sector Risk" diciembre 2015
Panorama COFACE "Barometre Sector Risk" diciembre 2015Jaime Cubillo Fleming
 
U.S. Organic Sorghum Market. Analysis and Forecast To 2025
U.S. Organic Sorghum Market. Analysis and Forecast To 2025U.S. Organic Sorghum Market. Analysis and Forecast To 2025
U.S. Organic Sorghum Market. Analysis and Forecast To 2025IndexBox Marketing
 
Electrolux Interim Report Q2 2013 Presentation
Electrolux Interim Report Q2 2013 PresentationElectrolux Interim Report Q2 2013 Presentation
Electrolux Interim Report Q2 2013 PresentationElectrolux Group
 
Kemira Q1 2013 Interim Report
Kemira Q1 2013 Interim ReportKemira Q1 2013 Interim Report
Kemira Q1 2013 Interim ReportKemira Oyj
 
U.S. Organic Honey Market. Analysis and Forecast To 2025
U.S. Organic Honey Market. Analysis and Forecast To 2025U.S. Organic Honey Market. Analysis and Forecast To 2025
U.S. Organic Honey Market. Analysis and Forecast To 2025IndexBox Marketing
 
EU: Concentrated Fruit and Vegetable Juices – Market Report. Analysis and For...
EU: Concentrated Fruit and Vegetable Juices – Market Report. Analysis and For...EU: Concentrated Fruit and Vegetable Juices – Market Report. Analysis and For...
EU: Concentrated Fruit and Vegetable Juices – Market Report. Analysis and For...IndexBox Marketing
 
World: Honey - Market Report. Analysis And Forecast To 2020
World: Honey - Market Report. Analysis And Forecast To 2020World: Honey - Market Report. Analysis And Forecast To 2020
World: Honey - Market Report. Analysis And Forecast To 2020IndexBox Marketing
 
Slovenia: Frozen Vegetables - Market Report. Analysis And Forecast To 2020
Slovenia: Frozen Vegetables - Market Report. Analysis And Forecast To 2020Slovenia: Frozen Vegetables - Market Report. Analysis And Forecast To 2020
Slovenia: Frozen Vegetables - Market Report. Analysis And Forecast To 2020IndexBox Marketing
 
Asi esta the_economy June 2016 circulo de empresarios
Asi esta the_economy June 2016 circulo de empresariosAsi esta the_economy June 2016 circulo de empresarios
Asi esta the_economy June 2016 circulo de empresariosCírculo de Empresarios
 
U.S. Organic Grape Market. Analysis and Forecast To 2025
U.S. Organic Grape Market. Analysis and Forecast To 2025U.S. Organic Grape Market. Analysis and Forecast To 2025
U.S. Organic Grape Market. Analysis and Forecast To 2025IndexBox Marketing
 
U.S. Organic Cherry Market. Analysis and Forecast To 2025
U.S. Organic Cherry Market. Analysis and Forecast To 2025U.S. Organic Cherry Market. Analysis and Forecast To 2025
U.S. Organic Cherry Market. Analysis and Forecast To 2025IndexBox Marketing
 
EMEA Economic Insight August 2010
EMEA Economic Insight August 2010EMEA Economic Insight August 2010
EMEA Economic Insight August 2010Manpower EMEA
 

What's hot (20)

EU: Unconcentrated Fruit And Vegetable Juices - Market Report. Analysis And F...
EU: Unconcentrated Fruit And Vegetable Juices - Market Report. Analysis And F...EU: Unconcentrated Fruit And Vegetable Juices - Market Report. Analysis And F...
EU: Unconcentrated Fruit And Vegetable Juices - Market Report. Analysis And F...
 
U.S. Organic Tobacco Market. Analysis and Forecast To 2025
U.S. Organic Tobacco Market. Analysis and Forecast To 2025U.S. Organic Tobacco Market. Analysis and Forecast To 2025
U.S. Organic Tobacco Market. Analysis and Forecast To 2025
 
EU: Coffee Extracts, Essences and Concentrates – Market Report. Analysis and ...
EU: Coffee Extracts, Essences and Concentrates – Market Report. Analysis and ...EU: Coffee Extracts, Essences and Concentrates – Market Report. Analysis and ...
EU: Coffee Extracts, Essences and Concentrates – Market Report. Analysis and ...
 
2012 gs indian econ lecture 11
2012 gs indian econ lecture 112012 gs indian econ lecture 11
2012 gs indian econ lecture 11
 
EU: Mixtures Of Odoriferous Substances And Their Preparations - Market Report...
EU: Mixtures Of Odoriferous Substances And Their Preparations - Market Report...EU: Mixtures Of Odoriferous Substances And Their Preparations - Market Report...
EU: Mixtures Of Odoriferous Substances And Their Preparations - Market Report...
 
Lithuanian Economy, No. 2 - March 9, 2012
Lithuanian Economy, No. 2 - March 9,  2012Lithuanian Economy, No. 2 - March 9,  2012
Lithuanian Economy, No. 2 - March 9, 2012
 
Lithuanian Economy - No 1, January 4, 2012
Lithuanian Economy - No 1, January 4,  2012Lithuanian Economy - No 1, January 4,  2012
Lithuanian Economy - No 1, January 4, 2012
 
Panorama COFACE "Barometre Sector Risk" diciembre 2015
Panorama COFACE "Barometre Sector Risk" diciembre 2015Panorama COFACE "Barometre Sector Risk" diciembre 2015
Panorama COFACE "Barometre Sector Risk" diciembre 2015
 
Slovakia 2013-2014
Slovakia 2013-2014Slovakia 2013-2014
Slovakia 2013-2014
 
U.S. Organic Sorghum Market. Analysis and Forecast To 2025
U.S. Organic Sorghum Market. Analysis and Forecast To 2025U.S. Organic Sorghum Market. Analysis and Forecast To 2025
U.S. Organic Sorghum Market. Analysis and Forecast To 2025
 
Electrolux Interim Report Q2 2013 Presentation
Electrolux Interim Report Q2 2013 PresentationElectrolux Interim Report Q2 2013 Presentation
Electrolux Interim Report Q2 2013 Presentation
 
Kemira Q1 2013 Interim Report
Kemira Q1 2013 Interim ReportKemira Q1 2013 Interim Report
Kemira Q1 2013 Interim Report
 
U.S. Organic Honey Market. Analysis and Forecast To 2025
U.S. Organic Honey Market. Analysis and Forecast To 2025U.S. Organic Honey Market. Analysis and Forecast To 2025
U.S. Organic Honey Market. Analysis and Forecast To 2025
 
EU: Concentrated Fruit and Vegetable Juices – Market Report. Analysis and For...
EU: Concentrated Fruit and Vegetable Juices – Market Report. Analysis and For...EU: Concentrated Fruit and Vegetable Juices – Market Report. Analysis and For...
EU: Concentrated Fruit and Vegetable Juices – Market Report. Analysis and For...
 
World: Honey - Market Report. Analysis And Forecast To 2020
World: Honey - Market Report. Analysis And Forecast To 2020World: Honey - Market Report. Analysis And Forecast To 2020
World: Honey - Market Report. Analysis And Forecast To 2020
 
Slovenia: Frozen Vegetables - Market Report. Analysis And Forecast To 2020
Slovenia: Frozen Vegetables - Market Report. Analysis And Forecast To 2020Slovenia: Frozen Vegetables - Market Report. Analysis And Forecast To 2020
Slovenia: Frozen Vegetables - Market Report. Analysis And Forecast To 2020
 
Asi esta the_economy June 2016 circulo de empresarios
Asi esta the_economy June 2016 circulo de empresariosAsi esta the_economy June 2016 circulo de empresarios
Asi esta the_economy June 2016 circulo de empresarios
 
U.S. Organic Grape Market. Analysis and Forecast To 2025
U.S. Organic Grape Market. Analysis and Forecast To 2025U.S. Organic Grape Market. Analysis and Forecast To 2025
U.S. Organic Grape Market. Analysis and Forecast To 2025
 
U.S. Organic Cherry Market. Analysis and Forecast To 2025
U.S. Organic Cherry Market. Analysis and Forecast To 2025U.S. Organic Cherry Market. Analysis and Forecast To 2025
U.S. Organic Cherry Market. Analysis and Forecast To 2025
 
EMEA Economic Insight August 2010
EMEA Economic Insight August 2010EMEA Economic Insight August 2010
EMEA Economic Insight August 2010
 

Viewers also liked

20131211 Ecotrofood Final Event
20131211 Ecotrofood Final Event20131211 Ecotrofood Final Event
20131211 Ecotrofood Final EventFIAB
 
20130925 H2020 Girona Federico Morais: La plataforma tecnológica food for lif...
20130925 H2020 Girona Federico Morais: La plataforma tecnológica food for lif...20130925 H2020 Girona Federico Morais: La plataforma tecnológica food for lif...
20130925 H2020 Girona Federico Morais: La plataforma tecnológica food for lif...FIAB
 
20140618 financiación i+d+i
20140618 financiación i+d+i20140618 financiación i+d+i
20140618 financiación i+d+iFIAB
 
OCDE_Health at a glance 2013
OCDE_Health at a glance 2013OCDE_Health at a glance 2013
OCDE_Health at a glance 2013FIAB
 
20130911 Talleres H2020 Zaragoza PT en H2020. Federico Morais
20130911 Talleres H2020 Zaragoza PT en H2020.  Federico Morais20130911 Talleres H2020 Zaragoza PT en H2020.  Federico Morais
20130911 Talleres H2020 Zaragoza PT en H2020. Federico MoraisFIAB
 
European quality foods logop
European quality foods logopEuropean quality foods logop
European quality foods logopFIAB
 
Presentación proyecto Wastered
Presentación proyecto WasteredPresentación proyecto Wastered
Presentación proyecto WasteredFIAB
 
Informe Marco estratégico para la IAB
Informe Marco estratégico para la IABInforme Marco estratégico para la IAB
Informe Marco estratégico para la IABFIAB
 
Press Release: Spanish food & drinks at John Lewis Foodhalls
Press Release: Spanish food & drinks at John Lewis FoodhallsPress Release: Spanish food & drinks at John Lewis Foodhalls
Press Release: Spanish food & drinks at John Lewis FoodhallsFIAB
 

Viewers also liked (9)

20131211 Ecotrofood Final Event
20131211 Ecotrofood Final Event20131211 Ecotrofood Final Event
20131211 Ecotrofood Final Event
 
20130925 H2020 Girona Federico Morais: La plataforma tecnológica food for lif...
20130925 H2020 Girona Federico Morais: La plataforma tecnológica food for lif...20130925 H2020 Girona Federico Morais: La plataforma tecnológica food for lif...
20130925 H2020 Girona Federico Morais: La plataforma tecnológica food for lif...
 
20140618 financiación i+d+i
20140618 financiación i+d+i20140618 financiación i+d+i
20140618 financiación i+d+i
 
OCDE_Health at a glance 2013
OCDE_Health at a glance 2013OCDE_Health at a glance 2013
OCDE_Health at a glance 2013
 
20130911 Talleres H2020 Zaragoza PT en H2020. Federico Morais
20130911 Talleres H2020 Zaragoza PT en H2020.  Federico Morais20130911 Talleres H2020 Zaragoza PT en H2020.  Federico Morais
20130911 Talleres H2020 Zaragoza PT en H2020. Federico Morais
 
European quality foods logop
European quality foods logopEuropean quality foods logop
European quality foods logop
 
Presentación proyecto Wastered
Presentación proyecto WasteredPresentación proyecto Wastered
Presentación proyecto Wastered
 
Informe Marco estratégico para la IAB
Informe Marco estratégico para la IABInforme Marco estratégico para la IAB
Informe Marco estratégico para la IAB
 
Press Release: Spanish food & drinks at John Lewis Foodhalls
Press Release: Spanish food & drinks at John Lewis FoodhallsPress Release: Spanish food & drinks at John Lewis Foodhalls
Press Release: Spanish food & drinks at John Lewis Foodhalls
 

Similar to FoodDrinkEurope _ Boletín económico 1Q 2013

Pressreleasecpi sint maarten_201306
Pressreleasecpi sint maarten_201306Pressreleasecpi sint maarten_201306
Pressreleasecpi sint maarten_201306PearlRadio Station
 
Así está the economy november 2015 Circulo de Empresarios
Así está the economy november 2015 Circulo de EmpresariosAsí está the economy november 2015 Circulo de Empresarios
Así está the economy november 2015 Circulo de EmpresariosCírculo de Empresarios
 
Volume of retail trade down by 0.2% in both euro area and EU28
Volume of retail trade down by 0.2% in both euro area and EU28Volume of retail trade down by 0.2% in both euro area and EU28
Volume of retail trade down by 0.2% in both euro area and EU28Giuseppe Fumagalli
 
UK Consumer Price Inflation
UK Consumer Price InflationUK Consumer Price Inflation
UK Consumer Price InflationRichard Ramsey
 
Industrial production down by 0.8% in euro area
Industrial production down by 0.8% in euro areaIndustrial production down by 0.8% in euro area
Industrial production down by 0.8% in euro areaGiuseppe Fumagalli
 
FoodDrinkEurope: Data & Trends 2012
FoodDrinkEurope: Data & Trends 2012FoodDrinkEurope: Data & Trends 2012
FoodDrinkEurope: Data & Trends 2012FIAB
 
Overview of the Food and Processing Sector in South East Europe
Overview of the Food and Processing Sector in South East EuropeOverview of the Food and Processing Sector in South East Europe
Overview of the Food and Processing Sector in South East EuropeOECDglobal
 
FoodDrinkEurope: Economic Bulletin Q4 2012
FoodDrinkEurope: Economic Bulletin Q4 2012FoodDrinkEurope: Economic Bulletin Q4 2012
FoodDrinkEurope: Economic Bulletin Q4 2012FIAB
 
Monthly Newsletter 7/2013
Monthly Newsletter 7/2013Monthly Newsletter 7/2013
Monthly Newsletter 7/2013Latvijas Banka
 
EMEA Economic Insight October 2010
EMEA Economic Insight October 2010EMEA Economic Insight October 2010
EMEA Economic Insight October 2010Manpower EMEA
 
Eurostatinflation2 17042019-ap-en
Eurostatinflation2 17042019-ap-enEurostatinflation2 17042019-ap-en
Eurostatinflation2 17042019-ap-enPaperjam_redaction
 
Показники інфляції в Євросоюзі та зоні євро в січні 2017 року
Показники інфляції в Євросоюзі та зоні євро в січні 2017 рокуПоказники інфляції в Євросоюзі та зоні євро в січні 2017 року
Показники інфляції в Євросоюзі та зоні євро в січні 2017 рокуtsnua
 
Monthly Newsletter 9/2015
Monthly Newsletter 9/2015Monthly Newsletter 9/2015
Monthly Newsletter 9/2015Latvijas Banka
 
Eurostat 2q 2013
Eurostat 2q 2013Eurostat 2q 2013
Eurostat 2q 2013idealistait
 
Monthly Newsletter 1/2014
Monthly Newsletter 1/2014Monthly Newsletter 1/2014
Monthly Newsletter 1/2014Latvijas Banka
 
Monthly Newsletter 4/2015
Monthly Newsletter 4/2015Monthly Newsletter 4/2015
Monthly Newsletter 4/2015Latvijas Banka
 
EMEA Economic Insight November 2010
EMEA Economic Insight November 2010EMEA Economic Insight November 2010
EMEA Economic Insight November 2010Manpower EMEA
 
Monthly Newsletter 11/2013
Monthly Newsletter 11/2013Monthly Newsletter 11/2013
Monthly Newsletter 11/2013Latvijas Banka
 
Financial Markets Review (July 2014)
Financial Markets Review (July 2014)Financial Markets Review (July 2014)
Financial Markets Review (July 2014)Snam
 

Similar to FoodDrinkEurope _ Boletín económico 1Q 2013 (20)

Pressreleasecpi sint maarten_201306
Pressreleasecpi sint maarten_201306Pressreleasecpi sint maarten_201306
Pressreleasecpi sint maarten_201306
 
Así está the economy november 2015 Circulo de Empresarios
Así está the economy november 2015 Circulo de EmpresariosAsí está the economy november 2015 Circulo de Empresarios
Así está the economy november 2015 Circulo de Empresarios
 
Volume of retail trade down by 0.2% in both euro area and EU28
Volume of retail trade down by 0.2% in both euro area and EU28Volume of retail trade down by 0.2% in both euro area and EU28
Volume of retail trade down by 0.2% in both euro area and EU28
 
UK Consumer Price Inflation
UK Consumer Price InflationUK Consumer Price Inflation
UK Consumer Price Inflation
 
Industrial production down by 0.8% in euro area
Industrial production down by 0.8% in euro areaIndustrial production down by 0.8% in euro area
Industrial production down by 0.8% in euro area
 
FoodDrinkEurope: Data & Trends 2012
FoodDrinkEurope: Data & Trends 2012FoodDrinkEurope: Data & Trends 2012
FoodDrinkEurope: Data & Trends 2012
 
Overview of the Food and Processing Sector in South East Europe
Overview of the Food and Processing Sector in South East EuropeOverview of the Food and Processing Sector in South East Europe
Overview of the Food and Processing Sector in South East Europe
 
FoodDrinkEurope: Economic Bulletin Q4 2012
FoodDrinkEurope: Economic Bulletin Q4 2012FoodDrinkEurope: Economic Bulletin Q4 2012
FoodDrinkEurope: Economic Bulletin Q4 2012
 
Monthly Newsletter 7/2013
Monthly Newsletter 7/2013Monthly Newsletter 7/2013
Monthly Newsletter 7/2013
 
EMEA Economic Insight October 2010
EMEA Economic Insight October 2010EMEA Economic Insight October 2010
EMEA Economic Insight October 2010
 
Eurostatinflation2 17042019-ap-en
Eurostatinflation2 17042019-ap-enEurostatinflation2 17042019-ap-en
Eurostatinflation2 17042019-ap-en
 
Показники інфляції в Євросоюзі та зоні євро в січні 2017 року
Показники інфляції в Євросоюзі та зоні євро в січні 2017 рокуПоказники інфляції в Євросоюзі та зоні євро в січні 2017 року
Показники інфляції в Євросоюзі та зоні євро в січні 2017 року
 
Monthly Newsletter 9/2015
Monthly Newsletter 9/2015Monthly Newsletter 9/2015
Monthly Newsletter 9/2015
 
Eurostat 2q 2013
Eurostat 2q 2013Eurostat 2q 2013
Eurostat 2q 2013
 
Monthly Newsletter 1/2014
Monthly Newsletter 1/2014Monthly Newsletter 1/2014
Monthly Newsletter 1/2014
 
Monthly Newsletter 4/2015
Monthly Newsletter 4/2015Monthly Newsletter 4/2015
Monthly Newsletter 4/2015
 
EMEA Economic Insight November 2010
EMEA Economic Insight November 2010EMEA Economic Insight November 2010
EMEA Economic Insight November 2010
 
Eurostat Estimate of Q1 GDP for Eurozone
Eurostat Estimate of Q1 GDP for EurozoneEurostat Estimate of Q1 GDP for Eurozone
Eurostat Estimate of Q1 GDP for Eurozone
 
Monthly Newsletter 11/2013
Monthly Newsletter 11/2013Monthly Newsletter 11/2013
Monthly Newsletter 11/2013
 
Financial Markets Review (July 2014)
Financial Markets Review (July 2014)Financial Markets Review (July 2014)
Financial Markets Review (July 2014)
 

More from FIAB

Ecotrophelia España 2018
Ecotrophelia España 2018Ecotrophelia España 2018
Ecotrophelia España 2018FIAB
 
Programa Seminario regulación y autorregulación FIAB-AUTOCONTROL
Programa Seminario regulación y autorregulación FIAB-AUTOCONTROLPrograma Seminario regulación y autorregulación FIAB-AUTOCONTROL
Programa Seminario regulación y autorregulación FIAB-AUTOCONTROLFIAB
 
Eficiencia energética para las pymes agroalimentarias - Sevilla
Eficiencia energética para las pymes agroalimentarias - SevillaEficiencia energética para las pymes agroalimentarias - Sevilla
Eficiencia energética para las pymes agroalimentarias - SevillaFIAB
 
EU-Merci - Cuestionario Asociaciones
EU-Merci - Cuestionario AsociacionesEU-Merci - Cuestionario Asociaciones
EU-Merci - Cuestionario AsociacionesFIAB
 
EU-MERCI - Cuestionario Empresas
EU-MERCI - Cuestionario EmpresasEU-MERCI - Cuestionario Empresas
EU-MERCI - Cuestionario EmpresasFIAB
 
EU-MERCI Cuestionario ESCOS
EU-MERCI Cuestionario ESCOSEU-MERCI Cuestionario ESCOS
EU-MERCI Cuestionario ESCOSFIAB
 
IV Madrid Food&Drink Summit 2016
IV Madrid Food&Drink Summit 2016IV Madrid Food&Drink Summit 2016
IV Madrid Food&Drink Summit 2016FIAB
 
Jornada EPA - Mª Isabel Prieto
Jornada EPA - Mª Isabel PrietoJornada EPA - Mª Isabel Prieto
Jornada EPA - Mª Isabel PrietoFIAB
 
Jornada EPA - Virginia Navarro
Jornada EPA - Virginia NavarroJornada EPA - Virginia Navarro
Jornada EPA - Virginia NavarroFIAB
 
Jornada EPA - Maria Dolores Vázquez
Jornada EPA - Maria Dolores VázquezJornada EPA - Maria Dolores Vázquez
Jornada EPA - Maria Dolores VázquezFIAB
 
Jornada EPA - Miquel Bonet
Jornada EPA - Miquel BonetJornada EPA - Miquel Bonet
Jornada EPA - Miquel BonetFIAB
 
Curso Eficiencia Energética en Sistemas de Vapor Industriales
Curso Eficiencia Energética en Sistemas de Vapor IndustrialesCurso Eficiencia Energética en Sistemas de Vapor Industriales
Curso Eficiencia Energética en Sistemas de Vapor IndustrialesFIAB
 
Curso Eficiencia Energética en Sistemas de Vapor Industriales
Curso Eficiencia Energética en Sistemas de Vapor IndustrialesCurso Eficiencia Energética en Sistemas de Vapor Industriales
Curso Eficiencia Energética en Sistemas de Vapor IndustrialesFIAB
 
II ALIBETOPIAS 2016
II ALIBETOPIAS 2016II ALIBETOPIAS 2016
II ALIBETOPIAS 2016FIAB
 
Eficiencia en la gestión de recursos
Eficiencia en la gestión de recursos Eficiencia en la gestión de recursos
Eficiencia en la gestión de recursos FIAB
 
¿Ser o parecer? Camino hacia empresas sostenibles en el sector de la alimenta...
¿Ser o parecer? Camino hacia empresas sostenibles en el sector de la alimenta...¿Ser o parecer? Camino hacia empresas sostenibles en el sector de la alimenta...
¿Ser o parecer? Camino hacia empresas sostenibles en el sector de la alimenta...FIAB
 
El clima del futuro. Escenarios y adaptación
El clima del futuro. Escenarios y adaptaciónEl clima del futuro. Escenarios y adaptación
El clima del futuro. Escenarios y adaptaciónFIAB
 
Agenda internacional en cambio climático e implicaciones para el sector
Agenda internacional en cambio climático e implicaciones para el sector Agenda internacional en cambio climático e implicaciones para el sector
Agenda internacional en cambio climático e implicaciones para el sector FIAB
 
Inscripción Envifood 2016
Inscripción Envifood 2016Inscripción Envifood 2016
Inscripción Envifood 2016FIAB
 
Envifood Meeting Point 2016
Envifood Meeting Point 2016Envifood Meeting Point 2016
Envifood Meeting Point 2016FIAB
 

More from FIAB (20)

Ecotrophelia España 2018
Ecotrophelia España 2018Ecotrophelia España 2018
Ecotrophelia España 2018
 
Programa Seminario regulación y autorregulación FIAB-AUTOCONTROL
Programa Seminario regulación y autorregulación FIAB-AUTOCONTROLPrograma Seminario regulación y autorregulación FIAB-AUTOCONTROL
Programa Seminario regulación y autorregulación FIAB-AUTOCONTROL
 
Eficiencia energética para las pymes agroalimentarias - Sevilla
Eficiencia energética para las pymes agroalimentarias - SevillaEficiencia energética para las pymes agroalimentarias - Sevilla
Eficiencia energética para las pymes agroalimentarias - Sevilla
 
EU-Merci - Cuestionario Asociaciones
EU-Merci - Cuestionario AsociacionesEU-Merci - Cuestionario Asociaciones
EU-Merci - Cuestionario Asociaciones
 
EU-MERCI - Cuestionario Empresas
EU-MERCI - Cuestionario EmpresasEU-MERCI - Cuestionario Empresas
EU-MERCI - Cuestionario Empresas
 
EU-MERCI Cuestionario ESCOS
EU-MERCI Cuestionario ESCOSEU-MERCI Cuestionario ESCOS
EU-MERCI Cuestionario ESCOS
 
IV Madrid Food&Drink Summit 2016
IV Madrid Food&Drink Summit 2016IV Madrid Food&Drink Summit 2016
IV Madrid Food&Drink Summit 2016
 
Jornada EPA - Mª Isabel Prieto
Jornada EPA - Mª Isabel PrietoJornada EPA - Mª Isabel Prieto
Jornada EPA - Mª Isabel Prieto
 
Jornada EPA - Virginia Navarro
Jornada EPA - Virginia NavarroJornada EPA - Virginia Navarro
Jornada EPA - Virginia Navarro
 
Jornada EPA - Maria Dolores Vázquez
Jornada EPA - Maria Dolores VázquezJornada EPA - Maria Dolores Vázquez
Jornada EPA - Maria Dolores Vázquez
 
Jornada EPA - Miquel Bonet
Jornada EPA - Miquel BonetJornada EPA - Miquel Bonet
Jornada EPA - Miquel Bonet
 
Curso Eficiencia Energética en Sistemas de Vapor Industriales
Curso Eficiencia Energética en Sistemas de Vapor IndustrialesCurso Eficiencia Energética en Sistemas de Vapor Industriales
Curso Eficiencia Energética en Sistemas de Vapor Industriales
 
Curso Eficiencia Energética en Sistemas de Vapor Industriales
Curso Eficiencia Energética en Sistemas de Vapor IndustrialesCurso Eficiencia Energética en Sistemas de Vapor Industriales
Curso Eficiencia Energética en Sistemas de Vapor Industriales
 
II ALIBETOPIAS 2016
II ALIBETOPIAS 2016II ALIBETOPIAS 2016
II ALIBETOPIAS 2016
 
Eficiencia en la gestión de recursos
Eficiencia en la gestión de recursos Eficiencia en la gestión de recursos
Eficiencia en la gestión de recursos
 
¿Ser o parecer? Camino hacia empresas sostenibles en el sector de la alimenta...
¿Ser o parecer? Camino hacia empresas sostenibles en el sector de la alimenta...¿Ser o parecer? Camino hacia empresas sostenibles en el sector de la alimenta...
¿Ser o parecer? Camino hacia empresas sostenibles en el sector de la alimenta...
 
El clima del futuro. Escenarios y adaptación
El clima del futuro. Escenarios y adaptaciónEl clima del futuro. Escenarios y adaptación
El clima del futuro. Escenarios y adaptación
 
Agenda internacional en cambio climático e implicaciones para el sector
Agenda internacional en cambio climático e implicaciones para el sector Agenda internacional en cambio climático e implicaciones para el sector
Agenda internacional en cambio climático e implicaciones para el sector
 
Inscripción Envifood 2016
Inscripción Envifood 2016Inscripción Envifood 2016
Inscripción Envifood 2016
 
Envifood Meeting Point 2016
Envifood Meeting Point 2016Envifood Meeting Point 2016
Envifood Meeting Point 2016
 

Recently uploaded

Fordham -How effective decision-making is within the IT department - Analysis...
Fordham -How effective decision-making is within the IT department - Analysis...Fordham -How effective decision-making is within the IT department - Analysis...
Fordham -How effective decision-making is within the IT department - Analysis...Peter Ward
 
TriStar Gold Corporate Presentation - April 2024
TriStar Gold Corporate Presentation - April 2024TriStar Gold Corporate Presentation - April 2024
TriStar Gold Corporate Presentation - April 2024Adnet Communications
 
International Business Environments and Operations 16th Global Edition test b...
International Business Environments and Operations 16th Global Edition test b...International Business Environments and Operations 16th Global Edition test b...
International Business Environments and Operations 16th Global Edition test b...ssuserf63bd7
 
Buy gmail accounts.pdf Buy Old Gmail Accounts
Buy gmail accounts.pdf Buy Old Gmail AccountsBuy gmail accounts.pdf Buy Old Gmail Accounts
Buy gmail accounts.pdf Buy Old Gmail AccountsBuy Verified Accounts
 
MAHA Global and IPR: Do Actions Speak Louder Than Words?
MAHA Global and IPR: Do Actions Speak Louder Than Words?MAHA Global and IPR: Do Actions Speak Louder Than Words?
MAHA Global and IPR: Do Actions Speak Louder Than Words?Olivia Kresic
 
Unlocking the Future: Explore Web 3.0 Workshop to Start Earning Today!
Unlocking the Future: Explore Web 3.0 Workshop to Start Earning Today!Unlocking the Future: Explore Web 3.0 Workshop to Start Earning Today!
Unlocking the Future: Explore Web 3.0 Workshop to Start Earning Today!Doge Mining Website
 
Entrepreneurship lessons in Philippines
Entrepreneurship lessons in  PhilippinesEntrepreneurship lessons in  Philippines
Entrepreneurship lessons in PhilippinesDavidSamuel525586
 
Church Building Grants To Assist With New Construction, Additions, And Restor...
Church Building Grants To Assist With New Construction, Additions, And Restor...Church Building Grants To Assist With New Construction, Additions, And Restor...
Church Building Grants To Assist With New Construction, Additions, And Restor...Americas Got Grants
 
1911 Gold Corporate Presentation Apr 2024.pdf
1911 Gold Corporate Presentation Apr 2024.pdf1911 Gold Corporate Presentation Apr 2024.pdf
1911 Gold Corporate Presentation Apr 2024.pdfShaun Heinrichs
 
Call Girls Contact Number Andheri 9920874524
Call Girls Contact Number Andheri 9920874524Call Girls Contact Number Andheri 9920874524
Call Girls Contact Number Andheri 9920874524najka9823
 
The-Ethical-issues-ghhhhhhhhjof-Byjus.pptx
The-Ethical-issues-ghhhhhhhhjof-Byjus.pptxThe-Ethical-issues-ghhhhhhhhjof-Byjus.pptx
The-Ethical-issues-ghhhhhhhhjof-Byjus.pptxmbikashkanyari
 
Ten Organizational Design Models to align structure and operations to busines...
Ten Organizational Design Models to align structure and operations to busines...Ten Organizational Design Models to align structure and operations to busines...
Ten Organizational Design Models to align structure and operations to busines...Seta Wicaksana
 
PB Project 1: Exploring Your Personal Brand
PB Project 1: Exploring Your Personal BrandPB Project 1: Exploring Your Personal Brand
PB Project 1: Exploring Your Personal BrandSharisaBethune
 
Appkodes Tinder Clone Script with Customisable Solutions.pptx
Appkodes Tinder Clone Script with Customisable Solutions.pptxAppkodes Tinder Clone Script with Customisable Solutions.pptx
Appkodes Tinder Clone Script with Customisable Solutions.pptxappkodes
 
8447779800, Low rate Call girls in Shivaji Enclave Delhi NCR
8447779800, Low rate Call girls in Shivaji Enclave Delhi NCR8447779800, Low rate Call girls in Shivaji Enclave Delhi NCR
8447779800, Low rate Call girls in Shivaji Enclave Delhi NCRashishs7044
 
8447779800, Low rate Call girls in Dwarka mor Delhi NCR
8447779800, Low rate Call girls in Dwarka mor Delhi NCR8447779800, Low rate Call girls in Dwarka mor Delhi NCR
8447779800, Low rate Call girls in Dwarka mor Delhi NCRashishs7044
 
Flow Your Strategy at Flight Levels Day 2024
Flow Your Strategy at Flight Levels Day 2024Flow Your Strategy at Flight Levels Day 2024
Flow Your Strategy at Flight Levels Day 2024Kirill Klimov
 

Recently uploaded (20)

Fordham -How effective decision-making is within the IT department - Analysis...
Fordham -How effective decision-making is within the IT department - Analysis...Fordham -How effective decision-making is within the IT department - Analysis...
Fordham -How effective decision-making is within the IT department - Analysis...
 
TriStar Gold Corporate Presentation - April 2024
TriStar Gold Corporate Presentation - April 2024TriStar Gold Corporate Presentation - April 2024
TriStar Gold Corporate Presentation - April 2024
 
International Business Environments and Operations 16th Global Edition test b...
International Business Environments and Operations 16th Global Edition test b...International Business Environments and Operations 16th Global Edition test b...
International Business Environments and Operations 16th Global Edition test b...
 
Buy gmail accounts.pdf Buy Old Gmail Accounts
Buy gmail accounts.pdf Buy Old Gmail AccountsBuy gmail accounts.pdf Buy Old Gmail Accounts
Buy gmail accounts.pdf Buy Old Gmail Accounts
 
MAHA Global and IPR: Do Actions Speak Louder Than Words?
MAHA Global and IPR: Do Actions Speak Louder Than Words?MAHA Global and IPR: Do Actions Speak Louder Than Words?
MAHA Global and IPR: Do Actions Speak Louder Than Words?
 
Unlocking the Future: Explore Web 3.0 Workshop to Start Earning Today!
Unlocking the Future: Explore Web 3.0 Workshop to Start Earning Today!Unlocking the Future: Explore Web 3.0 Workshop to Start Earning Today!
Unlocking the Future: Explore Web 3.0 Workshop to Start Earning Today!
 
Entrepreneurship lessons in Philippines
Entrepreneurship lessons in  PhilippinesEntrepreneurship lessons in  Philippines
Entrepreneurship lessons in Philippines
 
Church Building Grants To Assist With New Construction, Additions, And Restor...
Church Building Grants To Assist With New Construction, Additions, And Restor...Church Building Grants To Assist With New Construction, Additions, And Restor...
Church Building Grants To Assist With New Construction, Additions, And Restor...
 
Corporate Profile 47Billion Information Technology
Corporate Profile 47Billion Information TechnologyCorporate Profile 47Billion Information Technology
Corporate Profile 47Billion Information Technology
 
1911 Gold Corporate Presentation Apr 2024.pdf
1911 Gold Corporate Presentation Apr 2024.pdf1911 Gold Corporate Presentation Apr 2024.pdf
1911 Gold Corporate Presentation Apr 2024.pdf
 
Japan IT Week 2024 Brochure by 47Billion (English)
Japan IT Week 2024 Brochure by 47Billion (English)Japan IT Week 2024 Brochure by 47Billion (English)
Japan IT Week 2024 Brochure by 47Billion (English)
 
Call Girls Contact Number Andheri 9920874524
Call Girls Contact Number Andheri 9920874524Call Girls Contact Number Andheri 9920874524
Call Girls Contact Number Andheri 9920874524
 
The-Ethical-issues-ghhhhhhhhjof-Byjus.pptx
The-Ethical-issues-ghhhhhhhhjof-Byjus.pptxThe-Ethical-issues-ghhhhhhhhjof-Byjus.pptx
The-Ethical-issues-ghhhhhhhhjof-Byjus.pptx
 
Ten Organizational Design Models to align structure and operations to busines...
Ten Organizational Design Models to align structure and operations to busines...Ten Organizational Design Models to align structure and operations to busines...
Ten Organizational Design Models to align structure and operations to busines...
 
PB Project 1: Exploring Your Personal Brand
PB Project 1: Exploring Your Personal BrandPB Project 1: Exploring Your Personal Brand
PB Project 1: Exploring Your Personal Brand
 
Appkodes Tinder Clone Script with Customisable Solutions.pptx
Appkodes Tinder Clone Script with Customisable Solutions.pptxAppkodes Tinder Clone Script with Customisable Solutions.pptx
Appkodes Tinder Clone Script with Customisable Solutions.pptx
 
No-1 Call Girls In Goa 93193 VIP 73153 Escort service In North Goa Panaji, Ca...
No-1 Call Girls In Goa 93193 VIP 73153 Escort service In North Goa Panaji, Ca...No-1 Call Girls In Goa 93193 VIP 73153 Escort service In North Goa Panaji, Ca...
No-1 Call Girls In Goa 93193 VIP 73153 Escort service In North Goa Panaji, Ca...
 
8447779800, Low rate Call girls in Shivaji Enclave Delhi NCR
8447779800, Low rate Call girls in Shivaji Enclave Delhi NCR8447779800, Low rate Call girls in Shivaji Enclave Delhi NCR
8447779800, Low rate Call girls in Shivaji Enclave Delhi NCR
 
8447779800, Low rate Call girls in Dwarka mor Delhi NCR
8447779800, Low rate Call girls in Dwarka mor Delhi NCR8447779800, Low rate Call girls in Dwarka mor Delhi NCR
8447779800, Low rate Call girls in Dwarka mor Delhi NCR
 
Flow Your Strategy at Flight Levels Day 2024
Flow Your Strategy at Flight Levels Day 2024Flow Your Strategy at Flight Levels Day 2024
Flow Your Strategy at Flight Levels Day 2024
 

FoodDrinkEurope _ Boletín económico 1Q 2013

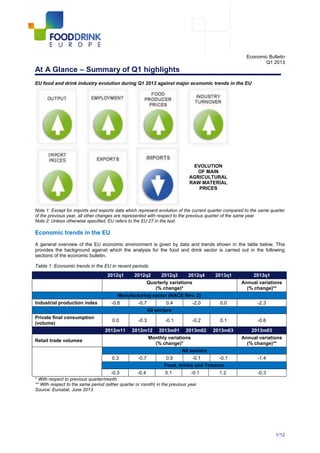
  • 1. 1/12 Economic Bulletin Q1 2013 At A Glance – Summary of Q1 highlights EU food and drink industry evolution during Q1 2013 against major economic trends in the EU EVOLUTION OF MAIN AGRICULTURAL RAW MATERIAL PRICES Note 1: Except for imports and exports data which represent evolution of the current quarter compared to the same quarter of the previous year, all other changes are represented with respect to the previous quarter of the same year. Note 2: Unless otherwise specified, EU refers to the EU 27 in the text. Economic trends in the EU A general overview of the EU economic environment is given by data and trends shown in the table below. This provides the background against which the analysis for the food and drink sector is carried out in the following sections of the economic bulletin. Table 1: Economic trends in the EU in recent periods * With respect to previous quarter/month ** With respect to the same period (either quarter or month) in the previous year Source: Eurostat, June 2013 2012q1 2012q2 2012q3 2012q4 2013q1 2013q1 Quarterly variations (% change)* Annual variations (% change)** Manufacturing sector (NACE Rev. 2) Industrial production index -0.8 -0.7 0.4 -2.0 0.0 -2.3 All sectors Private final consumption (volume) 0.0 -0.3 -0.1 -0.2 0.1 -0.6 2012m11 2012m12 2013m01 2013m02 2013m03 2013m03 Retail trade volumes Monthly variations (% change)* Annual variations (% change)** All sectors 0.3 -0.7 0.9 -0.1 -0.1 -1.4 Food, drinks and Tobacco -0.3 -0.4 0.1 -0.1 1.2 -0.3
  • 2. 2/12 The EU manufacturing industrial production index remained unchanged in Q1 of 2013. In the same period, private consumption (volumes) registered a slight increase compared to the previous quarter, i.e. 0.1%. The yearly comparison shows that the industrial production index decreased in Q1 of 2013 compared to the same quarter of the previous year, i.e. by -2.3%. Private consumption also decreased compared to the change registered in the same quarter of 2012, but to a far lesser extent, i.e. -0.6%. The volume of retail trade (all sectors) decreased by 0.1% in March 2013 (compared to February 2013), while retail trade in food, drinks and tobacco increased by 1.2%. Among the Member States for which data are available, total retail trade fell in nine, rose in eleven and remained stable in Austria. The largest decreases were registered in Portugal (-3.0%), Slovenia (-2.6%) and Ireland (-1.9%), and the highest increases in Estonia (+2.7%), Latvia (+2.1%) and Finland (+1.3%). 1 FOOD AND DRINK INDUSTRY INDICATORS IN Q1 OF 2013 1. Food and drink industry output index increased After experiencing a decrease in the past quarter, Food and drink industry output (production) in the EU started to increase again in Q1 of 2013 compared to the previous quarter, i.e. by 0.32%. This is a better performance than that of the manufacturing production index, which remained unchanged in the same period (see the above section: Economic trends in the EU). A large number of the countries that had experienced negative growth in the food and drink industry output in Q4 of 2012 registered positive growth in Q1 of 2013 (i.e. Bulgaria, Czech Republic, Denmark, Hungary, Italy, Latvia, Romania, Spain, the UK). At the same time, some countries experienced the opposite, i.e. moved from a positive to a negative output growth path, namely Austria (-5.42%), Belgium (-0.71%), Estonia (-0.36%), France (-2.31%), significantly Ireland (from +7.98% to -6.06%). Other countries maintained their negative trend also in Q1 of 2013 (i.e. Finland, Greece). Table 2: Industry production index, quarterly growth Member State 2012 Q4/2012 Q3 (% change) 2013 Q1/2012 Q4 (% change) EU27 -0,58 0,32 Austria 3.19 -5.42 Belgium 0,34 -0,71 Bulgaria -3,01 0,10 Czech Republic -1,46 4,09 Denmark -0,53 1,66 Estonia 1,26 -0,36 Finland -0,89 -0,21 France 0,66 -2,31 Germany 1,36 1,24 Greece -4,02 -0,11 Hungary -3,22 1,54 Ireland 7,98 -6,06 Italy -4,49 2,12 Latvia -1,74 3,55 Lithuania 0,10 1,83 Netherlands 0,11 1,72 Poland 0,82 0,80 Portugal 0,23 1,58 Romania -2,04 2,37 Spain -0,96 0,99 Sweden 0,66 0,99 United Kingdom -2,98 0,54 Source: Eurostat, Short-Term Business Statistics, NACE Rev. 2, June 2013 1 Eurostat news release, Euro indicators, STAT/13/72.
  • 3. 3/12 2. Evolution of main agricultural raw material prices The following shows a mixed picture for raw material prices: Oils and oil crops Grains Dairy Soybean Rape Cocoa Coffee Sugar Corn/ Maize Soft wheat WMP SMP Oil Bean Meal Seed Oil Palm oil Source: FoodDrinkEurope compilation Cocoa and coffee Quarterly developments: Continuing the fall in prices in Q4 of 2012, the average price of cocoa fell by 9.9% in Q1 of 2013. Coffee composite prices also experienced a negative trend and were 4% lower in Q1 of 2013 than Q4 of 2012. Year-on-year developments: The year-on-year comparison shows that, the New York cocoa market recorded a 5.6% decrease with respect to Q1 of 2012. However, coffee composite prices were significantly lower than their level in the same quarter of 2012, i.e. by 26.1%. Source: International Cocoa Organisation (ICCO) and International Coffee Organisation (ICO), June 2013 Sugar Quarterly developments: EU white sugar prices slightly increased (+1.5%) in Q1 of 2013. In the same quarter, U.S. market price continued to decrease, i.e. by 17.5% compared to Q4 of 2012. Year-on-year developments: On average, EU market price for white sugar was 4.6% higher in Q1 of 2013 than the same quarter of the previous year whereas the U.S. market price was 44.2% lower than the average in Q1 of 2012. In comparison, the world sugar price was 20.8% lower than the average of the same quarter of 2012. 0 1000 2000 3000 4000 5000 6000 Jan-07 Apr-07 Jul-07 Oct-07 Jan-08 Apr-08 Jul-08 Oct-08 Jan-09 Apr-09 Jul-09 Oct-09 Jan-10 Apr-10 Jul-10 Oct-10 Jan-11 Apr-11 Jul-11 Oct-11 Jan-12 Apr-12 Jul-12 Oct-12 Jan-13 Apr-13 Cocoa NY market price and coffee world price (monthly averages, current price, $/t) Cocoa price in $/t Coffee composite price in $/t
  • 4. 4/12 Source: European Commission – Circa (Regulations (EC) No 562/2005 Article 6(1) and 479/2010 Article 2), United States Department of Agriculture, June 2013 Grains Corn maize prices Quarterly developments: Following the trend of the previous quarter, EU maize prices slightly decreased in Q1 of 2013 (compared to Q4 of 2012), i.e. by 3.2%. U.S. maize prices also decreased in the same period, i.e. by 6.5%, thus continuing the negative growth trend of the previous quarter. Year-on-year developments: On average, EU maize prices were 18% higher in Q1 of 2013 than the same quarter of the previous year. Similarly but to a lesser extent, U.S. maize prices were 8.8% higher in Q1 of 2013 than in the same quarter of the previous year. Source: FAO and European Commission (DG Agri), June 2013 0 200 400 600 800 1000 1200 Jan'07 Mar May Jul Sep Nov Jan'08 Mar May Jul Sep Nov Jan'09 Mar May Jul Sep Nov Jan'10 Mar May Jul Sep Nov Jan'11 Mar May July Sep Nov Jan'12 Mar May Jul Sep Nov Jan'13 Mar White Sugar prices (monthly averages, current prices, €/t) World price US market price EU reference price EU average price 0 50 100 150 200 250 300 Jan-07 May-07 Sep-07 Jan-08 May-08 Sep-08 Jan-09 May-09 Sep-09 Jan-10 May-10 Sep-10 Jan-11 May-11 Sep-11 Jan-12 May-12 Sep-12 Jan-13 Corn/maize market prices (monthly averages, current prices, €/t DG Agri EU market price €/t FAO US market price €/t
  • 5. 5/12 Soft wheat prices Quarterly developments: Contrary to the previous quarter, EU soft wheat prices slightly decreased in Q1 of 2013 (compared to Q4 of 2012) i.e. by 1.2%. U.S. soft wheat prices decreased during the same period i.e. by 13%. Year-on-year developments: On average, EU soft wheat prices were 24.5% higher in Q1 of 2013 than the same quarter of the previous year. Similarly, but to a lesser extent, U.S. soft wheat prices were 15.5% higher in Q1 of 2013 than in the same quarter of the previous year. Source: FAO and European Commission (DG Agri), June 2013 Dairy Skimmed Milk Powder (SMP) Quarterly developments: EU SMP prices registered a slight decrease in Q1 of 2013 (compared to Q4 of 2012) i.e. by 0.64%. While in Q4 of 2012 average EU prices had exceeded world market prices for the first time since Q3 of 2009, this trend was reversed in Q1 of 2013. Year-on-year developments: The yearly comparison shows that, on average, EU SMP prices were 16.7% higher in Q1 of 2013 than the same period in 2013. 0 50 100 150 200 250 300 Jan-07 May-07 Sep-07 Jan-08 May-08 Sep-08 Jan-09 May-09 Sep-09 Jan-10 May-10 Sep-10 Jan-11 May-11 Sep-11 Jan-12 May-12 Sep-12 Jan-13 Soft wheat market prices (monthly averages, current prices, €/t) DG Agri EU market price €/t FAO US market price €/t
  • 6. 6/12 Source: FAO, CLAL consultancy (discontinued after January 2011 to the benefit of the European Commission source), European Commission – Circa (Regulations (EC) No 562/2005 Article 6(1) and 479/2010 Article 2), June 2013 Whole Milk Powder (WMP) Quarterly developments: Generally higher than world market prices since Q3 of 2010, EU WMP average prices continued to increase in Q1 of 2013, i.e. by 2.5% from the previous quarter. Year-on-year developments: The yearly comparison shows that, on average, EU WMP prices increased by 5.6% in Q1 of 2013 compared to the same quarter of 2012. Source: FAO, CLAL consultancy (discontinued after January 2011 to the benefit of the European Commission source), European Commission – Circa (Regulations (EC) No 562/2005 Article 6(1) and 479/2010 Article 2), June 2013 0 500 1000 1500 2000 2500 3000 3500 4000 4500 Jan'07 Mar May Jul Sep Nov Jan'08 Mar May Jul Sep Nov Jan'09 Mar May Jul Sep Nov Jan'10 Mar May Jul Sep Nov Jan'11 Mar May Jul Sep Nov Jan'12 Mar May Jul Sep Nov Jan'13 Mar SMP (monthly averages, current prices, €/t) FAO €/t World market price CLAL €/t EU market price CIRCA €/t EU market price R. 1234/07 €/t EU reference price 1000 1500 2000 2500 3000 3500 4000 Jan'08 Mar May Jul Sep Nov Jan'09 Mar May Jul Sep Nov Jan'10 Mar May Jul Sep Nov Jan'11 Mar May Jul Sep Nov Jan'12 Mar May Jul Sep Nov Jan'13 Mar WMP (monthly averages, current prices, €/t) World market price CLAL €/t EU market price CIRCA €/t EU market price
  • 7. 7/12 Oils and oil crops Quarterly developments: In Q1 of 2013 Soybean and Soybean meal prices declined by 6.3% and 9.5% respectively. Prices for Soybean oil (+0.2%), Palm oil (+5.3%), Rape oil (+0.2%) and Rapeseed (+1.3%) experienced a general increase. Moreover, after having significantly decreased during the previous quarter, prices of Palm oil (- 18.5%) increased most of all oils and oil crops in Q1 of 2013. Year-on-year developments: The yearly comparison shows that in Q1 of 2013 only Soybean meal, Soybean and Rapeseed prices were higher than in the same quarter of 2012: by 35.6%, 9.4% and 2.6% respectively. On the contrary Palm oil, Soybean oil and Rape oil were 23.0%, 7.4% and 6.3% lower in Q1 of 2013 than the same period of the previous year. Source: World Bank and FAO, June 2013 3. Price developments in the food supply chain Consumer prices (1.34%) and producer prices (0.44%) grew on average in Q1 of 2013, whereas inflation remained almost unchanged (-0.04%). 0 200 400 600 800 1000 1200 1400 1600 1800 Jan-07 May-07 Sep-07 Jan-08 May-08 Sep-08 Jan-09 May-09 Sep-09 Jan-10 May-10 Sep-10 Jan-11 May-11 Sep-11 Jan-12 May-12 Sep-12 Jan-13 Oils and oilcrop prices (monthly averages, current prices, $/t) Soybean oil $/t Soybeans $/t Soybean meal $/t Palm oil $/t Rape oil $/t Rapeseed $/t
  • 8. 8/12 Source: Eurostat (Food supply chain monitor), June 2013 4. Employment index of the EU food and drink industry grew for two consecutive quarters After having experienced a slight decrease in Q3 of 2012, the labour input index for the food and drink industry increased (+0.28%) in Q4 of last year and further improved (+0.02%) in Q1 of 2013. This is contrary to the performance shown by the (total) manufacturing sector whose employment index decreased for the past three quarters and by 0.30% in Q1 of 2013. When looking at the industry breakdown, the food sector employment index increased by 0.15%, whereas the beverages industry employment index decreased by 0.5% in comparison with the previous quarter. Source: Eurostat (SBS), Nace Rev. 2, seasonally adjusted data, June 2013. 95.0 100.0 105.0 110.0 115.0 120.0 125.0 130.0 135.0 140.0 145.0 2007M01 2007M04 2007M07 2007M10 2008M01 2008M04 2008M07 2008M10 2009M01 2009M04 2009M07 2009M10 2010M01 2010M04 2010M07 2010M10 2011M01 2011M04 2011M07 2011M10 2012M01 2012M04 2012M07 2012M10 2013M01 Agricultural Commodity Price Producer Price Consumer Price Overall inflation (All-items HICP) EU27: Price developments in the food supply chain (2005 = 100) 80 85 90 95 100 105 110 2010Q1 2010Q2 2010Q3 2010Q4 2011Q1 2011Q2 2011Q3 2011Q4 2012Q1 2012Q2 2012Q3 2012Q4 2013Q1 Labour input index (2010=100) : food and drink industry trends compared to total manufacturing Manufacturing Manufacture of food products Manufacture of beverages
  • 9. 9/12 5. Food and drink industry turnover continued to increase The food and drink industry’s turnover index increased by 1.38% in Q1 of 2013 compared to the previous quarter. Source: Eurostat (SBS), seasonally adjusted data, June 2013 6. Imported food prices continued to rise in Q1 of 2013 Continuing the trend which started in Q1 of 2010, imported food prices continued to increase in Q1 of 2013, up to 0.63% from the previous quarter. Source: Eurostat (SBS), June 2013 90.00 95.00 100.00 105.00 110.00 115.00 2007Q1 2007Q2 2007Q3 2007Q4 2008Q1 2008Q2 2008Q3 2008Q4 2009Q1 2009Q2 2009Q3 2009Q4 2010Q1 2010Q2 2010Q3 2010Q4 2011Q1 2011Q2 2011Q3 2011Q4 2012Q1 2012Q2 2012Q3 2012Q4 2013Q1 EU27: Turnover index (2010 = 100) Manufacture of food products and beverages 80.00 85.00 90.00 95.00 100.00 105.00 110.00 115.00 2007Q1 2007Q2 2007Q3 2007Q4 2008Q1 2008Q2 2008Q3 2008Q4 2009Q1 2009Q2 2009Q3 2009Q4 2010Q1 2010Q2 2010Q3 2010Q4 2011Q1 2011Q2 2011Q3 2011Q4 2012Q1 2012Q2 2012Q3 2012Q4 2013Q1 Euro area Food and drink import price index (2010 = 100)
  • 10. 10/12 Exchange rates In Q1 of 2013, the euro has appreciated against most major non-EU currencies in an environment of low volatility and strengthened investor sentiment towards the euro area 2 . In the past three months, the euro gained 1.84% against the US dollar, 5.41% against the pound sterling and also strongly appreciated against the Japanese Yen by 15.87%. The table below gives details for the euro appreciation against the currencies of major trading partners. Table 3: Evolution of quarterly average exchange rates 1 EUR = 2012 Q4 2013 Q1 Q1 2013/ Q4 2012 % Australian Dollar 1.25 1.27 1.84 Canadian Dollar 1.29 1.33 3.60 Brazilian Real 2.67 2.64 -1.14 Swiss Franc 1.21 1.23 1.69 Chinese Yuan Renminbi 8.10 8.22 1.45 Japanese Yen 105.12 121.80 15.87 New Zealand Dollar 1.58 1.58 0.46 United States Dollar 1.30 1.32 1.84 Pound Sterling 0.81 0.85 5.41 Source: ECB, bilateral exchange rates, June 2013 7. Trade: Exports increased in Q1 of 2013 year-on-year The EU trade balance in food and drink products continued to improve during the Q1 of 2013 compared to the same period of 2012. The export surplus amounted to nearly €5.3 billion, which marks an increase of €0.8 billion year-on- year. 2 European Central Bank, monthly bulletin, March 2013. Imports Q1 of 2013 Exports Q1 of 2013 Total food and drink imports amounted to €15.7 billion, i.e. 0.1% less compared to the previous year. However, a real reduction of imports in terms of quantity and value was observed for only a limited group of alcoholic beverages, dairy products, and fruits and vegetables. For oils and fat products, the import growth in terms of value was linked to the price factor, while the imported quantity was in fact significantly lower than a year ago. Finally, some products registered a real import reduction both in terms of volume and value, e.g. dairy (-26% in value and -23.9% in volume), fruit and vegetables (-8.6% in value and - 10.7% in volume), and less significantly, cider and malt beverages. Total food and drink exports amounted to €20.9 billion, i.e. 4.1% more compared to the same period of 2012. In fact, the total value of exports increased despite an almost unchanged total export volume (+0.1%). The year-on-year export growth registered for oils and fats, prepared animal feeds and bakery and farinaceous products was also very positive (+23.1%, 15.3%, 10.3% respectively) and matched with a similar trend in terms of exported quantities. Finally, grain mill and starch products, and wines contributed also to the growth in export value, despite witnessing a double- digit volume reduction. A single-digit volume reduction was registered for other food products.
  • 11. 11/12 Trade balance in € million Q1 2012 2013 Total of Food and Drink 4,424 5,251 Meat products 1,043 1,017 Fish and sea food products -2,910 -2,782 Processed fruit and vegetables -739 -504 Oils and fats -2,862 -2,639 Dairy products 2,031 2,074 Grain mill and starch products 325 301 Bakery & farinaceous products 618 681 Other food products 1,926 1,937 Prepared animal feed 477 529 Drinks 4,434 4,636 Trade partner profile – United States of America (USA) Launch of the Transatlantic Trade and Investment Partnership (TTIP) with the US At the G8 Summit on 17 June 2013, US President Barack Obama, President of the European Commission José Manuel Barroso, President of the European Council Herman Van Rompuy and UK Prime Minister David Cameron officially launched negotiations for TTIP. Beforehand, EU Member States agreed on the negotiating guidelines by consensus and hence decided to give the European Commission 'the green light' to start negotiations with the United States. The first round of negotiations is set to start on 8 July in Washington. The initiative of a transatlantic agreement is based on the recommendations of the EU-US High Level Working Group on Jobs and Growth that steered the deliberations on the future EU-US relations since late 2011. According to an independent study by the Centre for Economic Policy Research, London, an ambitious and comprehensive trans- Atlantic trade and investment partnership could bring the EU economic gains of €119 billion a year once the agreement is fully implemented. This would translate on average to an extra €545 in disposable income each year for a family of four in the EU. 3 EU-US food and drink trade The US represents the first export destination for European food and drink products (followed by Russia, Switzerland, Japan, China). It is also the third most important source of food imports for the EU, after Brazil and Argentina. European exports to the US amounted to nearly €13.6 billion in 2012, equivalent to 5% of the EU overall exports to the US, while imports were close to €4.4 billion. The EU contributes 22% to US food and drink imports, which gives it the leading position, before Canada (18%), Mexico (10%) and China (7%). 4 Exports from the EU to the US Imports from the US to the EU Rank US ranks 1 st among EU food and drink export destinations US ranks 3 rd among EU food and drink suppliers Value €13.6 billion €4.4 billion Share of non-annex 1 products 44% 22% Source: Eurostat COMEXT, own calculations The trade balance is largely positive for the EU as regards processed food products. The EU exports more than three times as much as it imports from the US. The EU positive trade balance also increased by 34% over the last decade, which is in line with export growth over the same period. 3 European Commission MEMO, Brussels, 18 June 2013 - The EU's free trade agreements – where are we? http://trade.ec.europa.eu/doclib/docs/2012/november/tradoc_150129.pdf 4 UN COMTRADE, 2012 data
  • 12. 12/12 Evolution of EU exports and imports from the US, 2002 – 2012, in € million Source: Eurostat COMEXT The following charts present the respective weight of different categories of food and drink in the total value of EU- US food and drink trade. EU food and drink exports to the US are dominated by beverages (57%) – mainly spirits, wine, beer, and soft drinks – followed by dairy, oils and chocolate. The two biggest categories of products imported from the US were beverages, fish products followed by animal feed and food preparations. Exports from the EU Imports to the EU Source: Eurostat COMEXT FoodDrinkEurope - represents the European food and drink industry - the leading industrial sector and major EU employer and exporter. FoodDrinkEurope’s role is to represent the food and drink industry’s interests, at the level of both European and international institutions. FoodDrinkEurope’s membership consists of 24 national federations and 3 observers, 25 European sector associations and 18 major food and drink companies. For further information, please contact: Lisa McCooey, Communications Director / Deputy Director General. Tel: + 32 2 508 10 24 - l.mccooey@fooddrinkeurope.eu 0 2 4 6 8 10 12 14 16 2002 2003 2004 2005 2006 2007 2008 2009 2010 2011 2012 Exports Imports 57% 5% 5% 3% 3% 3% 2% 22% beverages dairy oils chocolate coffee pastries or biscuits food preparations other 31% 16% 13%9% 5% 4% 4% 18% beverages fish products animal feed/petfoods food preparations processed f&v oils meat products other