SlideShare a Scribd company logo
1 of 9
Download to read offline
PROCEEDINGS of the Fifth International Driving Symposium on Human Factors in Driver Assessment, Training and Vehicle Design


           VALIDITY OF AN ON-ROAD DRIVER PERFORMANCE ASSESSMENT
                  WITHIN AN INITIAL DRIVER TRAINING CONTEXT

                    Erik Roelofs1, Jan Vissers2, Marieke van Onna1, Reinoud Nägele2
                          1
                            Cito, National Institute for Educational Measurement
                                         Arnhem, The Netherlands
                                   2
                                     DHV Environment and Transportation
                                       Amersfoort, The Netherlands
                                        E-mail: erik.roelofs@cito.nl

        Summary: Based on a competence-oriented view of driving a driver performance
        assessment (DPA) has been developed to inform learner drivers about their
        progress in acquiring driving proficiency. An initial validation study was carried
        out to evaluate the adequacy of inferences based on DPA-scores assigned by
        driving instructors. The results of two pilots are presented. Implications for
        driving performance assessment within driver training programs are discussed.

INTRODUCTION

All over the world novice drivers are heavily over-represented in traffic accidents and fatalities,
and male novice drivers even more so. Most studies (among others Maycock, Lockwood &
Lester, 1991; Gregersen & Bjurulf, 1996; Sagberg, 1998) have shown that in addition to age
related factors a lack of driving skills is an important factor in explaining the involvement in
accidents. More specifically, novice drivers appear to lack higher order skills: being able to
observe relevant information within the traffic situation; to concentrate on aspects of the traffic
environment that are potentially dangerous and to tailor their actions to their level of proficiency
(self-calibration).

With these findings in mind scholars have argued for a different view of driving and driver
training. Until recently the drivers’ task was perceived as a set of elementary driving tasks
pertaining to vehicle control and applying traffic rules. More recently, driving has been
considered as a broader domain of competence. A stepping stone in this respect was the
taxonomy of driving competence known as the GDE matrix (Goals for Driver Education). It is
now being used for developing curricula for driver training at both pre- and post-license stages.
The matrix stresses the overriding significance of the higher levels of driver behavior with regard
to accidents, and the need for drivers to possess not only knowledge and skills, but also risk
awareness and self-evaluation skills at multiple levels (Hatakka, Keskinen, Gregersen, Glad, &
Hernetkoski, 2002).

In various European countries a two-phased driver training program, including a pre-license and
post-license phase, is now under consideration. In addition, initial driver training programs have
been further improved by using lesson designs led by professional driving instructors aimed at
systematic teaching of meaningful driving tasks. In addition, initiatives for permanent (ongoing)
road safety education have emerged. Driver education is considered to be a long-lasting or even a
life-long process (Vissers, Van Betuw, Nägele, Kooistra & Harteveld, 2007).


                                                               482
PROCEEDINGS of the Fifth International Driving Symposium on Human Factors in Driver Assessment, Training and Vehicle Design


This shift towards competence-oriented driver training requires new forms of driving assessment
which inform and support the learner driver and the instructor about the acquisition of driving
competence (Dierick, & Dochy, 2001). Until recently, and in line with traditional views on driver
training, assessment instruments took the form of rather isolated testing of knowledge about
traffic rules in theory tests and technical driving skills in predominantly examiner-led road tests.
Internationally it is increasingly advocated to also assess higher order aspects of driving as
represented in the GDE-matrix: risk tolerance, reflection on one’s own driving behavior and
hazard perception (Vissers, 2004).

In 2007, the Dutch national institute for educational measurement (Cito) formed a consortium
with organizations active within the field of driver training. The aim of this consortium is to
develop assessment instruments which monitor driving competence for educational purposes
throughout peoples’ traffic career. This paper describes the development and application of an
on-road driver performance assessment (DPA), reflecting the innovative view on driving
competence. The focus is on a domain of driving competence building on the GDE-matrix,
including performance criteria and an assessment and scoring procedure for driving instructors
and driver examiners. The assessment procedure was tested within the context of initial driver
training. Because it is meant to inform the driver about his progress towards initial driver
proficiency, the DPA is regarded as a monitoring instrument, to be used on multiple occasions
throughout the training period. To evaluate the adequacy and appropriateness of inferences based
on DPA-scores, an initial validation study was set up.

Although the entire validation study addressed a wider range of aspects of validity (Kane, 2006)
this paper is restricted to the following research questions:

1. How reliable are the instructors’ assessments of their learner drivers’ driving performance?
2. To what extent do DPA-scores yield correct predictions about the final driving exam result?

METHOD

The driver performance assessment framework

Based on a framework for competent driving a scoring procedure was developed, in which
driving tasks are judged against strict criteria (Cito, 2008). Five performance criteria were used:

Safe driving refers to one’s ability to drive in such a way that the risk of injury or damage to the
driver himself or other road users is kept to a bare minimum. The driver is expected to constantly
drive at an appropriate speed: adapted to the circumstances and to the tasks at hand, and to his
own ability. He maintains sufficient safety margins in relation to other road users, correctly
assesses risk, recognizes danger in time and then chooses to act accordingly.

Consideration for other road users means that the driver pays attention to the safety and progress
of other road users as well as himself. This means that he does not stick dogmatically to his own
rights and he shrugs off other people’s mistakes. He avoids surprising others with his actions by
making his intentions clear well in advance. He gives others space to correct their mistakes. He


                                                               483
PROCEEDINGS of the Fifth International Driving Symposium on Human Factors in Driver Assessment, Training and Vehicle Design


puts himself in the position of other road users and can judge if his own behavior causes others
irritation or nervousness.

Facilitating traffic flow implies the ability to drive in traffic without impeding the progress of
other road users. The driver’s actions are not only safe but also vigorous and smooth. A driver
chooses where to stop or where to turn in a way that causes the least inconvenience to other
traffic. The same applies to performing maneuvers, such as reversing and parking. These tasks
are carried out in such a way that they do not hinder other road users.

Environmentally responsible driving involves driving in such a way that emissions of harmful
gases and noise levels are kept to a minimum and that optimal use of fuel is achieved. Such
driving involves avoiding large changes in speed: calm accelerating and decelerating, changing
up to a higher gear in good time and making use of the car’s rolling momentum, gentle use of the
accelerator and clutch when carrying out maneuvers. The engine should be switched off during
long stops.

Controlled driving means smooth technical vehicle handling and control. This means operating
navigational systems skillfully, carrying out actions smoothly: is the car being steered and
controlled smoothly, is the driver turning, stopping and driving off without stutters and jerks? On
an operational level this means supple and skilful execution of maneuvers: steering, accelerating,
using the clutch and braking are all done automatically and without fault.

The scoring procedure

Experienced driving instructors are responsible for the performance assessment. As part of a
practical training session, the learner driver drives along a route on public roads to enable a
judgment of his/her driving performance. Part of the session consists of driving without
intervention from the driver instructor, whose task is to observe the learner driver’s driving
skills. To collect evidence of driving competence the driving instructor instructs the participant
to drive along a representative route through five different areas, requiring a full range of typical
driving actions: residential access roads 1) inside and 2) outside built-up areas, roads connecting
towns 3) inside and 4) outside built-up areas, and 5) highways.

In order to make a systematic and comparable judgment of driving proficiency, scoring forms
were developed in which the various driving tasks were judged against the five criteria described
above. Two versions were elaborated. Firstly, a fine grained version in which each performance
criterion is elaborated further into specific performance indicators and in which 13 different
specific driving tasks are discerned. These tasks can be categorized under five main tasks:
preparing for driving (e.g. prepare vehicle and driver), making progress (e.g. driving off and
stopping), crossing intersections, moving laterally (e.g. changing lanes), carrying out special
maneuvers (e.g. turning). The resulting scoring form consisted of 126 cells to be scored, after
combination of 13 driving tasks and 12 performance criteria, and excluding 30 cells which do not
yield unique information about environmentally responsible driving. The assessor is expected to
score each cell on a rating scale ranging from 1 (very unsatisfactory) to 4(optimal).
The second version, the ‘global task area version’, was more general in nature. In this version,
driving through a specific type of area is considered as a task. The task performances were


                                                               484
PROCEEDINGS of the Fifth International Driving Symposium on Human Factors in Driver Assessment, Training and Vehicle Design


scored directly according to the five performance criteria. The resulting scoring form consisted
of 30 cells to be scored, after combination of six driving tasks (five areas plus ‘carrying out
special maneuvers’) and five performance criteria. The assessor assigned scores for each cell on
a five point rating scale ranging from 4 (unsatisfactory) up to 8 (optimal). The reason for using
this scoring range is that the assessors’ work within an educational context, described below,
where scoring levels 1 up to 3 refer to preliminary driving proficiency levels. The lowest scoring
level was set at level 4, which is fully equivalent with score level 1, as used in the fine grained
version.
The driving instructors acting in the role of assessors were trained to carry out the performance
assessments in a series of three 3-hour workshops. A detailed scoring manual was developed to
support the scoring procedure. Inter rater reliability was tested by using a set of 12 video-clips
showing critical parts of the task performance of four drivers, to be scored individually by each
of the assessors. Inter rater reliability coefficients were calculated to indicate assessors´ mastery
of the assessment procedure. For both versions of the form the inter rater reliability reached an
acceptable level (mean Gower coefficients for similarity above .70).

Subjects

The performance assessment procedure was carried out within two separate pilot studies. The
first pilot took place within a Dutch driving school, delivering short and condensed training
programs which culminated, approximately 15 days after the start, with a final exam consisting
of a 55 minute practical driving test. A total of 11 driving instructors participated. Their
instructional experience was on average 15 years (SD=7.5). Their mean age was 43.2 (SD=8.1).
The instructors used the DPA within a two month period during their regular training program
and was administered to each learner driver on two occasions. The first occasion was a driving
assessment administered during the training program, which yielded a partial dispensation on the
final exam (the so called ‘learner interim test’). On this occasion a professional driver examiner
from the Dutch National Driving Examination Institute (CBR) administered an official driving
assessment lasting approximately 55 minutes. In the meantime the driver instructor
independently judged the performance of the learner driver using the DPA. The second occasion
on which the DPA was used by the driver instructor was during the final exam, again
administered by a CBR examiner. In sum, 41 female (mean age 20.6 years) and 50 male learner
drivers (mean age 19.8 years) participated in the first study. The sample was representative in
terms of their prior school education.

The second pilot involved 26 Dutch driving instructors who work according to the method of
‘Driver Training Stepwise ‘(DTS; Nägele & Vissers, 2003). DTS is a modular driver training
program which differs from the traditional (driving school-based) training in two fundamental
respects: 1) the pupil learns how to drive in a series of highly-structured steps (driving scripts)
and 2) the pupil is only allowed to enter the next stage of learning if he shows complete mastery
of the previous stage. At the end of each learning stage there is a test to assess whether the pupil
has obtained the required level. In DTS-programs learner drivers are taught an average of 38
practical driving lessons of 60 minutes.

The driving instructors administered the DPA to each learner driver after the first two learning
stages or modules of DTS had been completed (score 1). In addition to this the DPA was also


                                                               485
PROCEEDINGS of the Fifth International Driving Symposium on Human Factors in Driver Assessment, Training and Vehicle Design


used by the driver examiner at the learner interim test (score 2) and at the official driving test
(score 3). In the second pilot 35 female learner drivers (mean age 20.3) and 26 male learner
drivers (mean age 19.6) participated. The sample was representative in terms of their prior school
education.

Analysis

Overall scores on the DPA formed the basis for further analyses. To arrive at an overall score for
driving performance on the fine grained version the individual cell scores were aggregated across
the tasks towards indicator scores. Five criteria scores and an overall score were then calculated.
For the global task area version, the first step in the aggregation procedure was the aggregation
towards criteria scores, which in turn were aggregated towards overall scores.

In order to estimate a pass/fail prediction boundary for the DPA score, logistic analyses were
carried out. In this analysis the logit of the odds ratio between passing and failing on the final
examinations is predicted by the DPA-score.

                                                                               p pass
                                                                          ln           a b x                              (1)
                                                                               p fail

where: p pass = the chance to pass and p fail the chance to fail, a is a constant, b a regression
coefficient belonging to x, referring to the DPA score.

                                                          Passed with fail
                                                          prediction


                                 passed
                                  Result on final


                                                    .80


                                                    .50
                                  exam


                                                                                              Failed with pass-
                                                                                              prediction
                                  failed


                                                              Will fail           Will pass


                                                                      DPA-score

                      Figure 1. misclassifications using DPA cut-off scores at p=.50 and p=.80

The cut-off score for the DPA is determined by choosing a cut-off point where the probability to
pass rises rapidly. In the present analyses the cut-off was set at p=.50. The cut-off score for the
DPA can be determined in such a way that the number of misclassifications is minimized.
Misclassified learner drivers can either be those who fail the exam with a ‘pass’ prediction, or
those who pass the exam with a ‘fail’ prediction. Using a relatively high cut-off score for the
prediction based on the DPA, such as one corresponding to an 80 percent pass probability, leaves
less failed candidates with a pass prediction. However, more learner drivers will find themselves
passed with a fail prediction (see figure 1).


                                                                                  486
PROCEEDINGS of the Fifth International Driving Symposium on Human Factors in Driver Assessment, Training and Vehicle Design


RESULTS

Reliability and discriminative power

To estimate the test-retest reliability of the DPA-measurements the scores on the two last
measurement moments were correlated. In pilot 1 the correlation between the first and last
moment was .80. In the second pilot the correlation between the second and the third
measurement score was .70. Note that due to differential growth of driving proficiency during
the training period, this correlation is an underestimation of the test-retest reliability.

Comparisons of mean DPA-scores for learner drivers who passed and failed on the final exam
show large and significant differences to the advantage of those who passed. Most of the effect
sizes (Cohen's d) are above 1, depicting large effects (see table 1). In pilot 2 the differences
between failing and passing learners drivers amount to 1.5 standard deviation on the third DPA
assessment, which is closest to the exam. In the first pilot, DPA score 1 is assigned a few days
before the final exam. Its discriminative power is also big (ES=-1.07).

Table 1. Means and standard deviations on the consecutive assessments for learner drivers who failed and
passed the final exam
                                           Failed                                 Passed
                                  N       Mean            SD           N           Mean             SD              t            df          ES
Pilot 1
DPA score 1                      23        2.45          0.42          23            2.85           0.53        -2.85*           44         -1.07
DPA score during final
exam                             45        2.56          0.50          47            3.13           0.56       -5.05**           90         -0.84
Pilot 2
DPA score 1                       6        5.49          0.42          50            6.13           0.48       -3.13**           54         -1.20
DPA score 2                       7        5.63          0.34          52            6.15           0.47        -2.83*           57         -0.98
DPA score 3                       7        5.82          0.28          52            6.57           0.45       -6.12**           57         -1.55
Note * p<.05; ** p<0.1

Predictions of results on the final exams

Table 2 up to 5 show cross tabs in which the actual result on the final examination is tabulated
against the predicted results, based on the dichotomized DPA score. Using the results of logistic
regression analyses, the cut-off scores corresponding a probability p= .50 were calculated as a
basis for dichotomization. Misclassifications are the observations that fall in the off-diagonal
cells.

Table 2. Classification table for DPA predictions (Pilot 1, at             Table 3. Classification table for DPA predictions (Pilot 2, at
         moment 1) against the result of the final exam                             moment 1) against the result of the final exam
                                          Predicted result                                                               Predicted result
                                         Failed       Passed                                                            Failed        Passed
Actual result of final       Failed        14            9                 Actual result of final          Failed         2             4
exam                                                                       exam
                             Passed         7           16                                                 Passed         1            50
Percentage correct                         67           64        65       Percentage correct                            67            93           91.2
Note: Calculated cut-off score on the DPA: 2.65 using a cut-off            Note: Calculated cut-off score on the DPA: 4.92 using a cut-off
probability p= .50.                                                        probability p= .50.


                                                                   487
PROCEEDINGS of the Fifth International Driving Symposium on Human Factors in Driver Assessment, Training and Vehicle Design


Table 4. Classification table for DPA predictions (Pilot 2, at            Table 5. Classification table for DPA predictions (Pilot 2, at
         moment 2) against the result of the final exam                            moment 3) against the result of the final exam
                                          Predicted result                                                          Predicted result
                                         Failed       Passed                                                       Failed       Passed
Actual result of final       Failed         1            6                Actual result of final       Failed         3            4
exam                                                                      exam
                             Passed         0           52                                             Passed         3           50
Percentage correct                         100          90        89.8    Percentage correct                         50           93        88.3
Note: Calculated cut-off score on the DPA: 4.73 using a cut-off           Note: Calculated cut-off score on the DPA: 5.63 using a cut-off
probability p= .50.                                                       probability p= .50


In the first pilot 65 percent of all predictions based on the DPA-scores turn out to be correct.
There is no meaningful difference in the correctness of pass and fail predictions. Looking at the
results of pilot 2 it can be observed that the percentage of correct predictions is higher than was
the case for pilot 1. Most of this is attributable to the large number of (correct) pass predictions.
There are only a few learner drivers who failed on the final exam (7 out of 60). The correctness
of their ‘fail’ prediction varies across the three measurement moments. If the DPA cut-off score
is set at a pass probability level of p=.80, with a corresponding a DPA-score of 5.89, this has a
positive but small influence on the correctness of both ‘fail’ and ‘pass’ predictions.

DISCUSSION

For educational purposes a formative driver performance assessment (DPA) was developed to
support training decisions and to enable predictions about pass probabilities on the final driving
exam. To evaluate the adequacy and appropriateness of inferences based on DPA-scores, a first
validation study was set up. In the present study only part of a full validity argument could be
evaluated. Building on Kane (2006) a validity argument can be set up in which the chain of
inferences when interpreting the outcomes of a performance assessment is evaluated. More
specifically, three inferences form the core of the validity argument: (1) reliable scoring of
performance by assessors, (2) generalization from the observed score on a specific assessment
task to a full range of assessment tasks, (3) extrapolation of assessment results to practice. In the
subsequent discussion these inferences will be addressed.

A first condition for performance assessments to yield valid score interpretations is score
reliability (research question 1). Results of inter rater reliability analyses during assessor training
indicated satisfying levels of rater agreement. In addition intercorrelations among successive
DPA measurements show that instructors’ judgments get stable towards the end of the training
period, i.e. later measurements are more highly intercorrelated than early measurements. It was
suggested that PDA-scores assigned early in the training program can vary more within learner
drivers because they may show differential growth patterns. This may have inhibited the size of
the test-retest correlation.

A limitation is that no direct inter rater reliability data could be collected for a large number of
assessors doing their job within a real driving situation. Some instructors in the assessor role
indicated that using video episodes of driving limited their ability to observe all aspects of
driving, for instance in determining the adequacy of speed choice, and vehicle control.


                                                                    488
PROCEEDINGS of the Fifth International Driving Symposium on Human Factors in Driver Assessment, Training and Vehicle Design


Another issue pertains to the nature of the performance scoring. Different versions of the DPA
were employed, involving rating scales of different lengths and a different degree of
decomposition into subtasks. The fine grained version involves a highly analytical judgment,
whereas the global task area form requires a more holistic judgment (Clauser, 2000). The
question can be raised whether both versions are equally decisive and informative about the state
of the drivers’ driving proficiency.

The second inference in the validity argument was an unaddressed issue, the generalizability of
performance scores. We did not estimate the effects of differences between the assessors, as a
potential source of measurement error, nor did we estimate the effects of differences in the
driving tasks that learner drivers were exposed to. The question is whether the tasks which
learner drivers carried out were representative for the full range of possible tasks. It is a well-
known finding that task variation accounts for much of the variance in performance (Brennan,
2000)

The third inference, extrapolation, addressed the question whether the assigned DPA-scores are
predictive of success on the final driving exam (research question 2). The results show
meaningful differences in DPA scores between passed and failed learner drivers. High effect
sizes were found, indicating high differential capacity. This relation is probably even
underestimated, taking into account that the examiners’ judgments on the final exam will not be
perfectly reliable.

Another way to look at the predictive validity of the DPA is to consider misclassifications
regarding the ‘fail’ and ‘pass’ predictions on the (future) final exam, based on the DPA-scores.
The results show different pictures for the two applications of the DPA. In the first pilot a fine
grained version of the DPA was used in the context of condensed driver training. Results show
that 65 percent of the learner drivers were correctly classified. In the second pilot, the context of
Driver Training Stepwise (DTS) a more holistic version of the DPA was employed. Using DPA-
scores 90 percent of the learner drivers could be classified correctly in terms of the predicted
outcome of the final exam. The higher percentage of correct decisions compared to the first DPA
pilot is mainly attributable to the correctness of pass predictions. This finding could be explained
by the nature of the DTS training program. Within this program the driver instructor collects a
lot of information about the learner driver regarding the progress on script mastery, by means of
specially designed progress cards. He does so over a relatively long period which lasts nearly
five months on average. The instructor will only send his learner driver to the final exam once he
has mastered all driving scripts and has passed the formative assessments. These drivers will
receive DPA-scores above the cut-off which instructors (implicitly) use in their judgments.

Looking back at the extrapolation inference, the quality of the external validation criterion used
can be questioned. For purposes of initial driver training the pass/fail prediction is a sufficient
criterion. For the instructor and the learner the growth towards exam preparedness is an
important issue. However, DPA was also meant to inform drivers about their driving proficiency
beyond the final exam, in the context of life-long learning. This would require an external
criterion that relates to actual driving outcomes during the subsequent driving career, such as
involvement in collisions and damage claims for one’s own and other vehicles. For now, it seems


                                                               489
PROCEEDINGS of the Fifth International Driving Symposium on Human Factors in Driver Assessment, Training and Vehicle Design


at least that the DPA is an appropriate tool to inform learner drivers about their progress towards
their obtaining their driving license.

References

Brennan, R.L. (2000). Performance assessments from the perspective of generalizability theory.
   Applied Psychological Measurement, 24(4), 339-353.
Cito (2008). Driver performance assessment. Scoring manual. Arnhem: Cito.
Clauser, B. E. (2000). Recurrent issues and recent advances in scoring performance assessments.
   Applied psychological measurement, 24, 310-323.
Dierick, S., & Dochy, F. (2001). New Lines in Edumetrics: New Forms of Assessment Lead to
   New Assessment Criteria. Studies in Educational Evaluation, 27(4), 307-329
Gregersen, N.P., & Bjurulf, P. (1996). Young novice drivers: towards a model of their accident
   involvement. Accident Analysis and Prevention 28, 229-241.
Hatakka, M., Keskinen, E., Gregersen, N.P., Glad, A. & Hernetkoski, K. (2002) From control of
   the vehicle to personal self-control; broadening the perspectives to driver education.
   Transportation Research Part F, 5, 201-215.
Kane, M.T. (2006). Validation. In Brennen, R.L. (Ed.), Education Measurement (4th ed.).
   Westport: PraegerPublishers.
Maycock, G., Lockwood, C.R. & Lester, J.F. (1991) The accident liability of car drivers. Report
  315. Crowthorne, Transport Research Laboratory.
Messick, S. (1996). Validity in performance assessments. In G.W.Phillips (ed.), Technical issues
  in large-scale performance assessments. Washington DC: National Center for Education
  Statistics.
Nägele, R.C & Vissers, J.A.M.M. (2003) Rijopleiding in Stappen (RIS). Evaluatie van de
   vervolgproef in de provincie Gelderland 2002-2003. ‘Driver Training Stepwise (DTS).
   [Evaluation of the follow-up in the province of Gelderland]. Veenendaal, Traffic Test.
Sagberg, F. (1998) Month-by-month changes in accident risk among novice drivers. Paper
   presented at the 24th International Congress of Applied Psychology. San Francisco, August.
Vissers, J.A.M.M. (2004) Testing and teaching of the higher order skills of the GDE-matrix.
   CIECA-congress, Warsaw.
Vissers, J.A.M.M., Van Betuw, A.M., Nägele, R.C., Kooistra, A. & Harteveld, M. (2007)
   Learning goals for lifelong road safety education. Amersfoort: DHV.


                                                               490

More Related Content

Similar to Validity of an on-road driver performance assessment within an initial driver training context

Article 01 Vol 8 Issue 1 - Apr 1 to Dec 31_2016
Article 01 Vol 8 Issue 1 - Apr 1 to Dec 31_2016Article 01 Vol 8 Issue 1 - Apr 1 to Dec 31_2016
Article 01 Vol 8 Issue 1 - Apr 1 to Dec 31_2016Dr Zafar Khan
 
Rosenbloom i safe final 20.8.13
Rosenbloom i safe final 20.8.13Rosenbloom i safe final 20.8.13
Rosenbloom i safe final 20.8.13MSullman
 
Ahmed RahhaliGrad 695Weekly journal #5My research seeks to.docx
Ahmed RahhaliGrad 695Weekly journal #5My research seeks to.docxAhmed RahhaliGrad 695Weekly journal #5My research seeks to.docx
Ahmed RahhaliGrad 695Weekly journal #5My research seeks to.docxdaniahendric
 
Competence based driving instructor exam
Competence based driving instructor examCompetence based driving instructor exam
Competence based driving instructor examErik Roelofs
 
01a - DBET Subcommittee Position Statement DRAFT February2015
01a - DBET Subcommittee Position Statement DRAFT February201501a - DBET Subcommittee Position Statement DRAFT February2015
01a - DBET Subcommittee Position Statement DRAFT February2015Dino Kalivas
 
Vrm global overview march 2015 global
Vrm global overview march 2015   globalVrm global overview march 2015   global
Vrm global overview march 2015 globalVM Fleet(PTY)Ltd
 
How to keep your finances on track
 How to keep your finances on track How to keep your finances on track
How to keep your finances on trackpleasure16
 
Virtual Risk Manager global overview july 2013 SA
Virtual Risk Manager global overview july 2013 SAVirtual Risk Manager global overview july 2013 SA
Virtual Risk Manager global overview july 2013 SAVM Fleet(PTY)Ltd
 
MiX SafeDrive Brochure_Online
MiX SafeDrive Brochure_OnlineMiX SafeDrive Brochure_Online
MiX SafeDrive Brochure_OnlineShaun Hadkinson
 
Eyeoctopus Presentation
Eyeoctopus PresentationEyeoctopus Presentation
Eyeoctopus Presentationbrussee
 
human factor and road safety
human factor and road safetyhuman factor and road safety
human factor and road safetyHABTE DEBISA
 
DRIVING NCII-INTRODUCTION- SENIOR HIGH.pptx
DRIVING NCII-INTRODUCTION- SENIOR HIGH.pptxDRIVING NCII-INTRODUCTION- SENIOR HIGH.pptx
DRIVING NCII-INTRODUCTION- SENIOR HIGH.pptxJanMagan
 
Does accurate self-awareness increase traffic safety behaviour
Does accurate self-awareness increase traffic safety behaviourDoes accurate self-awareness increase traffic safety behaviour
Does accurate self-awareness increase traffic safety behaviourErik Sommarström
 
Skippon vannozzi & flack 2013 icdbt driving as the simultaneous pursuit of mu...
Skippon vannozzi & flack 2013 icdbt driving as the simultaneous pursuit of mu...Skippon vannozzi & flack 2013 icdbt driving as the simultaneous pursuit of mu...
Skippon vannozzi & flack 2013 icdbt driving as the simultaneous pursuit of mu...MSullman
 

Similar to Validity of an on-road driver performance assessment within an initial driver training context (20)

Article 01 Vol 8 Issue 1 - Apr 1 to Dec 31_2016
Article 01 Vol 8 Issue 1 - Apr 1 to Dec 31_2016Article 01 Vol 8 Issue 1 - Apr 1 to Dec 31_2016
Article 01 Vol 8 Issue 1 - Apr 1 to Dec 31_2016
 
Rosenbloom i safe final 20.8.13
Rosenbloom i safe final 20.8.13Rosenbloom i safe final 20.8.13
Rosenbloom i safe final 20.8.13
 
Ahmed RahhaliGrad 695Weekly journal #5My research seeks to.docx
Ahmed RahhaliGrad 695Weekly journal #5My research seeks to.docxAhmed RahhaliGrad 695Weekly journal #5My research seeks to.docx
Ahmed RahhaliGrad 695Weekly journal #5My research seeks to.docx
 
Dr may 1st 2014
Dr may 1st 2014Dr may 1st 2014
Dr may 1st 2014
 
Competence based driving instructor exam
Competence based driving instructor examCompetence based driving instructor exam
Competence based driving instructor exam
 
01a - DBET Subcommittee Position Statement DRAFT February2015
01a - DBET Subcommittee Position Statement DRAFT February201501a - DBET Subcommittee Position Statement DRAFT February2015
01a - DBET Subcommittee Position Statement DRAFT February2015
 
Vrm global overview march 2015 global
Vrm global overview march 2015   globalVrm global overview march 2015   global
Vrm global overview march 2015 global
 
How to keep your finances on track
 How to keep your finances on track How to keep your finances on track
How to keep your finances on track
 
Presentation1
Presentation1Presentation1
Presentation1
 
RDC PUBLIC TRAINING 2016
RDC PUBLIC TRAINING 2016RDC PUBLIC TRAINING 2016
RDC PUBLIC TRAINING 2016
 
Virtual Risk Manager global overview july 2013 SA
Virtual Risk Manager global overview july 2013 SAVirtual Risk Manager global overview july 2013 SA
Virtual Risk Manager global overview july 2013 SA
 
MiX SafeDrive Brochure_Online
MiX SafeDrive Brochure_OnlineMiX SafeDrive Brochure_Online
MiX SafeDrive Brochure_Online
 
Eyeoctopus Presentation
Eyeoctopus PresentationEyeoctopus Presentation
Eyeoctopus Presentation
 
human factor and road safety
human factor and road safetyhuman factor and road safety
human factor and road safety
 
DRIVING NCII-INTRODUCTION- SENIOR HIGH.pptx
DRIVING NCII-INTRODUCTION- SENIOR HIGH.pptxDRIVING NCII-INTRODUCTION- SENIOR HIGH.pptx
DRIVING NCII-INTRODUCTION- SENIOR HIGH.pptx
 
ERGONOMICS2009_JoostdeWinter.pdf
ERGONOMICS2009_JoostdeWinter.pdfERGONOMICS2009_JoostdeWinter.pdf
ERGONOMICS2009_JoostdeWinter.pdf
 
Does accurate self-awareness increase traffic safety behaviour
Does accurate self-awareness increase traffic safety behaviourDoes accurate self-awareness increase traffic safety behaviour
Does accurate self-awareness increase traffic safety behaviour
 
Skippon vannozzi & flack 2013 icdbt driving as the simultaneous pursuit of mu...
Skippon vannozzi & flack 2013 icdbt driving as the simultaneous pursuit of mu...Skippon vannozzi & flack 2013 icdbt driving as the simultaneous pursuit of mu...
Skippon vannozzi & flack 2013 icdbt driving as the simultaneous pursuit of mu...
 
Session 50 Andereas Tapani
Session 50 Andereas TapaniSession 50 Andereas Tapani
Session 50 Andereas Tapani
 
RoSPA Driver Assessor
RoSPA Driver AssessorRoSPA Driver Assessor
RoSPA Driver Assessor
 

More from Erik Roelofs

Roelofs driver training and learning design from a developmental perspective
Roelofs   driver training and learning design from a developmental perspectiveRoelofs   driver training and learning design from a developmental perspective
Roelofs driver training and learning design from a developmental perspectiveErik Roelofs
 
Competence based exam for prospective driving instructors
Competence based exam for prospective driving instructorsCompetence based exam for prospective driving instructors
Competence based exam for prospective driving instructorsErik Roelofs
 
Hoofdstuk 2 toetsen op school
Hoofdstuk 2 toetsen op schoolHoofdstuk 2 toetsen op school
Hoofdstuk 2 toetsen op schoolErik Roelofs
 
Op weg naar congruentie tussen opleiden en beoordelen van docenten: een raamw...
Op weg naar congruentie tussen opleiden en beoordelen van docenten: een raamw...Op weg naar congruentie tussen opleiden en beoordelen van docenten: een raamw...
Op weg naar congruentie tussen opleiden en beoordelen van docenten: een raamw...Erik Roelofs
 
Towards a framework for assessing teacher competence
Towards a framework for assessing teacher competenceTowards a framework for assessing teacher competence
Towards a framework for assessing teacher competenceErik Roelofs
 
Vaststellen van didactische bekwaamheid tijdens de LIO-stage
Vaststellen van didactische bekwaamheid tijdens de LIO-stageVaststellen van didactische bekwaamheid tijdens de LIO-stage
Vaststellen van didactische bekwaamheid tijdens de LIO-stageErik Roelofs
 
Een procesmodel voor de beoordeling van competent handelen
Een procesmodel voor de beoordeling van competent handelenEen procesmodel voor de beoordeling van competent handelen
Een procesmodel voor de beoordeling van competent handelenErik Roelofs
 

More from Erik Roelofs (7)

Roelofs driver training and learning design from a developmental perspective
Roelofs   driver training and learning design from a developmental perspectiveRoelofs   driver training and learning design from a developmental perspective
Roelofs driver training and learning design from a developmental perspective
 
Competence based exam for prospective driving instructors
Competence based exam for prospective driving instructorsCompetence based exam for prospective driving instructors
Competence based exam for prospective driving instructors
 
Hoofdstuk 2 toetsen op school
Hoofdstuk 2 toetsen op schoolHoofdstuk 2 toetsen op school
Hoofdstuk 2 toetsen op school
 
Op weg naar congruentie tussen opleiden en beoordelen van docenten: een raamw...
Op weg naar congruentie tussen opleiden en beoordelen van docenten: een raamw...Op weg naar congruentie tussen opleiden en beoordelen van docenten: een raamw...
Op weg naar congruentie tussen opleiden en beoordelen van docenten: een raamw...
 
Towards a framework for assessing teacher competence
Towards a framework for assessing teacher competenceTowards a framework for assessing teacher competence
Towards a framework for assessing teacher competence
 
Vaststellen van didactische bekwaamheid tijdens de LIO-stage
Vaststellen van didactische bekwaamheid tijdens de LIO-stageVaststellen van didactische bekwaamheid tijdens de LIO-stage
Vaststellen van didactische bekwaamheid tijdens de LIO-stage
 
Een procesmodel voor de beoordeling van competent handelen
Een procesmodel voor de beoordeling van competent handelenEen procesmodel voor de beoordeling van competent handelen
Een procesmodel voor de beoordeling van competent handelen
 

Recently uploaded

DIFFERENT BASKETRY IN THE PHILIPPINES PPT.pptx
DIFFERENT BASKETRY IN THE PHILIPPINES PPT.pptxDIFFERENT BASKETRY IN THE PHILIPPINES PPT.pptx
DIFFERENT BASKETRY IN THE PHILIPPINES PPT.pptxMichelleTuguinay1
 
Concurrency Control in Database Management system
Concurrency Control in Database Management systemConcurrency Control in Database Management system
Concurrency Control in Database Management systemChristalin Nelson
 
Narcotic and Non Narcotic Analgesic..pdf
Narcotic and Non Narcotic Analgesic..pdfNarcotic and Non Narcotic Analgesic..pdf
Narcotic and Non Narcotic Analgesic..pdfPrerana Jadhav
 
ICS2208 Lecture6 Notes for SL spaces.pdf
ICS2208 Lecture6 Notes for SL spaces.pdfICS2208 Lecture6 Notes for SL spaces.pdf
ICS2208 Lecture6 Notes for SL spaces.pdfVanessa Camilleri
 
Grade Three -ELLNA-REVIEWER-ENGLISH.pptx
Grade Three -ELLNA-REVIEWER-ENGLISH.pptxGrade Three -ELLNA-REVIEWER-ENGLISH.pptx
Grade Three -ELLNA-REVIEWER-ENGLISH.pptxkarenfajardo43
 
Unraveling Hypertext_ Analyzing Postmodern Elements in Literature.pptx
Unraveling Hypertext_ Analyzing  Postmodern Elements in  Literature.pptxUnraveling Hypertext_ Analyzing  Postmodern Elements in  Literature.pptx
Unraveling Hypertext_ Analyzing Postmodern Elements in Literature.pptxDhatriParmar
 
Decoding the Tweet _ Practical Criticism in the Age of Hashtag.pptx
Decoding the Tweet _ Practical Criticism in the Age of Hashtag.pptxDecoding the Tweet _ Practical Criticism in the Age of Hashtag.pptx
Decoding the Tweet _ Practical Criticism in the Age of Hashtag.pptxDhatriParmar
 
week 1 cookery 8 fourth - quarter .pptx
week 1 cookery 8  fourth  -  quarter .pptxweek 1 cookery 8  fourth  -  quarter .pptx
week 1 cookery 8 fourth - quarter .pptxJonalynLegaspi2
 
4.16.24 Poverty and Precarity--Desmond.pptx
4.16.24 Poverty and Precarity--Desmond.pptx4.16.24 Poverty and Precarity--Desmond.pptx
4.16.24 Poverty and Precarity--Desmond.pptxmary850239
 
How to Fix XML SyntaxError in Odoo the 17
How to Fix XML SyntaxError in Odoo the 17How to Fix XML SyntaxError in Odoo the 17
How to Fix XML SyntaxError in Odoo the 17Celine George
 
INTRODUCTION TO CATHOLIC CHRISTOLOGY.pptx
INTRODUCTION TO CATHOLIC CHRISTOLOGY.pptxINTRODUCTION TO CATHOLIC CHRISTOLOGY.pptx
INTRODUCTION TO CATHOLIC CHRISTOLOGY.pptxHumphrey A Beña
 
Daily Lesson Plan in Mathematics Quarter 4
Daily Lesson Plan in Mathematics Quarter 4Daily Lesson Plan in Mathematics Quarter 4
Daily Lesson Plan in Mathematics Quarter 4JOYLYNSAMANIEGO
 
4.11.24 Poverty and Inequality in America.pptx
4.11.24 Poverty and Inequality in America.pptx4.11.24 Poverty and Inequality in America.pptx
4.11.24 Poverty and Inequality in America.pptxmary850239
 
Q4-PPT-Music9_Lesson-1-Romantic-Opera.pptx
Q4-PPT-Music9_Lesson-1-Romantic-Opera.pptxQ4-PPT-Music9_Lesson-1-Romantic-Opera.pptx
Q4-PPT-Music9_Lesson-1-Romantic-Opera.pptxlancelewisportillo
 
ClimART Action | eTwinning Project
ClimART Action    |    eTwinning ProjectClimART Action    |    eTwinning Project
ClimART Action | eTwinning Projectjordimapav
 
Textual Evidence in Reading and Writing of SHS
Textual Evidence in Reading and Writing of SHSTextual Evidence in Reading and Writing of SHS
Textual Evidence in Reading and Writing of SHSMae Pangan
 
4.16.24 21st Century Movements for Black Lives.pptx
4.16.24 21st Century Movements for Black Lives.pptx4.16.24 21st Century Movements for Black Lives.pptx
4.16.24 21st Century Movements for Black Lives.pptxmary850239
 
Active Learning Strategies (in short ALS).pdf
Active Learning Strategies (in short ALS).pdfActive Learning Strategies (in short ALS).pdf
Active Learning Strategies (in short ALS).pdfPatidar M
 

Recently uploaded (20)

DIFFERENT BASKETRY IN THE PHILIPPINES PPT.pptx
DIFFERENT BASKETRY IN THE PHILIPPINES PPT.pptxDIFFERENT BASKETRY IN THE PHILIPPINES PPT.pptx
DIFFERENT BASKETRY IN THE PHILIPPINES PPT.pptx
 
Concurrency Control in Database Management system
Concurrency Control in Database Management systemConcurrency Control in Database Management system
Concurrency Control in Database Management system
 
Narcotic and Non Narcotic Analgesic..pdf
Narcotic and Non Narcotic Analgesic..pdfNarcotic and Non Narcotic Analgesic..pdf
Narcotic and Non Narcotic Analgesic..pdf
 
ICS2208 Lecture6 Notes for SL spaces.pdf
ICS2208 Lecture6 Notes for SL spaces.pdfICS2208 Lecture6 Notes for SL spaces.pdf
ICS2208 Lecture6 Notes for SL spaces.pdf
 
Grade Three -ELLNA-REVIEWER-ENGLISH.pptx
Grade Three -ELLNA-REVIEWER-ENGLISH.pptxGrade Three -ELLNA-REVIEWER-ENGLISH.pptx
Grade Three -ELLNA-REVIEWER-ENGLISH.pptx
 
Unraveling Hypertext_ Analyzing Postmodern Elements in Literature.pptx
Unraveling Hypertext_ Analyzing  Postmodern Elements in  Literature.pptxUnraveling Hypertext_ Analyzing  Postmodern Elements in  Literature.pptx
Unraveling Hypertext_ Analyzing Postmodern Elements in Literature.pptx
 
Decoding the Tweet _ Practical Criticism in the Age of Hashtag.pptx
Decoding the Tweet _ Practical Criticism in the Age of Hashtag.pptxDecoding the Tweet _ Practical Criticism in the Age of Hashtag.pptx
Decoding the Tweet _ Practical Criticism in the Age of Hashtag.pptx
 
week 1 cookery 8 fourth - quarter .pptx
week 1 cookery 8  fourth  -  quarter .pptxweek 1 cookery 8  fourth  -  quarter .pptx
week 1 cookery 8 fourth - quarter .pptx
 
4.16.24 Poverty and Precarity--Desmond.pptx
4.16.24 Poverty and Precarity--Desmond.pptx4.16.24 Poverty and Precarity--Desmond.pptx
4.16.24 Poverty and Precarity--Desmond.pptx
 
How to Fix XML SyntaxError in Odoo the 17
How to Fix XML SyntaxError in Odoo the 17How to Fix XML SyntaxError in Odoo the 17
How to Fix XML SyntaxError in Odoo the 17
 
INTRODUCTION TO CATHOLIC CHRISTOLOGY.pptx
INTRODUCTION TO CATHOLIC CHRISTOLOGY.pptxINTRODUCTION TO CATHOLIC CHRISTOLOGY.pptx
INTRODUCTION TO CATHOLIC CHRISTOLOGY.pptx
 
Daily Lesson Plan in Mathematics Quarter 4
Daily Lesson Plan in Mathematics Quarter 4Daily Lesson Plan in Mathematics Quarter 4
Daily Lesson Plan in Mathematics Quarter 4
 
Mattingly "AI & Prompt Design: Large Language Models"
Mattingly "AI & Prompt Design: Large Language Models"Mattingly "AI & Prompt Design: Large Language Models"
Mattingly "AI & Prompt Design: Large Language Models"
 
Paradigm shift in nursing research by RS MEHTA
Paradigm shift in nursing research by RS MEHTAParadigm shift in nursing research by RS MEHTA
Paradigm shift in nursing research by RS MEHTA
 
4.11.24 Poverty and Inequality in America.pptx
4.11.24 Poverty and Inequality in America.pptx4.11.24 Poverty and Inequality in America.pptx
4.11.24 Poverty and Inequality in America.pptx
 
Q4-PPT-Music9_Lesson-1-Romantic-Opera.pptx
Q4-PPT-Music9_Lesson-1-Romantic-Opera.pptxQ4-PPT-Music9_Lesson-1-Romantic-Opera.pptx
Q4-PPT-Music9_Lesson-1-Romantic-Opera.pptx
 
ClimART Action | eTwinning Project
ClimART Action    |    eTwinning ProjectClimART Action    |    eTwinning Project
ClimART Action | eTwinning Project
 
Textual Evidence in Reading and Writing of SHS
Textual Evidence in Reading and Writing of SHSTextual Evidence in Reading and Writing of SHS
Textual Evidence in Reading and Writing of SHS
 
4.16.24 21st Century Movements for Black Lives.pptx
4.16.24 21st Century Movements for Black Lives.pptx4.16.24 21st Century Movements for Black Lives.pptx
4.16.24 21st Century Movements for Black Lives.pptx
 
Active Learning Strategies (in short ALS).pdf
Active Learning Strategies (in short ALS).pdfActive Learning Strategies (in short ALS).pdf
Active Learning Strategies (in short ALS).pdf
 

Validity of an on-road driver performance assessment within an initial driver training context

  • 1. PROCEEDINGS of the Fifth International Driving Symposium on Human Factors in Driver Assessment, Training and Vehicle Design VALIDITY OF AN ON-ROAD DRIVER PERFORMANCE ASSESSMENT WITHIN AN INITIAL DRIVER TRAINING CONTEXT Erik Roelofs1, Jan Vissers2, Marieke van Onna1, Reinoud Nägele2 1 Cito, National Institute for Educational Measurement Arnhem, The Netherlands 2 DHV Environment and Transportation Amersfoort, The Netherlands E-mail: erik.roelofs@cito.nl Summary: Based on a competence-oriented view of driving a driver performance assessment (DPA) has been developed to inform learner drivers about their progress in acquiring driving proficiency. An initial validation study was carried out to evaluate the adequacy of inferences based on DPA-scores assigned by driving instructors. The results of two pilots are presented. Implications for driving performance assessment within driver training programs are discussed. INTRODUCTION All over the world novice drivers are heavily over-represented in traffic accidents and fatalities, and male novice drivers even more so. Most studies (among others Maycock, Lockwood & Lester, 1991; Gregersen & Bjurulf, 1996; Sagberg, 1998) have shown that in addition to age related factors a lack of driving skills is an important factor in explaining the involvement in accidents. More specifically, novice drivers appear to lack higher order skills: being able to observe relevant information within the traffic situation; to concentrate on aspects of the traffic environment that are potentially dangerous and to tailor their actions to their level of proficiency (self-calibration). With these findings in mind scholars have argued for a different view of driving and driver training. Until recently the drivers’ task was perceived as a set of elementary driving tasks pertaining to vehicle control and applying traffic rules. More recently, driving has been considered as a broader domain of competence. A stepping stone in this respect was the taxonomy of driving competence known as the GDE matrix (Goals for Driver Education). It is now being used for developing curricula for driver training at both pre- and post-license stages. The matrix stresses the overriding significance of the higher levels of driver behavior with regard to accidents, and the need for drivers to possess not only knowledge and skills, but also risk awareness and self-evaluation skills at multiple levels (Hatakka, Keskinen, Gregersen, Glad, & Hernetkoski, 2002). In various European countries a two-phased driver training program, including a pre-license and post-license phase, is now under consideration. In addition, initial driver training programs have been further improved by using lesson designs led by professional driving instructors aimed at systematic teaching of meaningful driving tasks. In addition, initiatives for permanent (ongoing) road safety education have emerged. Driver education is considered to be a long-lasting or even a life-long process (Vissers, Van Betuw, Nägele, Kooistra & Harteveld, 2007). 482
  • 2. PROCEEDINGS of the Fifth International Driving Symposium on Human Factors in Driver Assessment, Training and Vehicle Design This shift towards competence-oriented driver training requires new forms of driving assessment which inform and support the learner driver and the instructor about the acquisition of driving competence (Dierick, & Dochy, 2001). Until recently, and in line with traditional views on driver training, assessment instruments took the form of rather isolated testing of knowledge about traffic rules in theory tests and technical driving skills in predominantly examiner-led road tests. Internationally it is increasingly advocated to also assess higher order aspects of driving as represented in the GDE-matrix: risk tolerance, reflection on one’s own driving behavior and hazard perception (Vissers, 2004). In 2007, the Dutch national institute for educational measurement (Cito) formed a consortium with organizations active within the field of driver training. The aim of this consortium is to develop assessment instruments which monitor driving competence for educational purposes throughout peoples’ traffic career. This paper describes the development and application of an on-road driver performance assessment (DPA), reflecting the innovative view on driving competence. The focus is on a domain of driving competence building on the GDE-matrix, including performance criteria and an assessment and scoring procedure for driving instructors and driver examiners. The assessment procedure was tested within the context of initial driver training. Because it is meant to inform the driver about his progress towards initial driver proficiency, the DPA is regarded as a monitoring instrument, to be used on multiple occasions throughout the training period. To evaluate the adequacy and appropriateness of inferences based on DPA-scores, an initial validation study was set up. Although the entire validation study addressed a wider range of aspects of validity (Kane, 2006) this paper is restricted to the following research questions: 1. How reliable are the instructors’ assessments of their learner drivers’ driving performance? 2. To what extent do DPA-scores yield correct predictions about the final driving exam result? METHOD The driver performance assessment framework Based on a framework for competent driving a scoring procedure was developed, in which driving tasks are judged against strict criteria (Cito, 2008). Five performance criteria were used: Safe driving refers to one’s ability to drive in such a way that the risk of injury or damage to the driver himself or other road users is kept to a bare minimum. The driver is expected to constantly drive at an appropriate speed: adapted to the circumstances and to the tasks at hand, and to his own ability. He maintains sufficient safety margins in relation to other road users, correctly assesses risk, recognizes danger in time and then chooses to act accordingly. Consideration for other road users means that the driver pays attention to the safety and progress of other road users as well as himself. This means that he does not stick dogmatically to his own rights and he shrugs off other people’s mistakes. He avoids surprising others with his actions by making his intentions clear well in advance. He gives others space to correct their mistakes. He 483
  • 3. PROCEEDINGS of the Fifth International Driving Symposium on Human Factors in Driver Assessment, Training and Vehicle Design puts himself in the position of other road users and can judge if his own behavior causes others irritation or nervousness. Facilitating traffic flow implies the ability to drive in traffic without impeding the progress of other road users. The driver’s actions are not only safe but also vigorous and smooth. A driver chooses where to stop or where to turn in a way that causes the least inconvenience to other traffic. The same applies to performing maneuvers, such as reversing and parking. These tasks are carried out in such a way that they do not hinder other road users. Environmentally responsible driving involves driving in such a way that emissions of harmful gases and noise levels are kept to a minimum and that optimal use of fuel is achieved. Such driving involves avoiding large changes in speed: calm accelerating and decelerating, changing up to a higher gear in good time and making use of the car’s rolling momentum, gentle use of the accelerator and clutch when carrying out maneuvers. The engine should be switched off during long stops. Controlled driving means smooth technical vehicle handling and control. This means operating navigational systems skillfully, carrying out actions smoothly: is the car being steered and controlled smoothly, is the driver turning, stopping and driving off without stutters and jerks? On an operational level this means supple and skilful execution of maneuvers: steering, accelerating, using the clutch and braking are all done automatically and without fault. The scoring procedure Experienced driving instructors are responsible for the performance assessment. As part of a practical training session, the learner driver drives along a route on public roads to enable a judgment of his/her driving performance. Part of the session consists of driving without intervention from the driver instructor, whose task is to observe the learner driver’s driving skills. To collect evidence of driving competence the driving instructor instructs the participant to drive along a representative route through five different areas, requiring a full range of typical driving actions: residential access roads 1) inside and 2) outside built-up areas, roads connecting towns 3) inside and 4) outside built-up areas, and 5) highways. In order to make a systematic and comparable judgment of driving proficiency, scoring forms were developed in which the various driving tasks were judged against the five criteria described above. Two versions were elaborated. Firstly, a fine grained version in which each performance criterion is elaborated further into specific performance indicators and in which 13 different specific driving tasks are discerned. These tasks can be categorized under five main tasks: preparing for driving (e.g. prepare vehicle and driver), making progress (e.g. driving off and stopping), crossing intersections, moving laterally (e.g. changing lanes), carrying out special maneuvers (e.g. turning). The resulting scoring form consisted of 126 cells to be scored, after combination of 13 driving tasks and 12 performance criteria, and excluding 30 cells which do not yield unique information about environmentally responsible driving. The assessor is expected to score each cell on a rating scale ranging from 1 (very unsatisfactory) to 4(optimal). The second version, the ‘global task area version’, was more general in nature. In this version, driving through a specific type of area is considered as a task. The task performances were 484
  • 4. PROCEEDINGS of the Fifth International Driving Symposium on Human Factors in Driver Assessment, Training and Vehicle Design scored directly according to the five performance criteria. The resulting scoring form consisted of 30 cells to be scored, after combination of six driving tasks (five areas plus ‘carrying out special maneuvers’) and five performance criteria. The assessor assigned scores for each cell on a five point rating scale ranging from 4 (unsatisfactory) up to 8 (optimal). The reason for using this scoring range is that the assessors’ work within an educational context, described below, where scoring levels 1 up to 3 refer to preliminary driving proficiency levels. The lowest scoring level was set at level 4, which is fully equivalent with score level 1, as used in the fine grained version. The driving instructors acting in the role of assessors were trained to carry out the performance assessments in a series of three 3-hour workshops. A detailed scoring manual was developed to support the scoring procedure. Inter rater reliability was tested by using a set of 12 video-clips showing critical parts of the task performance of four drivers, to be scored individually by each of the assessors. Inter rater reliability coefficients were calculated to indicate assessors´ mastery of the assessment procedure. For both versions of the form the inter rater reliability reached an acceptable level (mean Gower coefficients for similarity above .70). Subjects The performance assessment procedure was carried out within two separate pilot studies. The first pilot took place within a Dutch driving school, delivering short and condensed training programs which culminated, approximately 15 days after the start, with a final exam consisting of a 55 minute practical driving test. A total of 11 driving instructors participated. Their instructional experience was on average 15 years (SD=7.5). Their mean age was 43.2 (SD=8.1). The instructors used the DPA within a two month period during their regular training program and was administered to each learner driver on two occasions. The first occasion was a driving assessment administered during the training program, which yielded a partial dispensation on the final exam (the so called ‘learner interim test’). On this occasion a professional driver examiner from the Dutch National Driving Examination Institute (CBR) administered an official driving assessment lasting approximately 55 minutes. In the meantime the driver instructor independently judged the performance of the learner driver using the DPA. The second occasion on which the DPA was used by the driver instructor was during the final exam, again administered by a CBR examiner. In sum, 41 female (mean age 20.6 years) and 50 male learner drivers (mean age 19.8 years) participated in the first study. The sample was representative in terms of their prior school education. The second pilot involved 26 Dutch driving instructors who work according to the method of ‘Driver Training Stepwise ‘(DTS; Nägele & Vissers, 2003). DTS is a modular driver training program which differs from the traditional (driving school-based) training in two fundamental respects: 1) the pupil learns how to drive in a series of highly-structured steps (driving scripts) and 2) the pupil is only allowed to enter the next stage of learning if he shows complete mastery of the previous stage. At the end of each learning stage there is a test to assess whether the pupil has obtained the required level. In DTS-programs learner drivers are taught an average of 38 practical driving lessons of 60 minutes. The driving instructors administered the DPA to each learner driver after the first two learning stages or modules of DTS had been completed (score 1). In addition to this the DPA was also 485
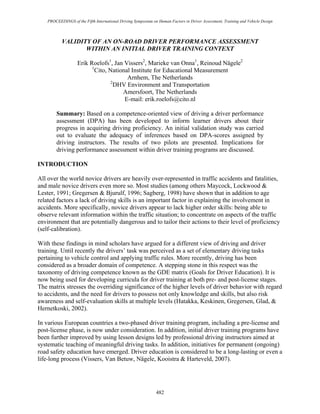
  • 5. PROCEEDINGS of the Fifth International Driving Symposium on Human Factors in Driver Assessment, Training and Vehicle Design used by the driver examiner at the learner interim test (score 2) and at the official driving test (score 3). In the second pilot 35 female learner drivers (mean age 20.3) and 26 male learner drivers (mean age 19.6) participated. The sample was representative in terms of their prior school education. Analysis Overall scores on the DPA formed the basis for further analyses. To arrive at an overall score for driving performance on the fine grained version the individual cell scores were aggregated across the tasks towards indicator scores. Five criteria scores and an overall score were then calculated. For the global task area version, the first step in the aggregation procedure was the aggregation towards criteria scores, which in turn were aggregated towards overall scores. In order to estimate a pass/fail prediction boundary for the DPA score, logistic analyses were carried out. In this analysis the logit of the odds ratio between passing and failing on the final examinations is predicted by the DPA-score. p pass ln  a b x (1) p fail where: p pass = the chance to pass and p fail the chance to fail, a is a constant, b a regression coefficient belonging to x, referring to the DPA score. Passed with fail prediction passed Result on final .80 .50 exam Failed with pass- prediction failed Will fail Will pass DPA-score Figure 1. misclassifications using DPA cut-off scores at p=.50 and p=.80 The cut-off score for the DPA is determined by choosing a cut-off point where the probability to pass rises rapidly. In the present analyses the cut-off was set at p=.50. The cut-off score for the DPA can be determined in such a way that the number of misclassifications is minimized. Misclassified learner drivers can either be those who fail the exam with a ‘pass’ prediction, or those who pass the exam with a ‘fail’ prediction. Using a relatively high cut-off score for the prediction based on the DPA, such as one corresponding to an 80 percent pass probability, leaves less failed candidates with a pass prediction. However, more learner drivers will find themselves passed with a fail prediction (see figure 1). 486
  • 6. PROCEEDINGS of the Fifth International Driving Symposium on Human Factors in Driver Assessment, Training and Vehicle Design RESULTS Reliability and discriminative power To estimate the test-retest reliability of the DPA-measurements the scores on the two last measurement moments were correlated. In pilot 1 the correlation between the first and last moment was .80. In the second pilot the correlation between the second and the third measurement score was .70. Note that due to differential growth of driving proficiency during the training period, this correlation is an underestimation of the test-retest reliability. Comparisons of mean DPA-scores for learner drivers who passed and failed on the final exam show large and significant differences to the advantage of those who passed. Most of the effect sizes (Cohen's d) are above 1, depicting large effects (see table 1). In pilot 2 the differences between failing and passing learners drivers amount to 1.5 standard deviation on the third DPA assessment, which is closest to the exam. In the first pilot, DPA score 1 is assigned a few days before the final exam. Its discriminative power is also big (ES=-1.07). Table 1. Means and standard deviations on the consecutive assessments for learner drivers who failed and passed the final exam Failed Passed N Mean SD N Mean SD t df ES Pilot 1 DPA score 1 23 2.45 0.42 23 2.85 0.53 -2.85* 44 -1.07 DPA score during final exam 45 2.56 0.50 47 3.13 0.56 -5.05** 90 -0.84 Pilot 2 DPA score 1 6 5.49 0.42 50 6.13 0.48 -3.13** 54 -1.20 DPA score 2 7 5.63 0.34 52 6.15 0.47 -2.83* 57 -0.98 DPA score 3 7 5.82 0.28 52 6.57 0.45 -6.12** 57 -1.55 Note * p<.05; ** p<0.1 Predictions of results on the final exams Table 2 up to 5 show cross tabs in which the actual result on the final examination is tabulated against the predicted results, based on the dichotomized DPA score. Using the results of logistic regression analyses, the cut-off scores corresponding a probability p= .50 were calculated as a basis for dichotomization. Misclassifications are the observations that fall in the off-diagonal cells. Table 2. Classification table for DPA predictions (Pilot 1, at Table 3. Classification table for DPA predictions (Pilot 2, at moment 1) against the result of the final exam moment 1) against the result of the final exam Predicted result Predicted result Failed Passed Failed Passed Actual result of final Failed 14 9 Actual result of final Failed 2 4 exam exam Passed 7 16 Passed 1 50 Percentage correct 67 64 65 Percentage correct 67 93 91.2 Note: Calculated cut-off score on the DPA: 2.65 using a cut-off Note: Calculated cut-off score on the DPA: 4.92 using a cut-off probability p= .50. probability p= .50. 487
  • 7. PROCEEDINGS of the Fifth International Driving Symposium on Human Factors in Driver Assessment, Training and Vehicle Design Table 4. Classification table for DPA predictions (Pilot 2, at Table 5. Classification table for DPA predictions (Pilot 2, at moment 2) against the result of the final exam moment 3) against the result of the final exam Predicted result Predicted result Failed Passed Failed Passed Actual result of final Failed 1 6 Actual result of final Failed 3 4 exam exam Passed 0 52 Passed 3 50 Percentage correct 100 90 89.8 Percentage correct 50 93 88.3 Note: Calculated cut-off score on the DPA: 4.73 using a cut-off Note: Calculated cut-off score on the DPA: 5.63 using a cut-off probability p= .50. probability p= .50 In the first pilot 65 percent of all predictions based on the DPA-scores turn out to be correct. There is no meaningful difference in the correctness of pass and fail predictions. Looking at the results of pilot 2 it can be observed that the percentage of correct predictions is higher than was the case for pilot 1. Most of this is attributable to the large number of (correct) pass predictions. There are only a few learner drivers who failed on the final exam (7 out of 60). The correctness of their ‘fail’ prediction varies across the three measurement moments. If the DPA cut-off score is set at a pass probability level of p=.80, with a corresponding a DPA-score of 5.89, this has a positive but small influence on the correctness of both ‘fail’ and ‘pass’ predictions. DISCUSSION For educational purposes a formative driver performance assessment (DPA) was developed to support training decisions and to enable predictions about pass probabilities on the final driving exam. To evaluate the adequacy and appropriateness of inferences based on DPA-scores, a first validation study was set up. In the present study only part of a full validity argument could be evaluated. Building on Kane (2006) a validity argument can be set up in which the chain of inferences when interpreting the outcomes of a performance assessment is evaluated. More specifically, three inferences form the core of the validity argument: (1) reliable scoring of performance by assessors, (2) generalization from the observed score on a specific assessment task to a full range of assessment tasks, (3) extrapolation of assessment results to practice. In the subsequent discussion these inferences will be addressed. A first condition for performance assessments to yield valid score interpretations is score reliability (research question 1). Results of inter rater reliability analyses during assessor training indicated satisfying levels of rater agreement. In addition intercorrelations among successive DPA measurements show that instructors’ judgments get stable towards the end of the training period, i.e. later measurements are more highly intercorrelated than early measurements. It was suggested that PDA-scores assigned early in the training program can vary more within learner drivers because they may show differential growth patterns. This may have inhibited the size of the test-retest correlation. A limitation is that no direct inter rater reliability data could be collected for a large number of assessors doing their job within a real driving situation. Some instructors in the assessor role indicated that using video episodes of driving limited their ability to observe all aspects of driving, for instance in determining the adequacy of speed choice, and vehicle control. 488
  • 8. PROCEEDINGS of the Fifth International Driving Symposium on Human Factors in Driver Assessment, Training and Vehicle Design Another issue pertains to the nature of the performance scoring. Different versions of the DPA were employed, involving rating scales of different lengths and a different degree of decomposition into subtasks. The fine grained version involves a highly analytical judgment, whereas the global task area form requires a more holistic judgment (Clauser, 2000). The question can be raised whether both versions are equally decisive and informative about the state of the drivers’ driving proficiency. The second inference in the validity argument was an unaddressed issue, the generalizability of performance scores. We did not estimate the effects of differences between the assessors, as a potential source of measurement error, nor did we estimate the effects of differences in the driving tasks that learner drivers were exposed to. The question is whether the tasks which learner drivers carried out were representative for the full range of possible tasks. It is a well- known finding that task variation accounts for much of the variance in performance (Brennan, 2000) The third inference, extrapolation, addressed the question whether the assigned DPA-scores are predictive of success on the final driving exam (research question 2). The results show meaningful differences in DPA scores between passed and failed learner drivers. High effect sizes were found, indicating high differential capacity. This relation is probably even underestimated, taking into account that the examiners’ judgments on the final exam will not be perfectly reliable. Another way to look at the predictive validity of the DPA is to consider misclassifications regarding the ‘fail’ and ‘pass’ predictions on the (future) final exam, based on the DPA-scores. The results show different pictures for the two applications of the DPA. In the first pilot a fine grained version of the DPA was used in the context of condensed driver training. Results show that 65 percent of the learner drivers were correctly classified. In the second pilot, the context of Driver Training Stepwise (DTS) a more holistic version of the DPA was employed. Using DPA- scores 90 percent of the learner drivers could be classified correctly in terms of the predicted outcome of the final exam. The higher percentage of correct decisions compared to the first DPA pilot is mainly attributable to the correctness of pass predictions. This finding could be explained by the nature of the DTS training program. Within this program the driver instructor collects a lot of information about the learner driver regarding the progress on script mastery, by means of specially designed progress cards. He does so over a relatively long period which lasts nearly five months on average. The instructor will only send his learner driver to the final exam once he has mastered all driving scripts and has passed the formative assessments. These drivers will receive DPA-scores above the cut-off which instructors (implicitly) use in their judgments. Looking back at the extrapolation inference, the quality of the external validation criterion used can be questioned. For purposes of initial driver training the pass/fail prediction is a sufficient criterion. For the instructor and the learner the growth towards exam preparedness is an important issue. However, DPA was also meant to inform drivers about their driving proficiency beyond the final exam, in the context of life-long learning. This would require an external criterion that relates to actual driving outcomes during the subsequent driving career, such as involvement in collisions and damage claims for one’s own and other vehicles. For now, it seems 489
  • 9. PROCEEDINGS of the Fifth International Driving Symposium on Human Factors in Driver Assessment, Training and Vehicle Design at least that the DPA is an appropriate tool to inform learner drivers about their progress towards their obtaining their driving license. References Brennan, R.L. (2000). Performance assessments from the perspective of generalizability theory. Applied Psychological Measurement, 24(4), 339-353. Cito (2008). Driver performance assessment. Scoring manual. Arnhem: Cito. Clauser, B. E. (2000). Recurrent issues and recent advances in scoring performance assessments. Applied psychological measurement, 24, 310-323. Dierick, S., & Dochy, F. (2001). New Lines in Edumetrics: New Forms of Assessment Lead to New Assessment Criteria. Studies in Educational Evaluation, 27(4), 307-329 Gregersen, N.P., & Bjurulf, P. (1996). Young novice drivers: towards a model of their accident involvement. Accident Analysis and Prevention 28, 229-241. Hatakka, M., Keskinen, E., Gregersen, N.P., Glad, A. & Hernetkoski, K. (2002) From control of the vehicle to personal self-control; broadening the perspectives to driver education. Transportation Research Part F, 5, 201-215. Kane, M.T. (2006). Validation. In Brennen, R.L. (Ed.), Education Measurement (4th ed.). Westport: PraegerPublishers. Maycock, G., Lockwood, C.R. & Lester, J.F. (1991) The accident liability of car drivers. Report 315. Crowthorne, Transport Research Laboratory. Messick, S. (1996). Validity in performance assessments. In G.W.Phillips (ed.), Technical issues in large-scale performance assessments. Washington DC: National Center for Education Statistics. Nägele, R.C & Vissers, J.A.M.M. (2003) Rijopleiding in Stappen (RIS). Evaluatie van de vervolgproef in de provincie Gelderland 2002-2003. ‘Driver Training Stepwise (DTS). [Evaluation of the follow-up in the province of Gelderland]. Veenendaal, Traffic Test. Sagberg, F. (1998) Month-by-month changes in accident risk among novice drivers. Paper presented at the 24th International Congress of Applied Psychology. San Francisco, August. Vissers, J.A.M.M. (2004) Testing and teaching of the higher order skills of the GDE-matrix. CIECA-congress, Warsaw. Vissers, J.A.M.M., Van Betuw, A.M., Nägele, R.C., Kooistra, A. & Harteveld, M. (2007) Learning goals for lifelong road safety education. Amersfoort: DHV. 490