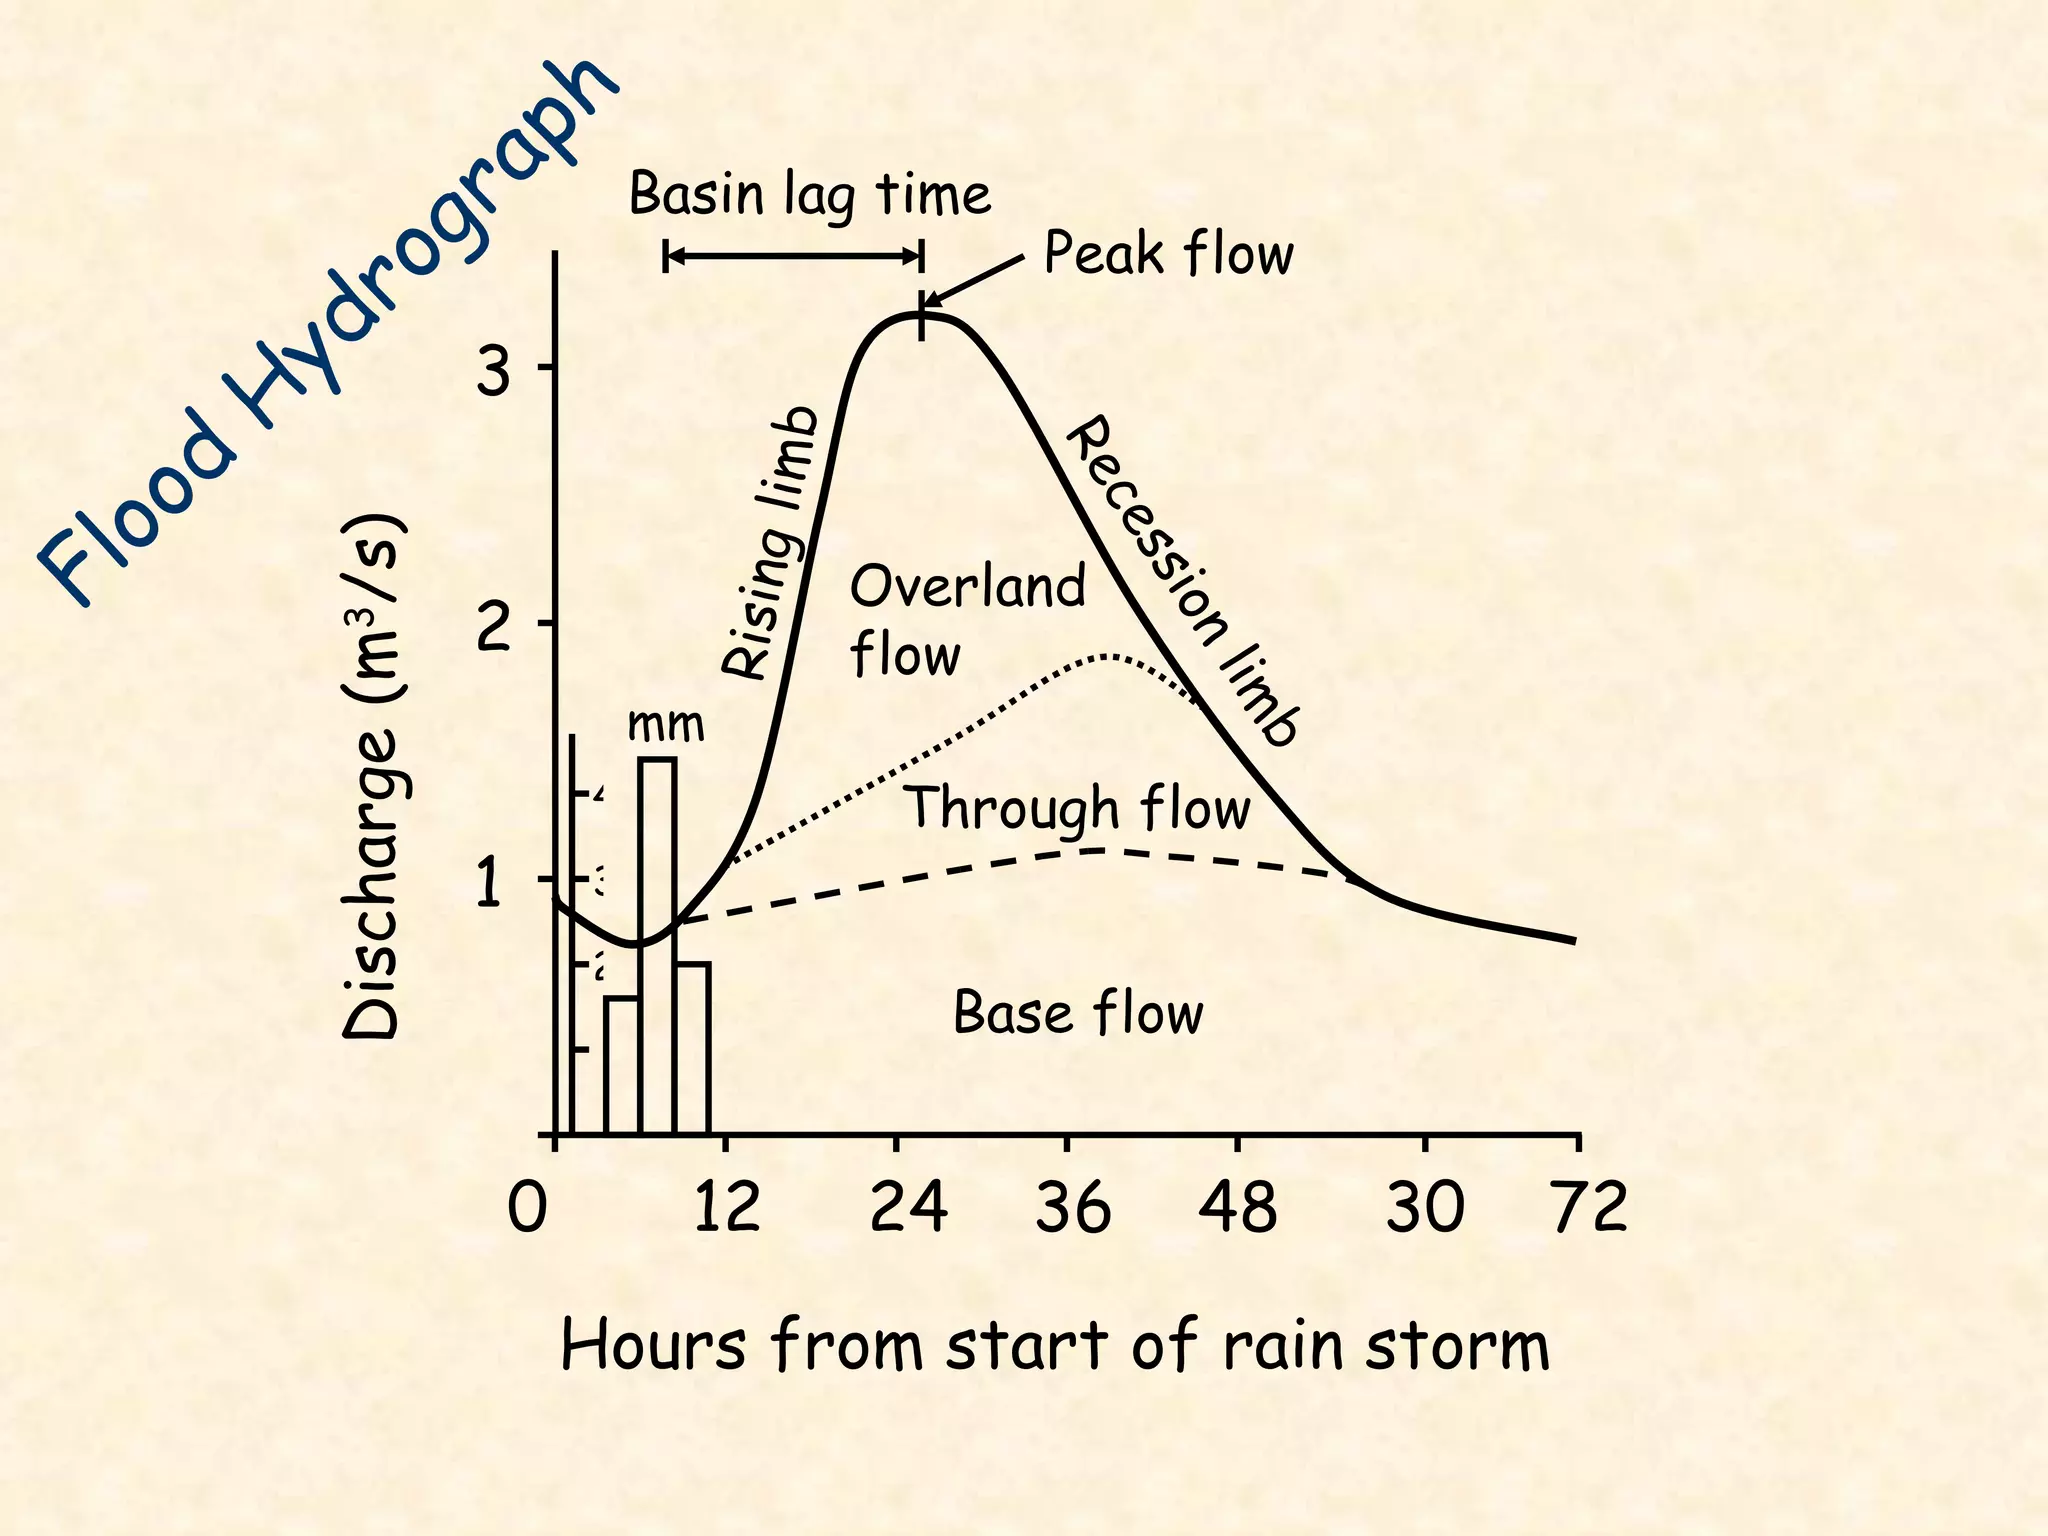
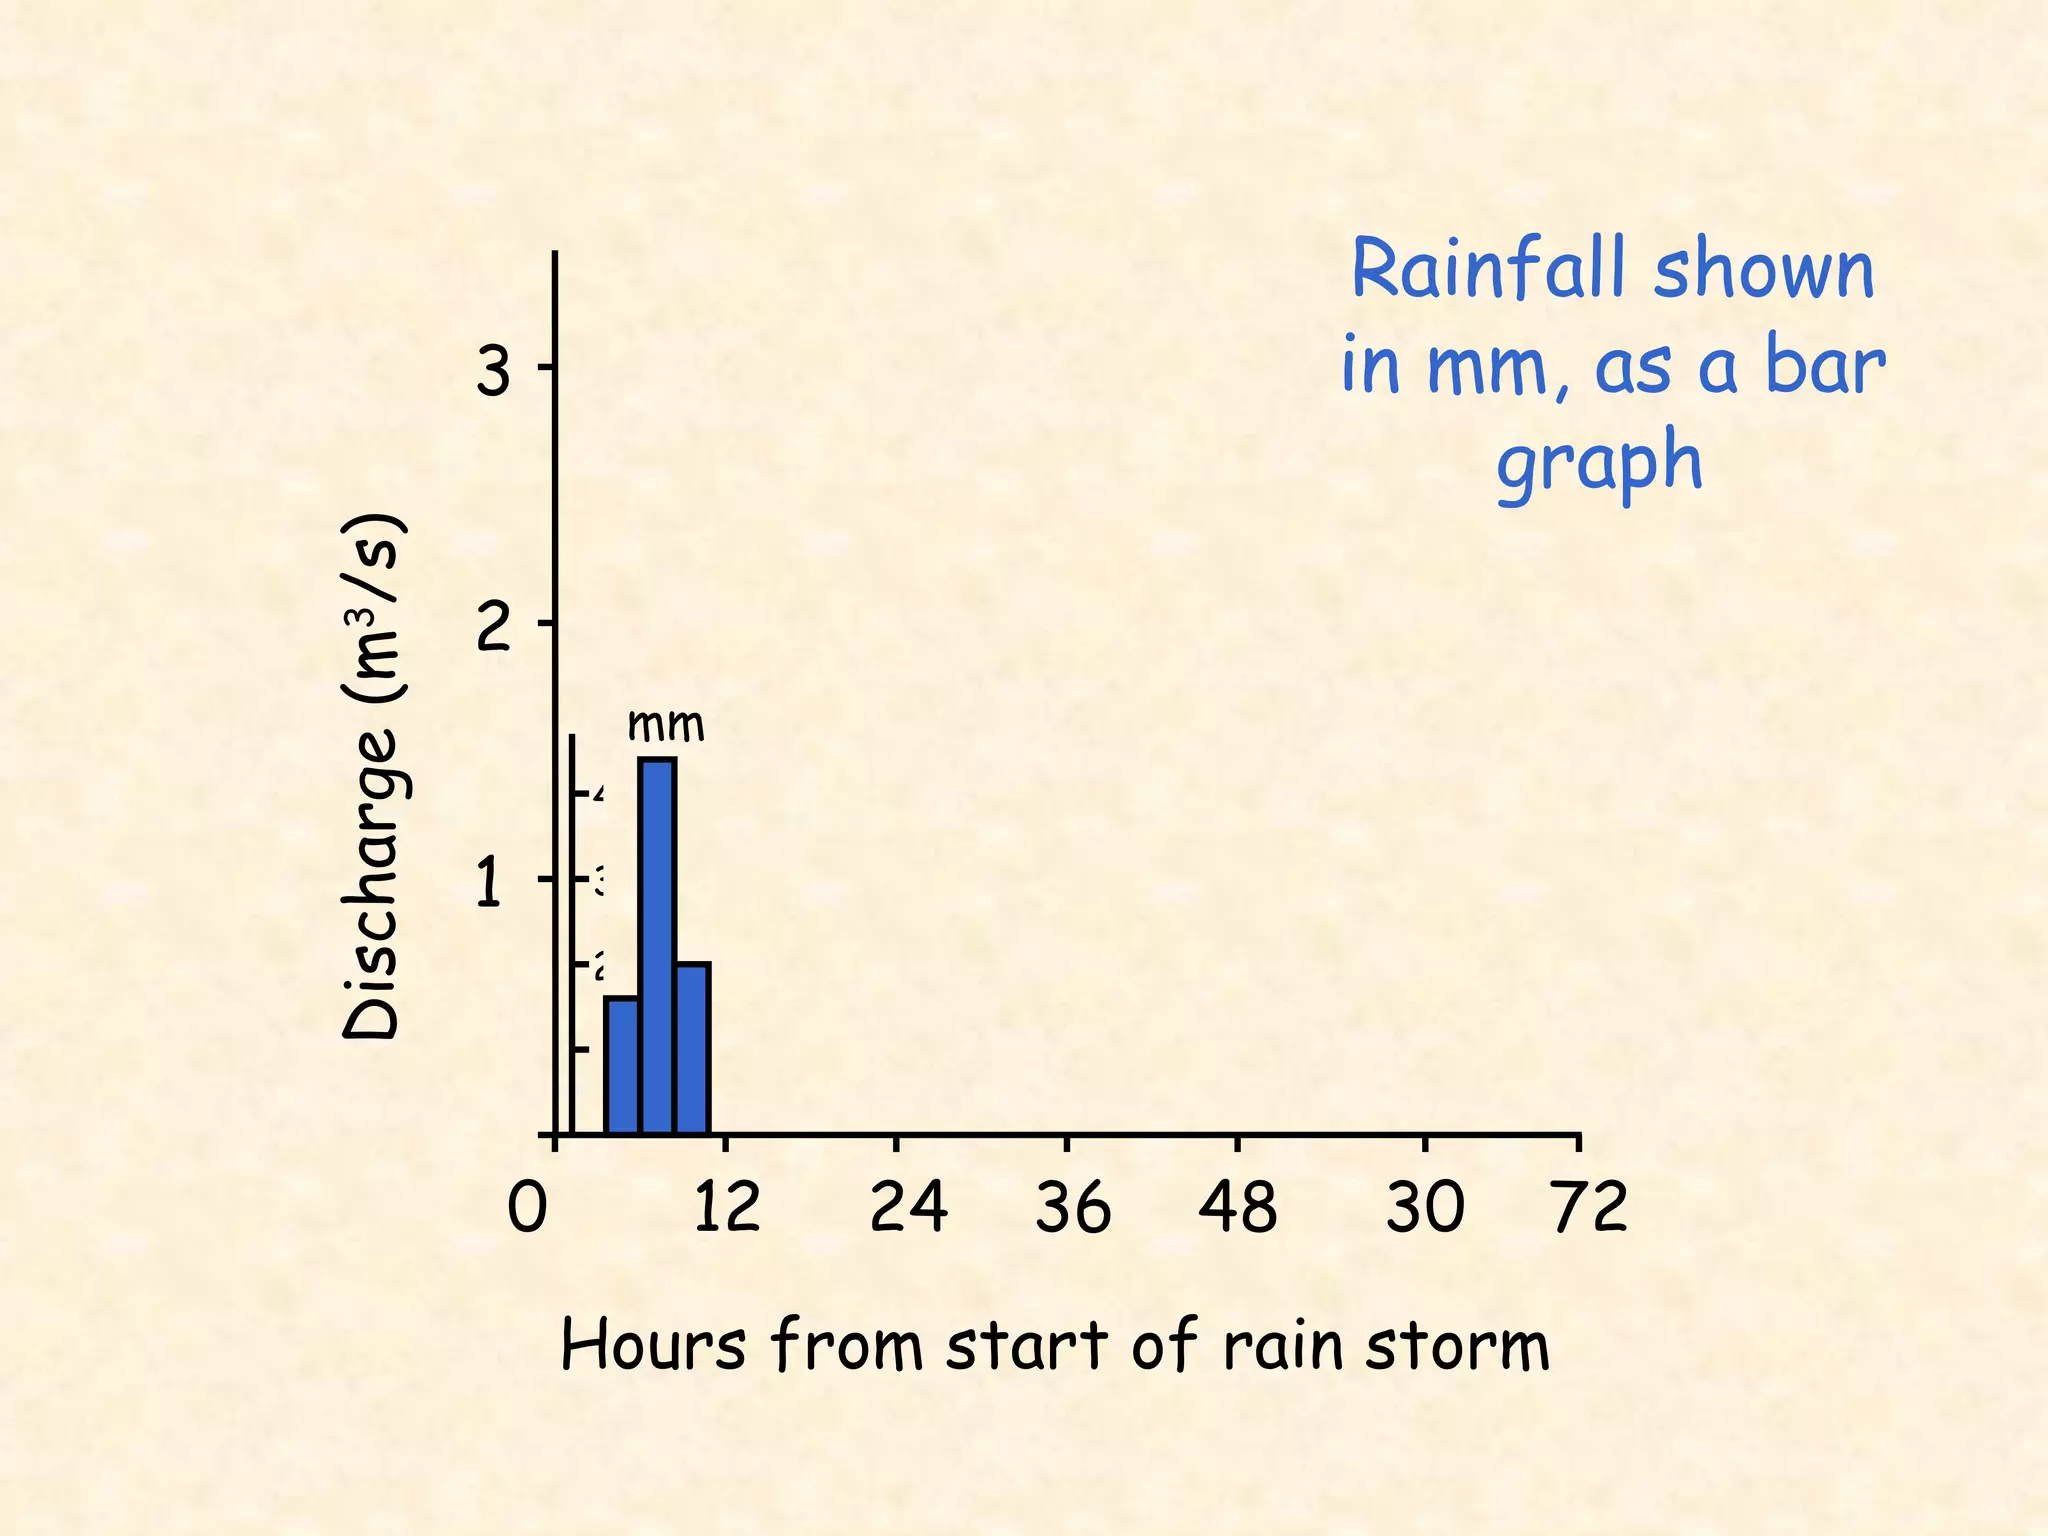
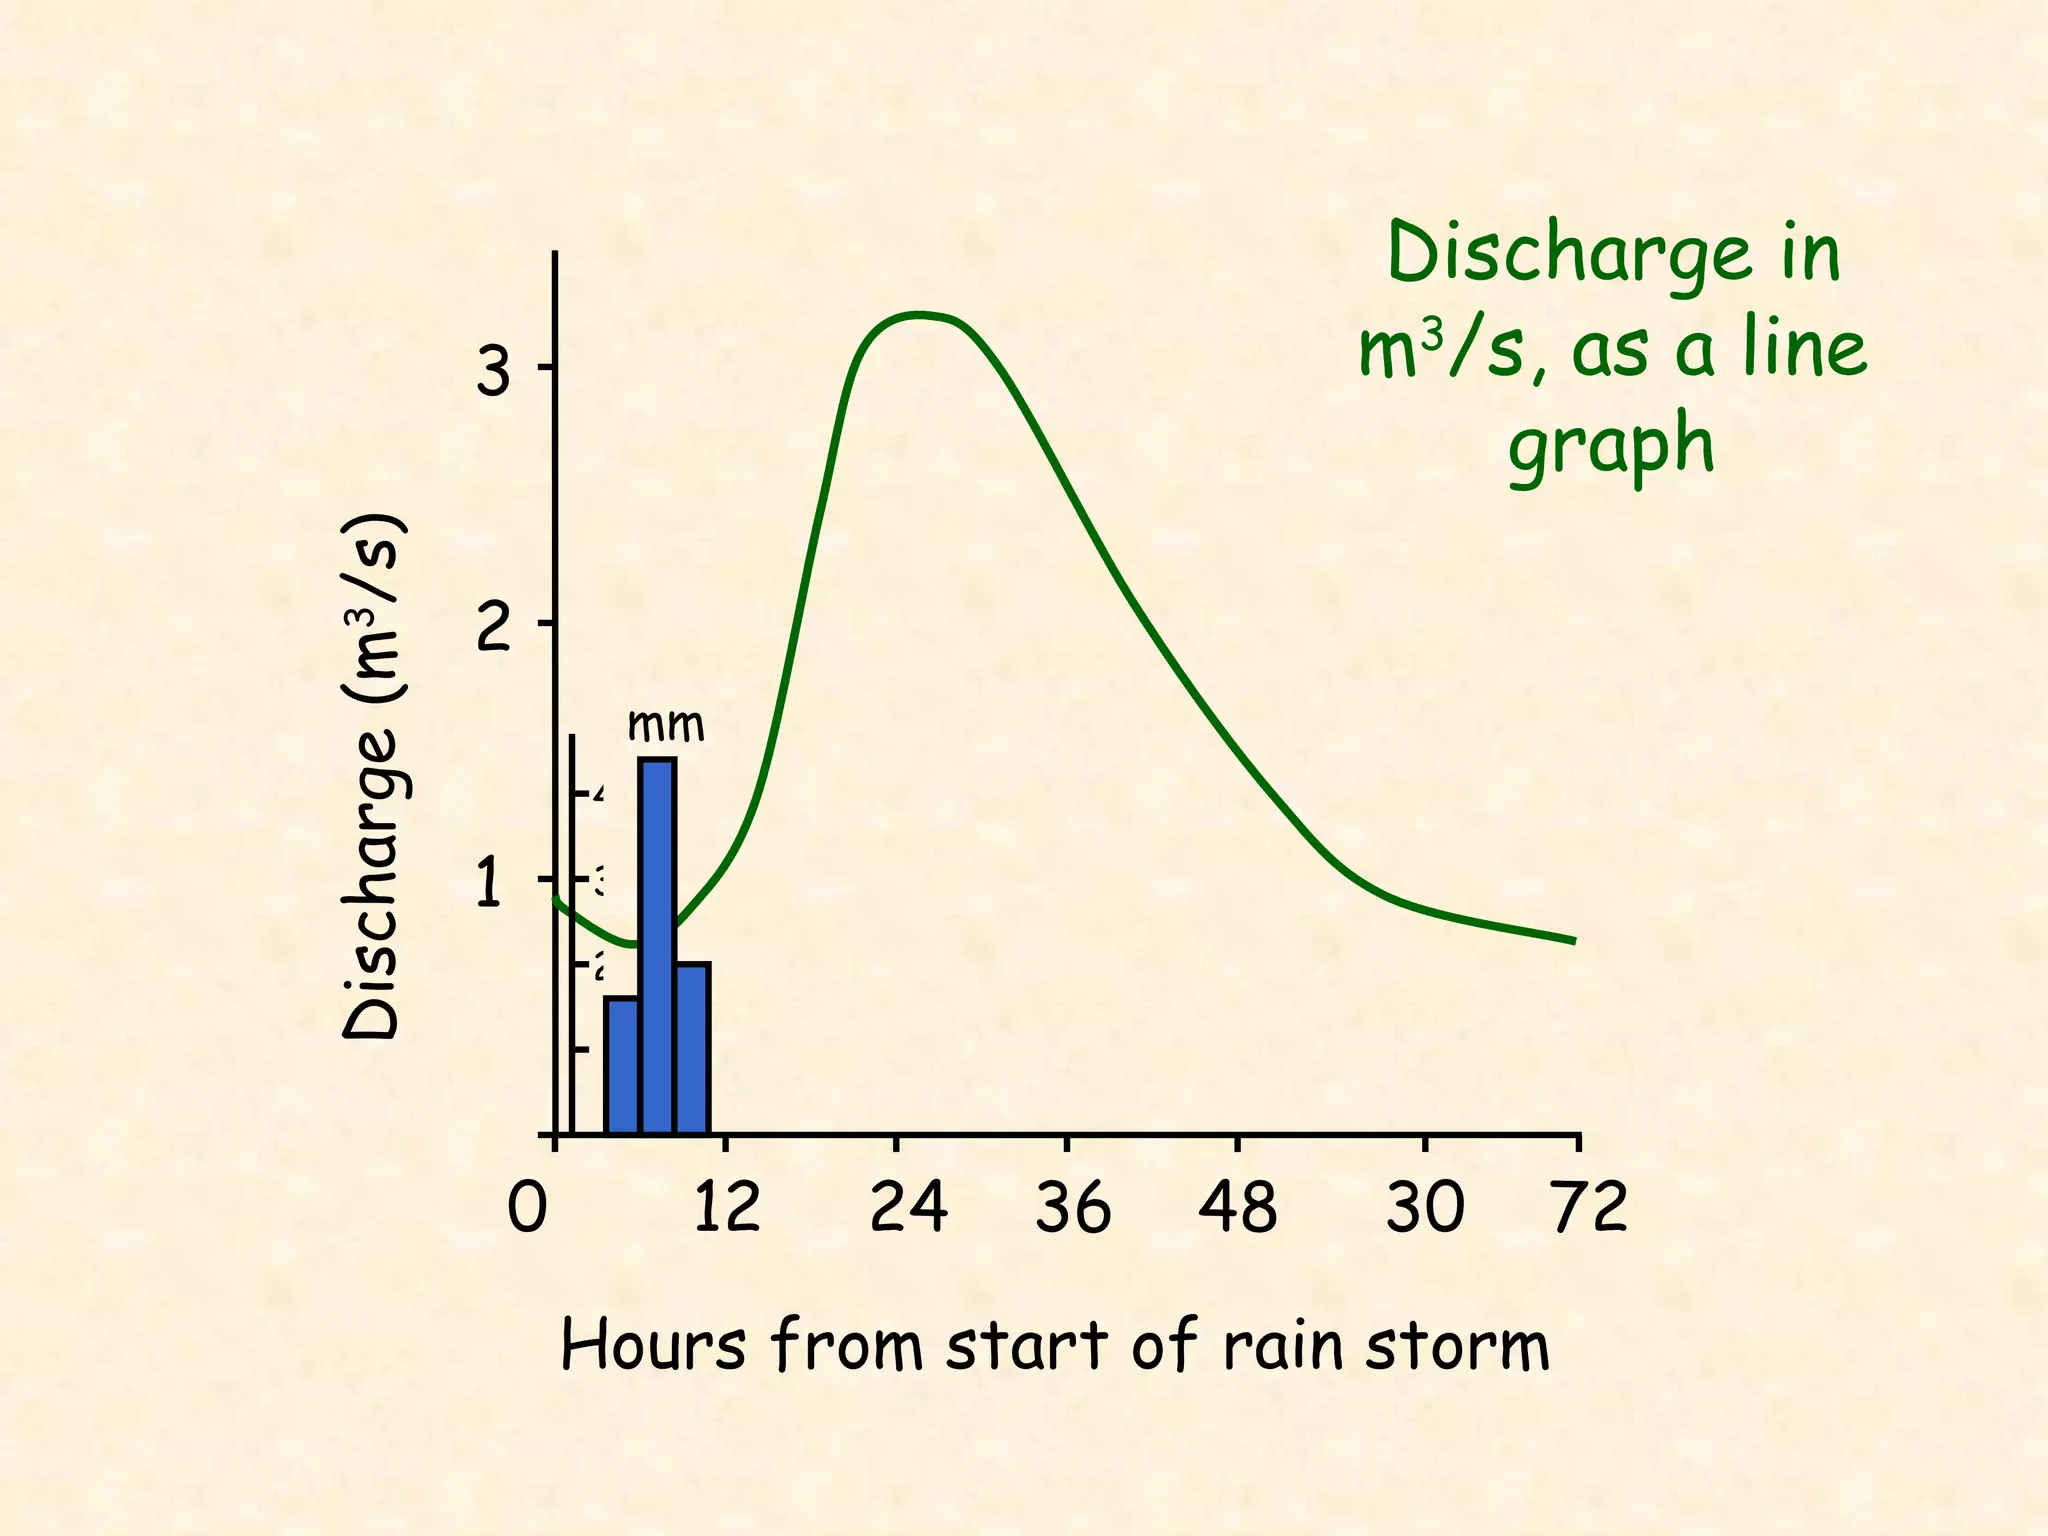
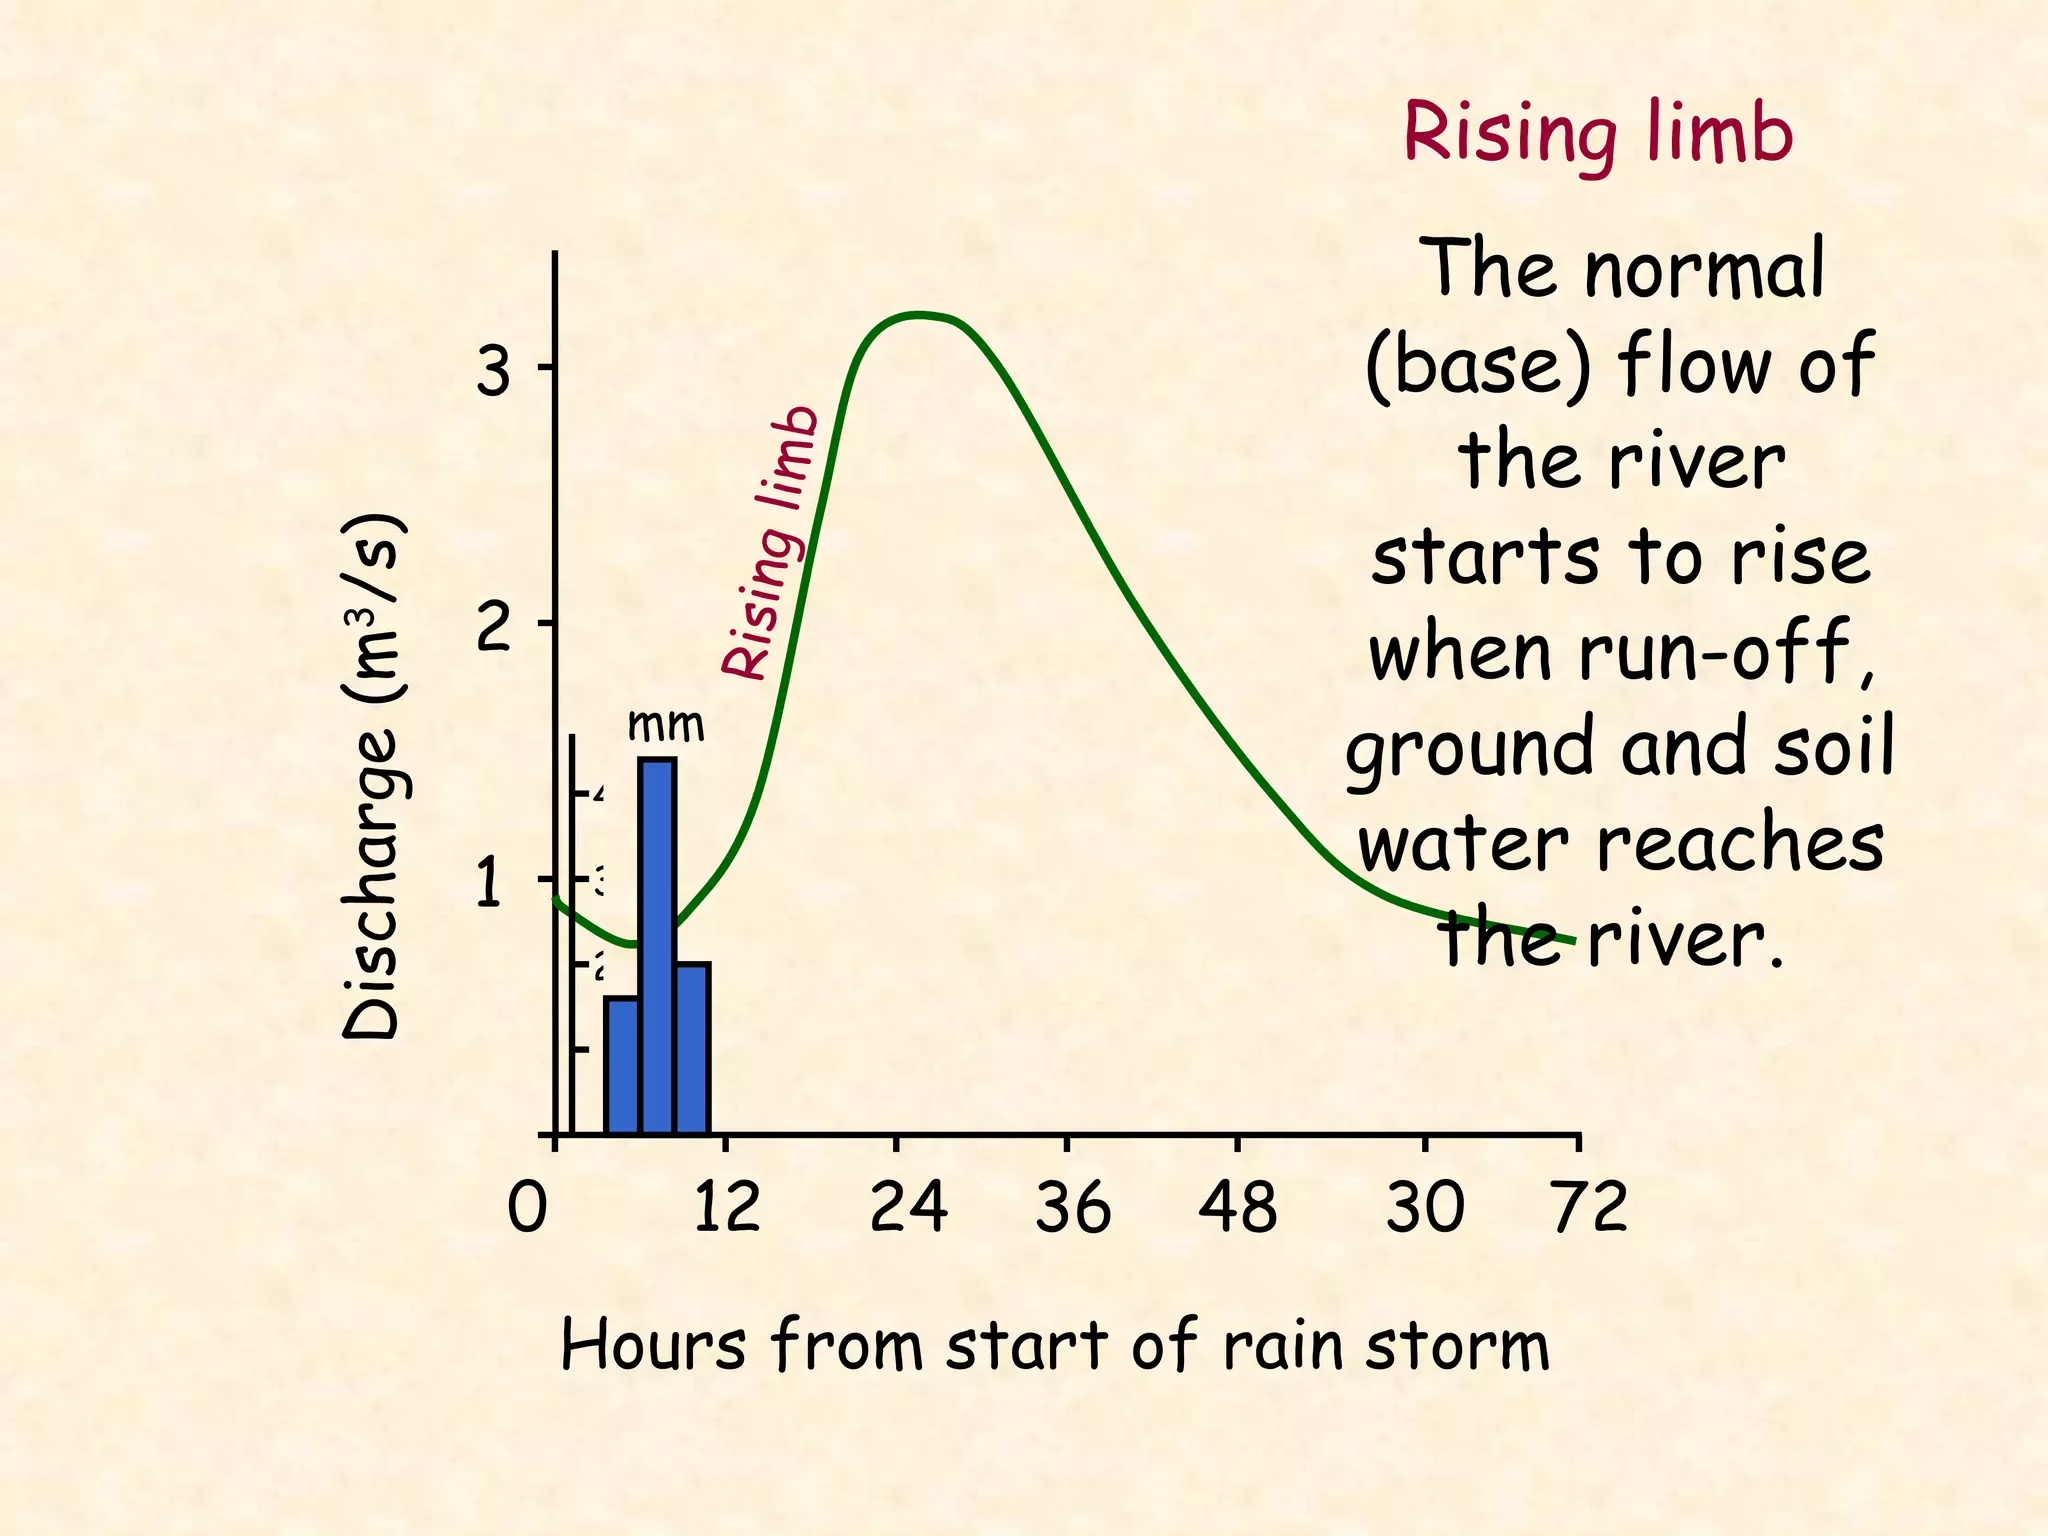
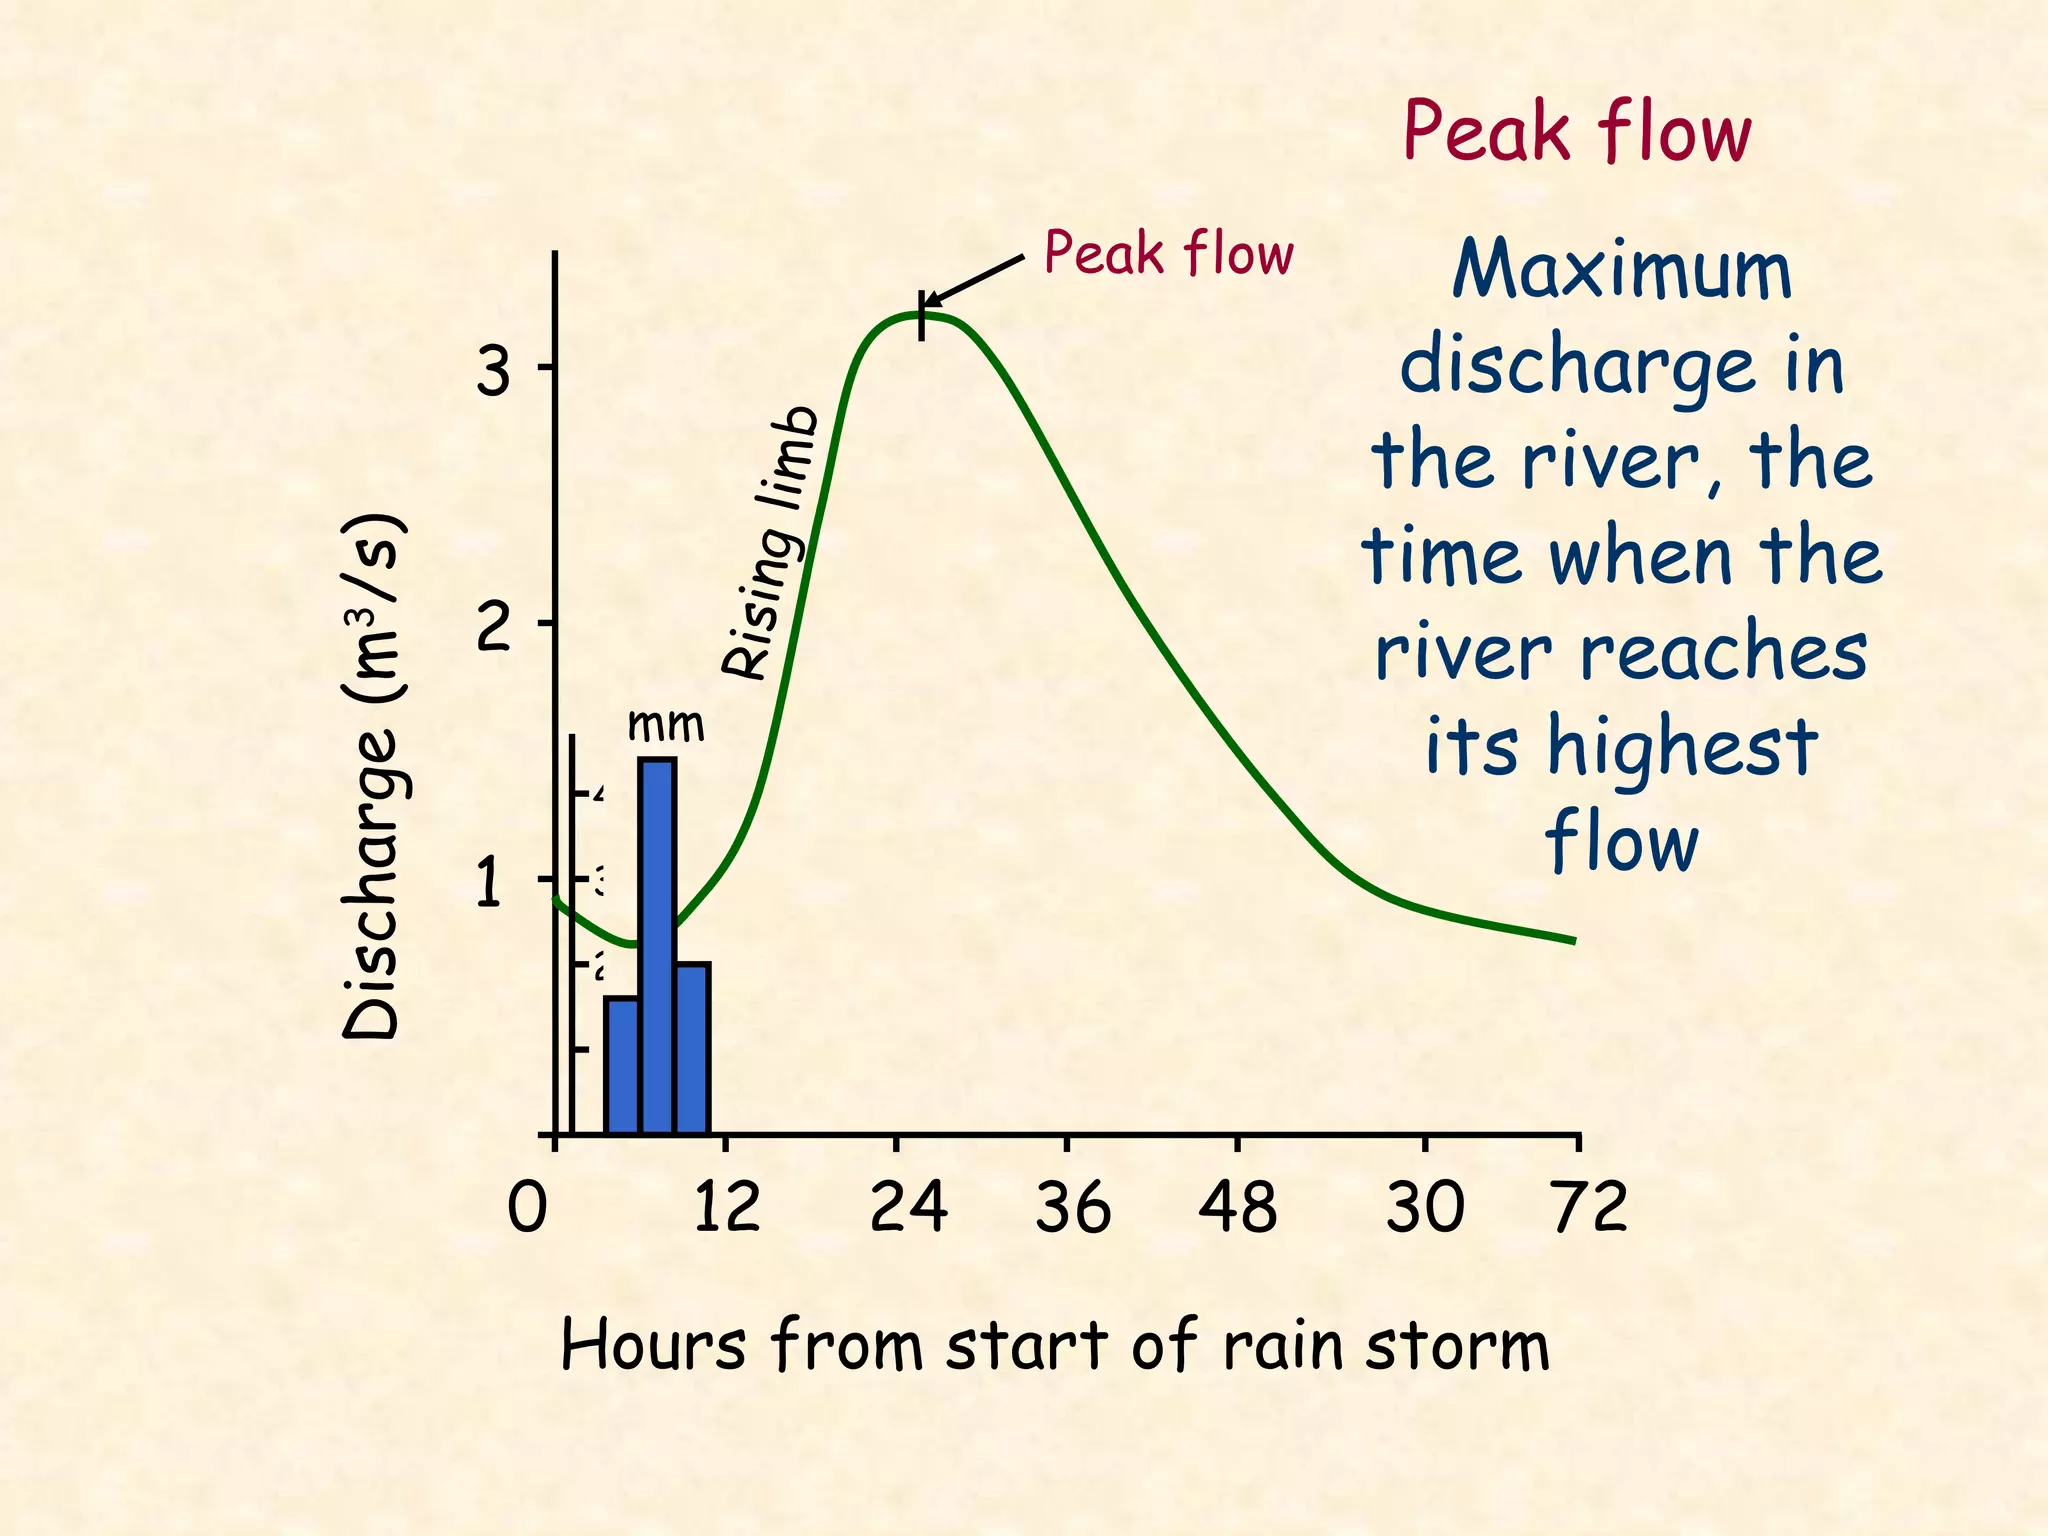
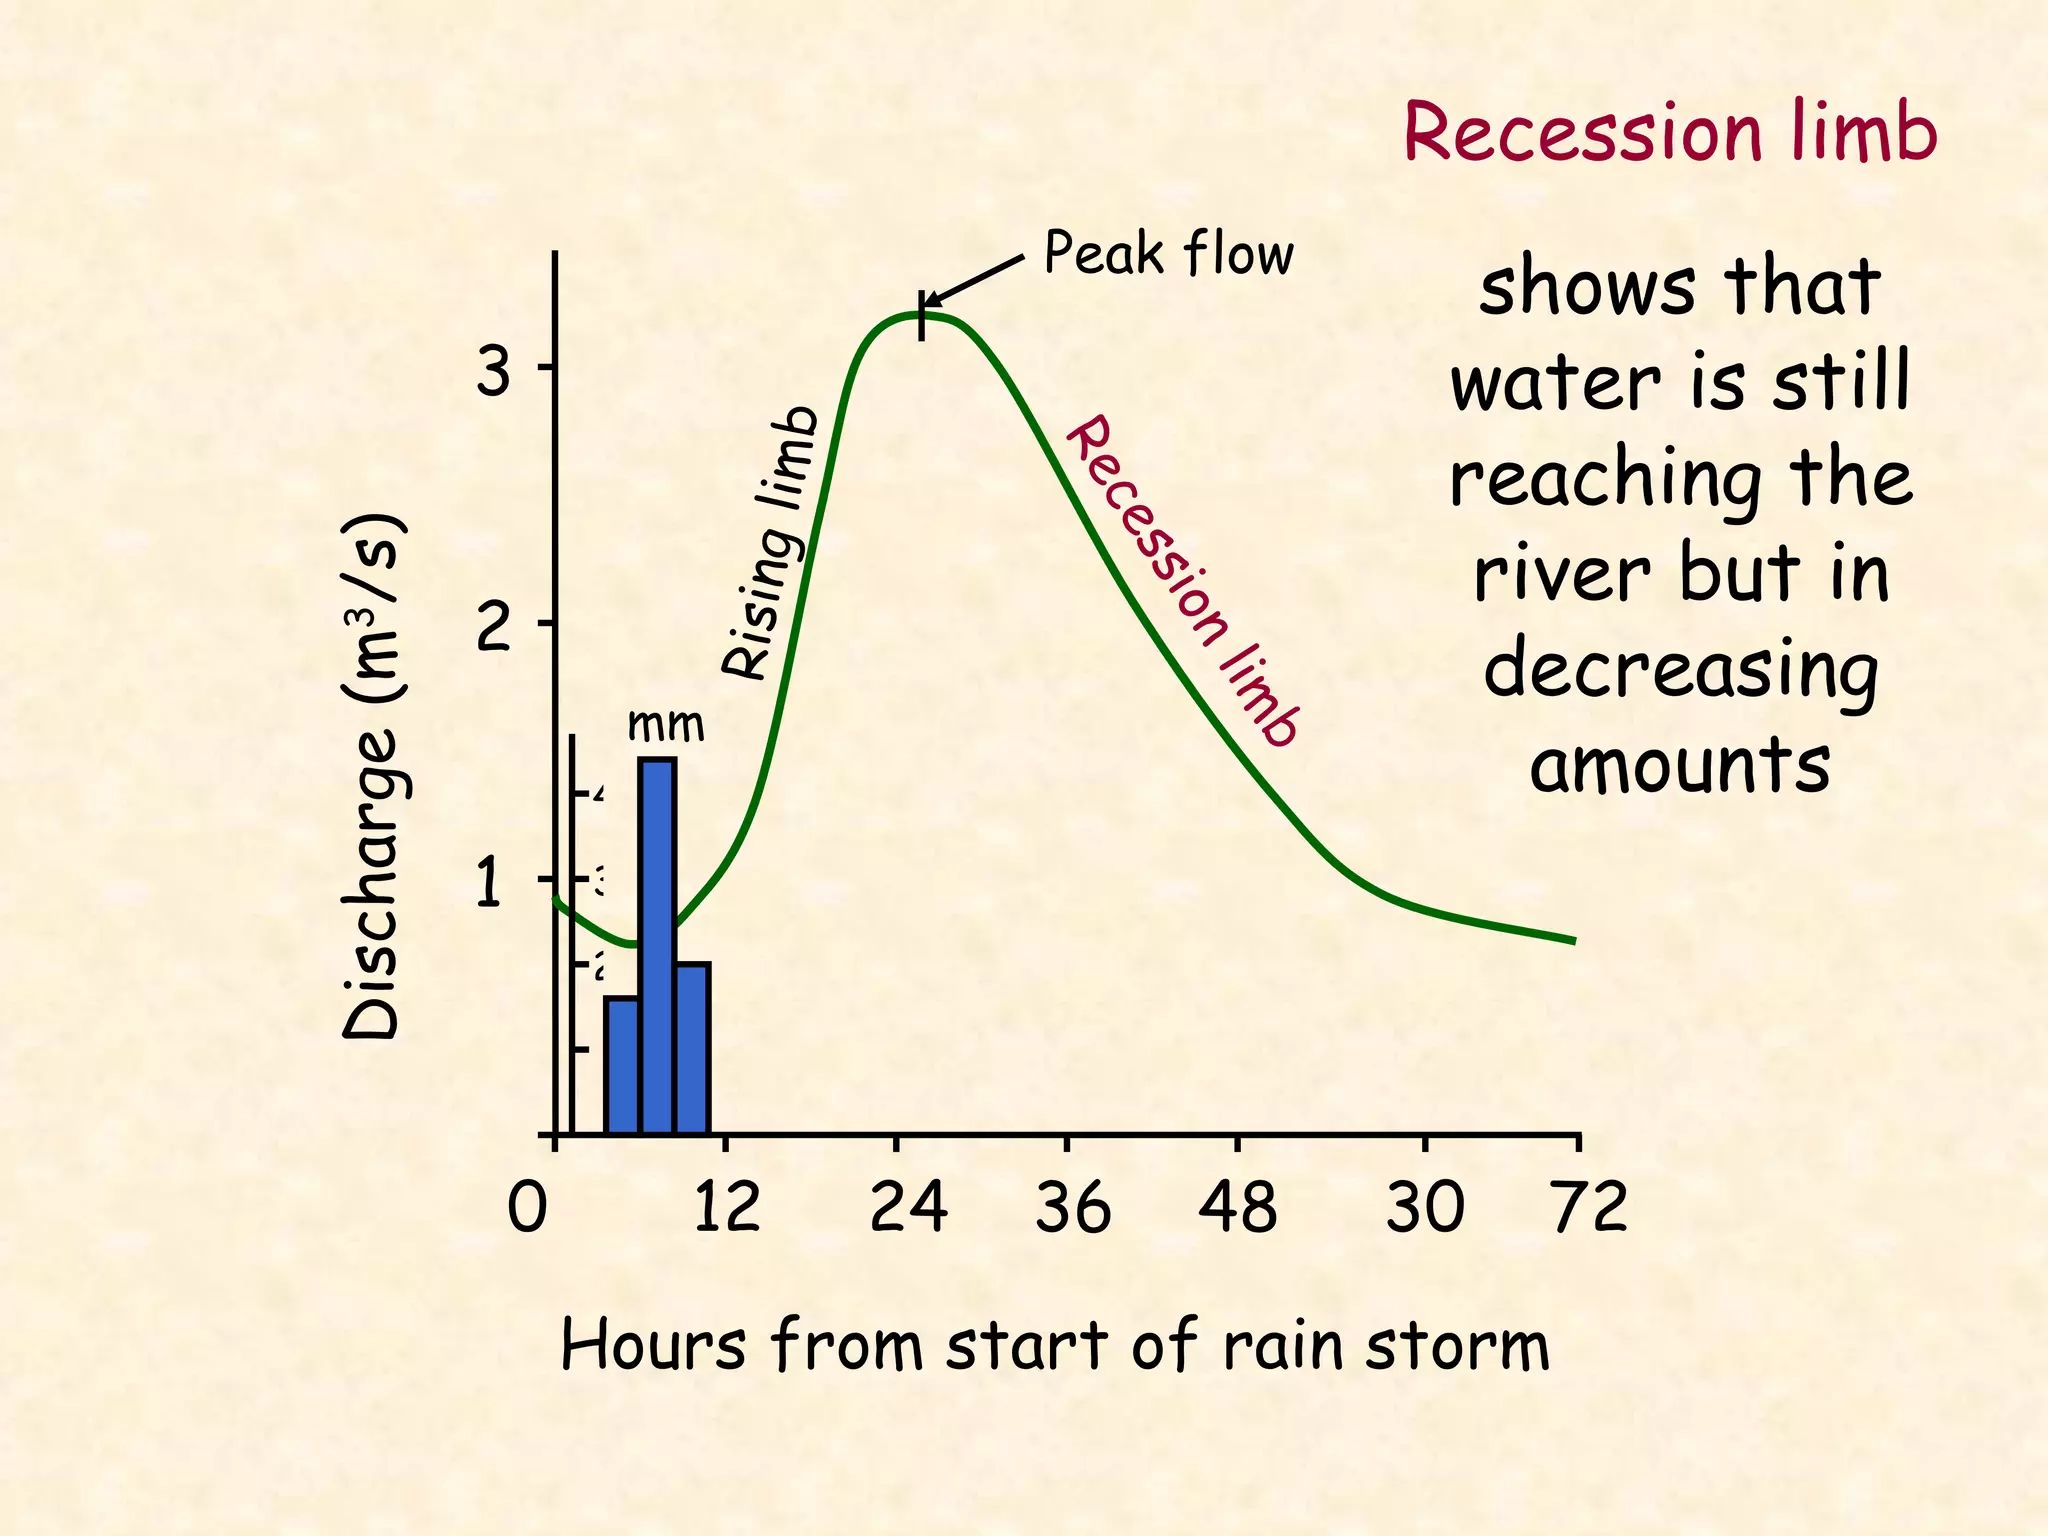
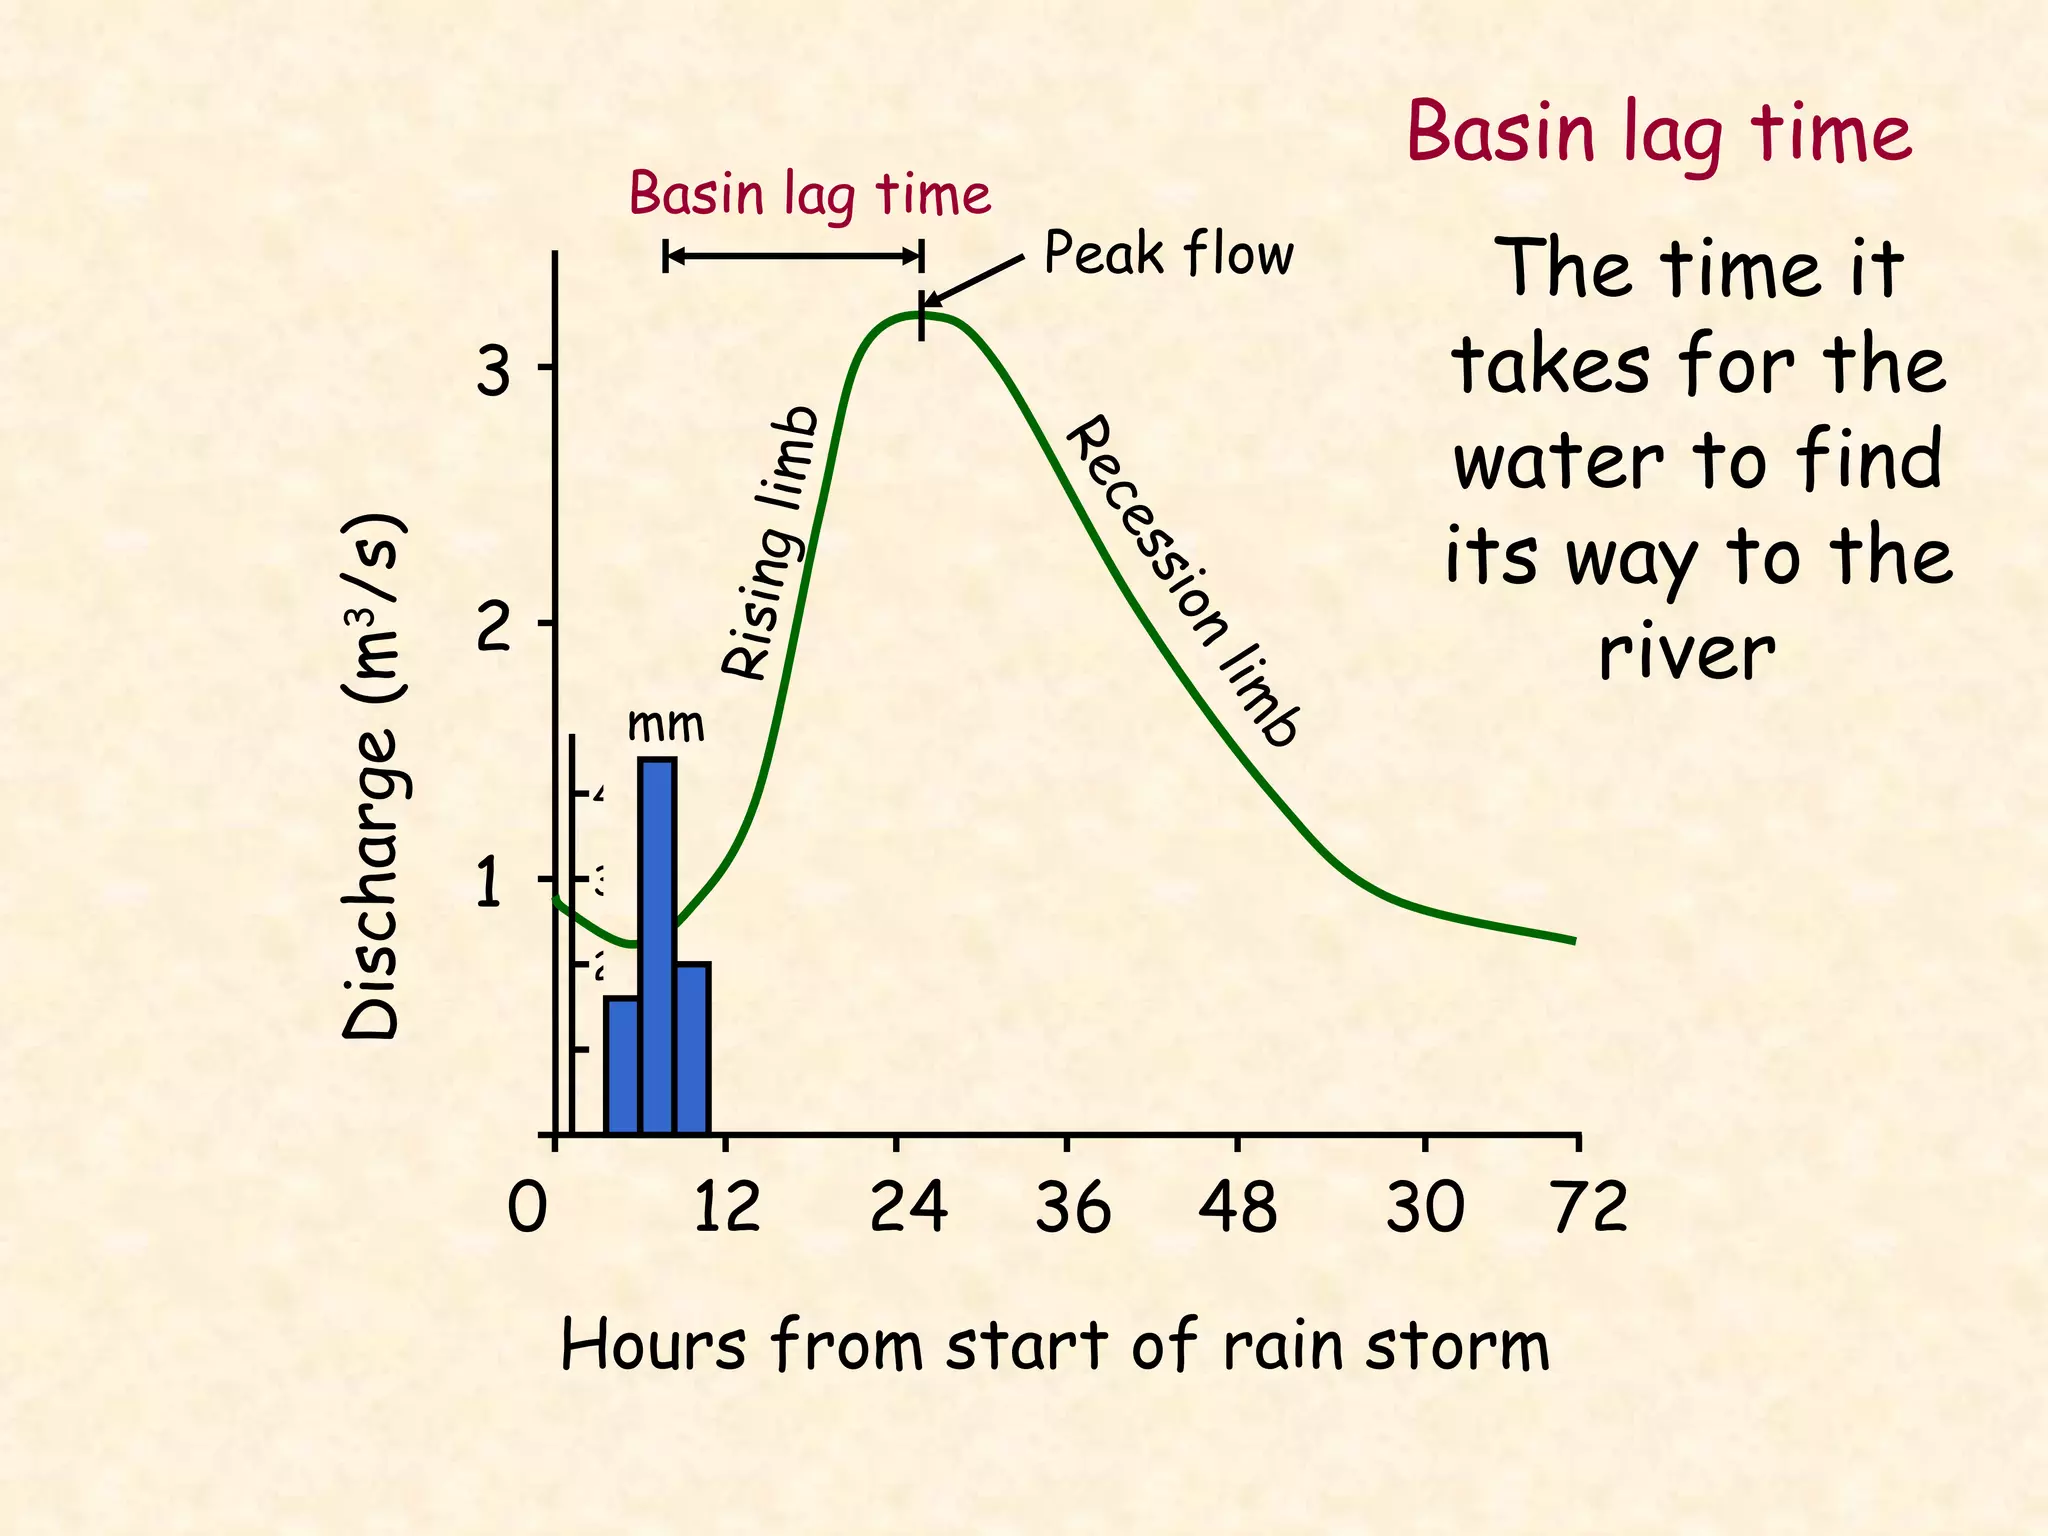
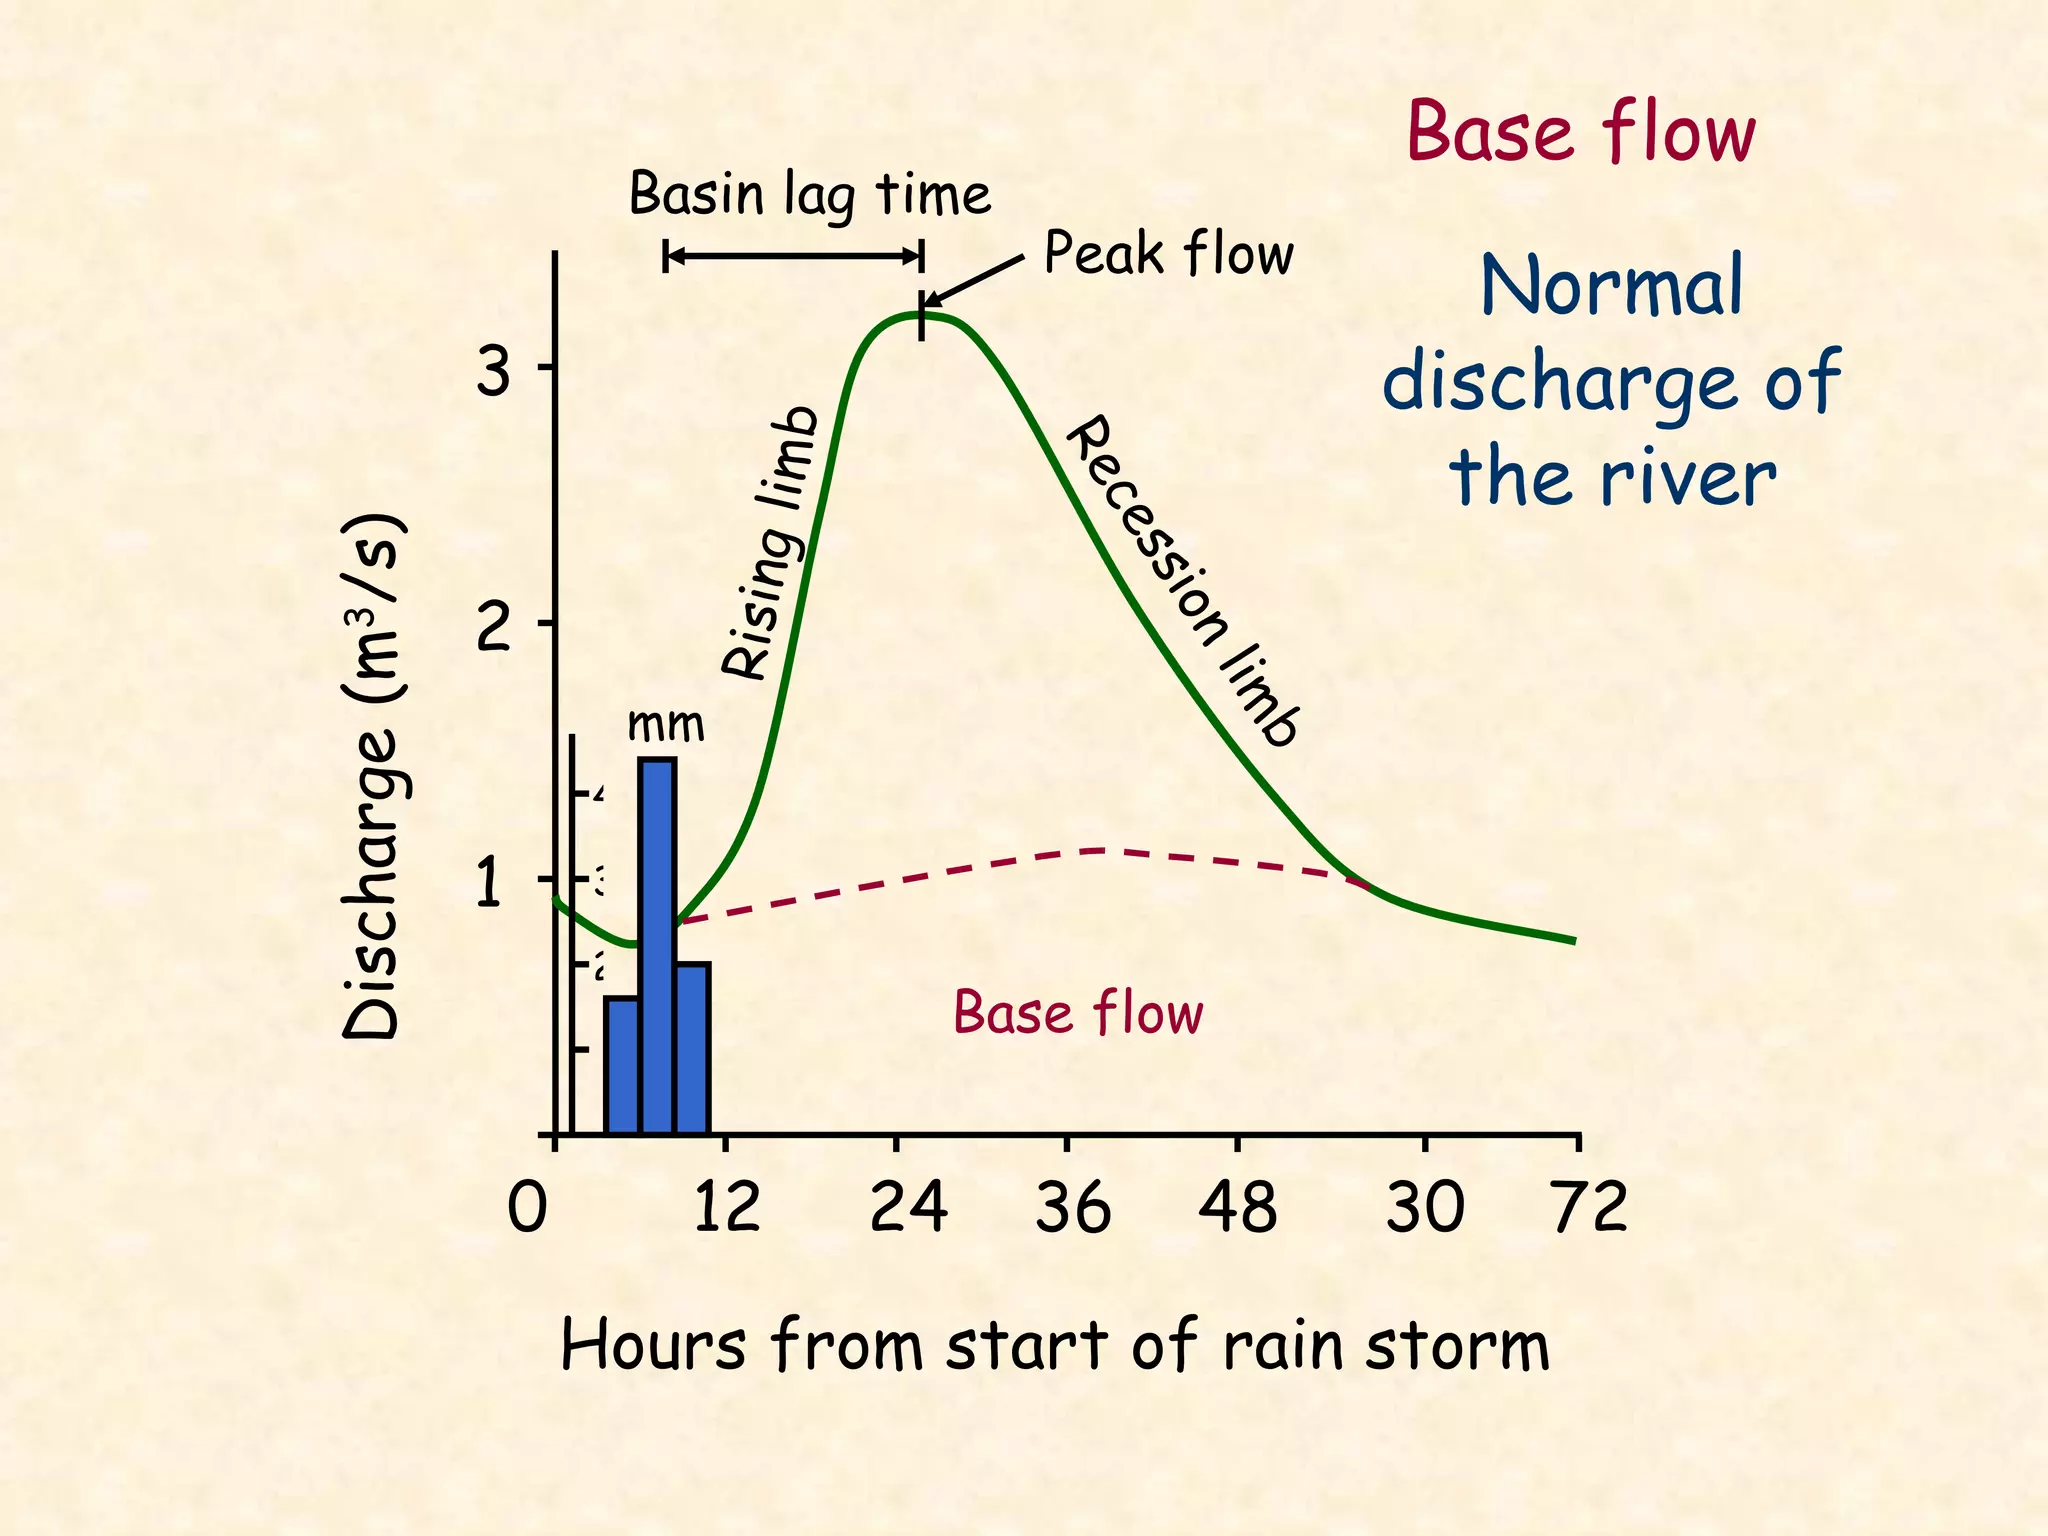
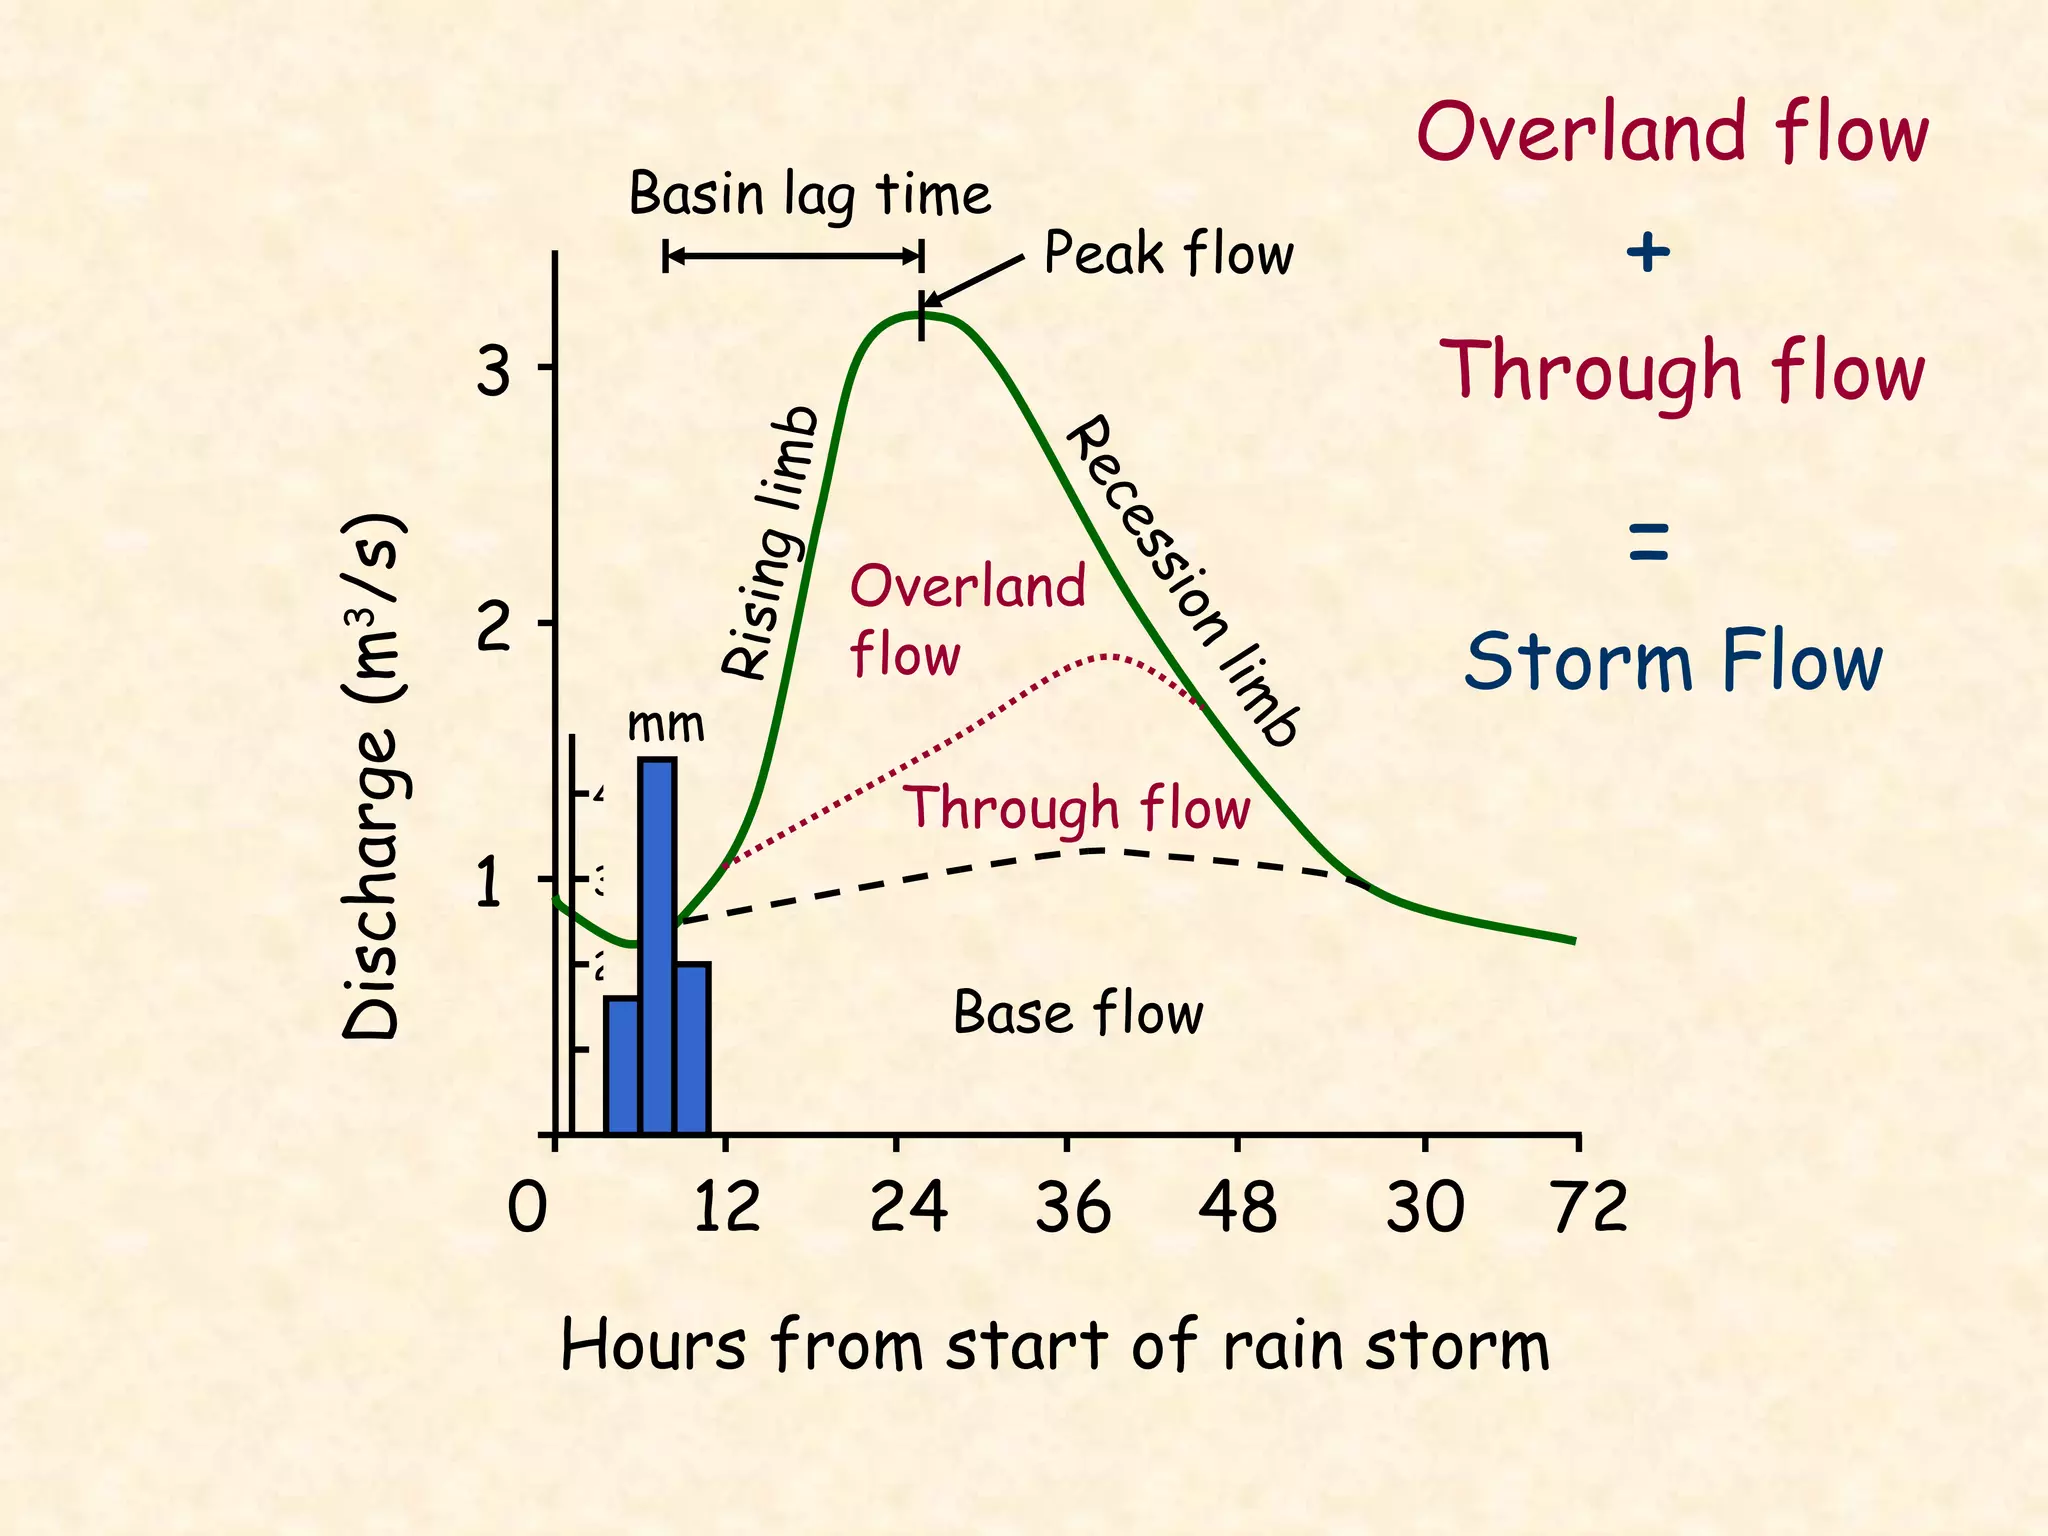
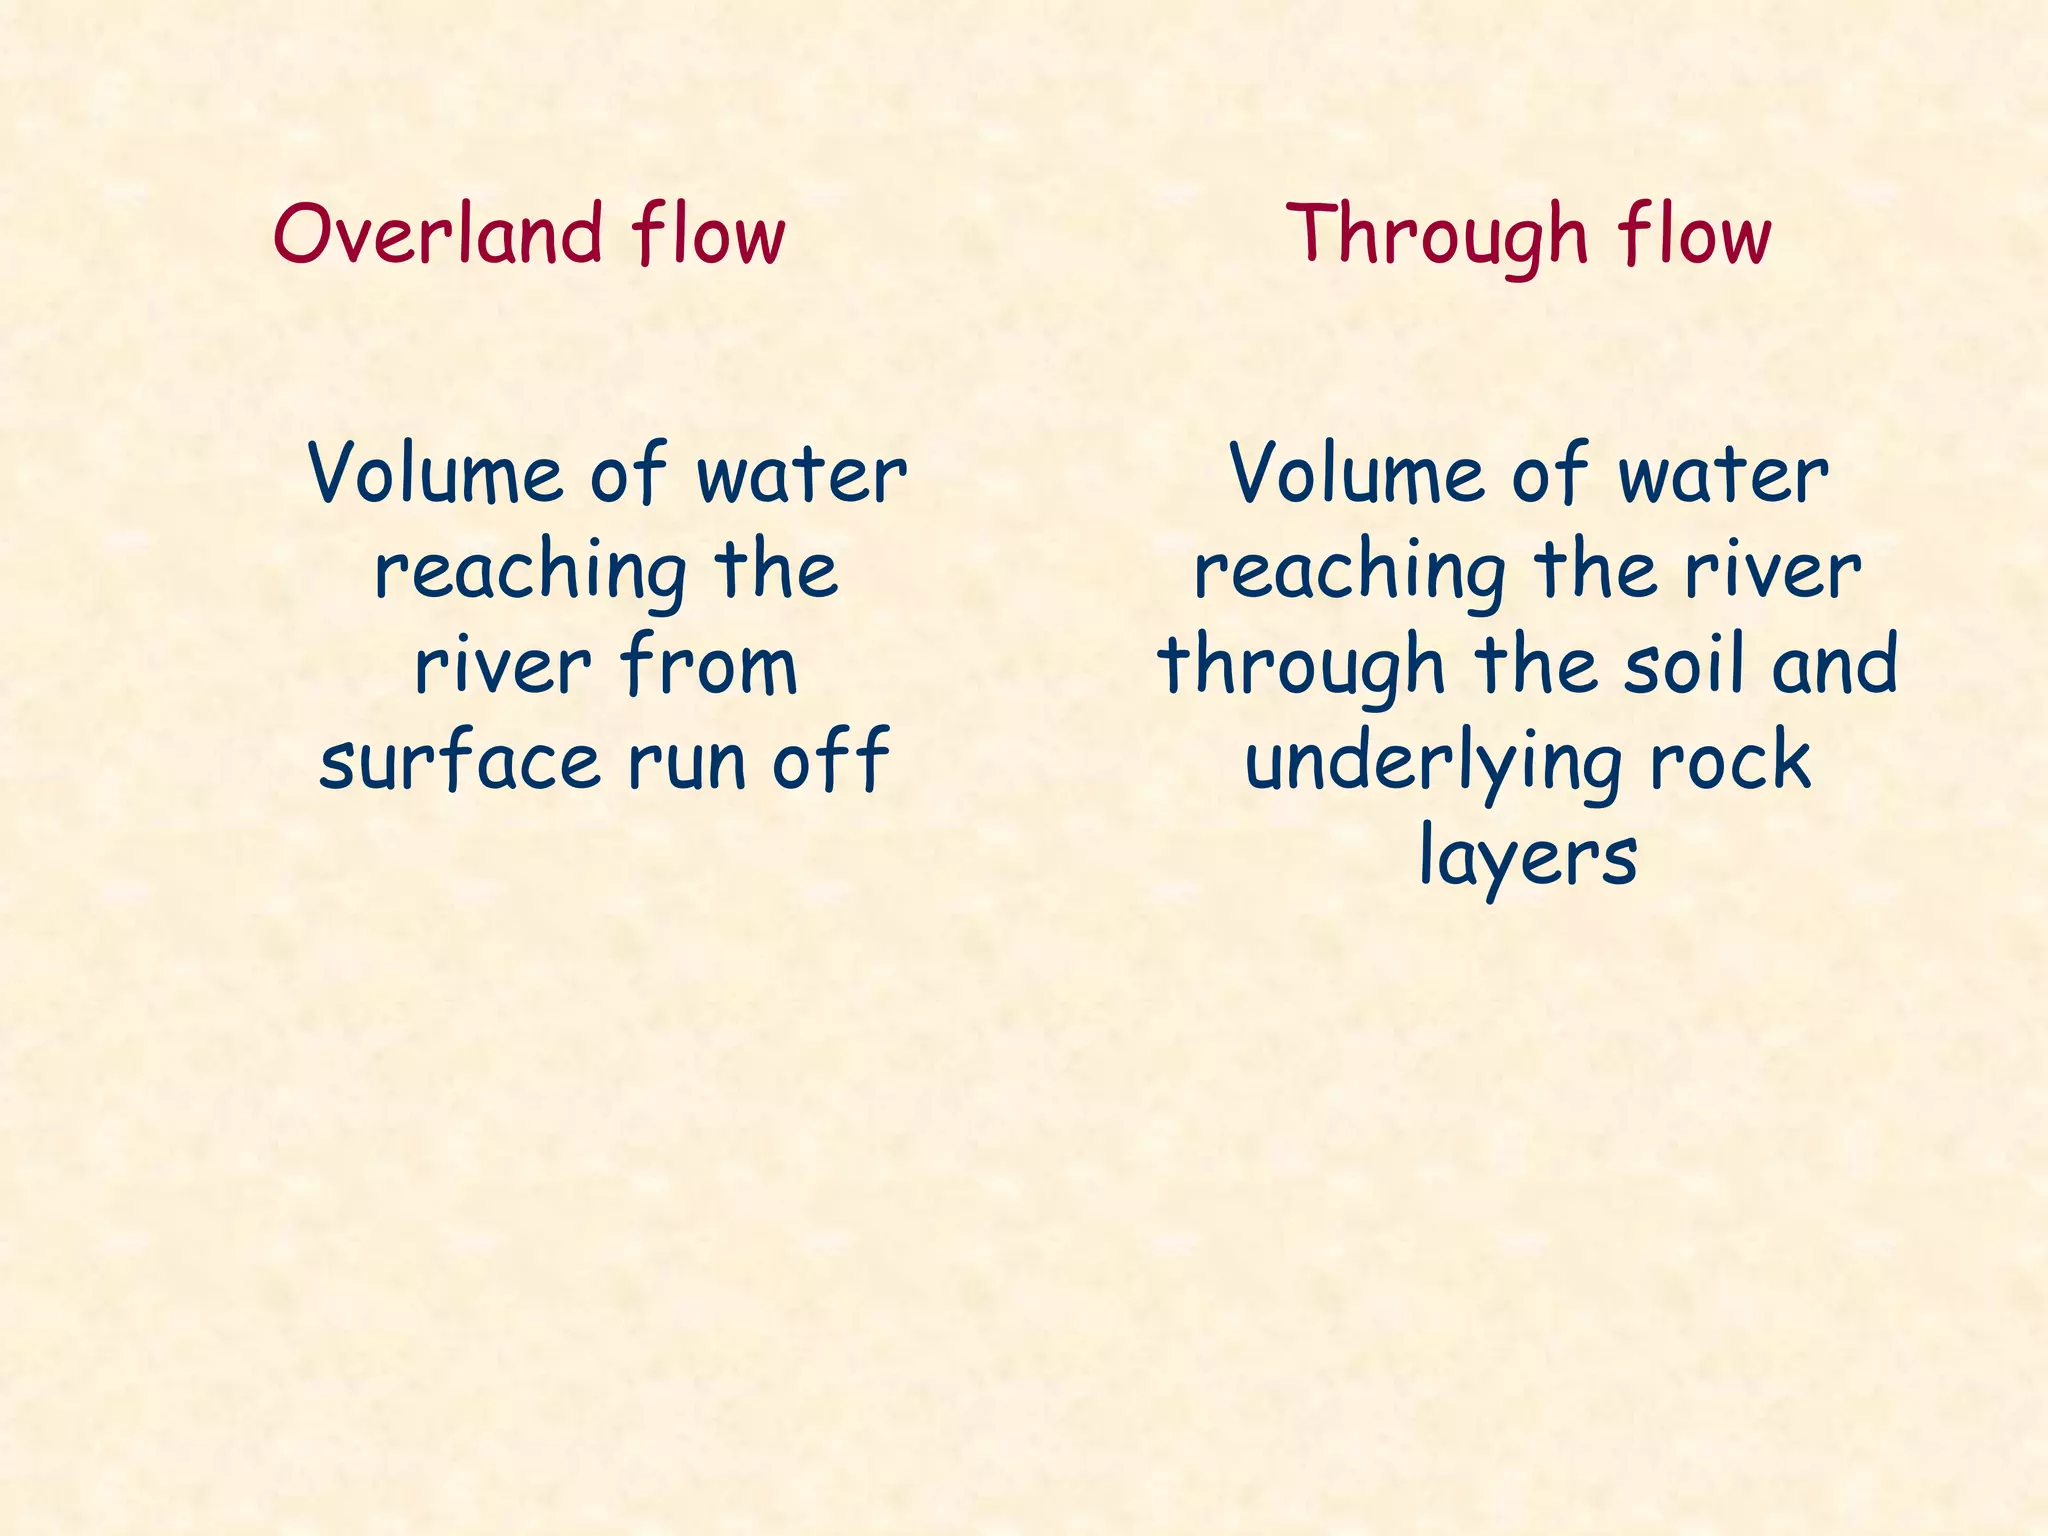
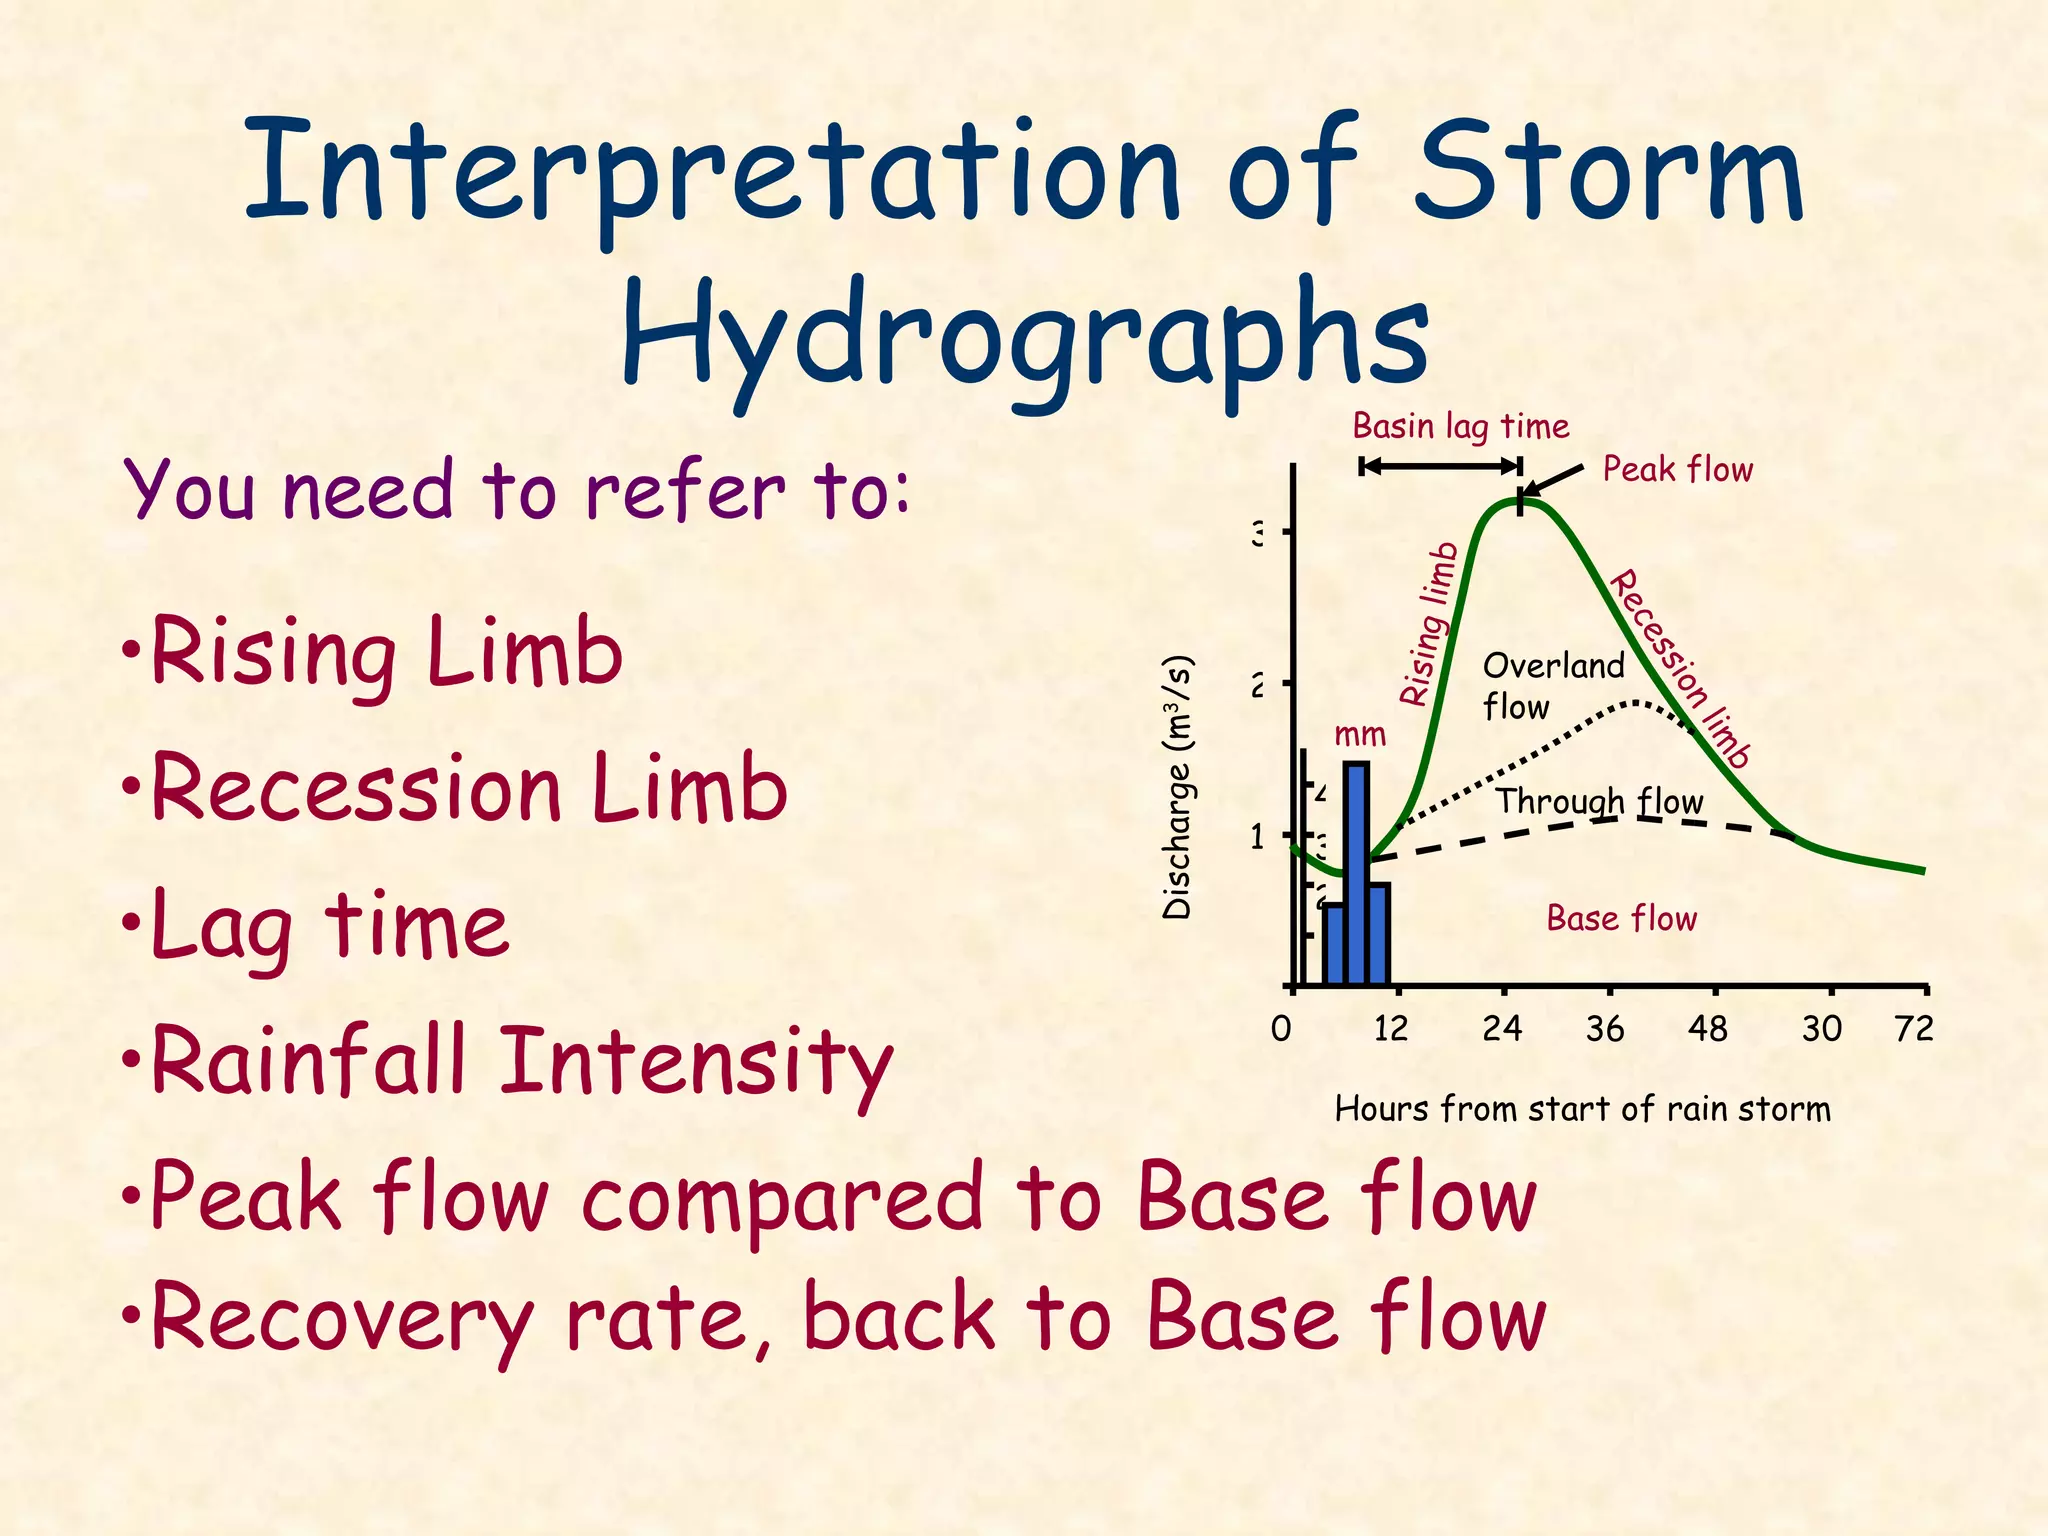
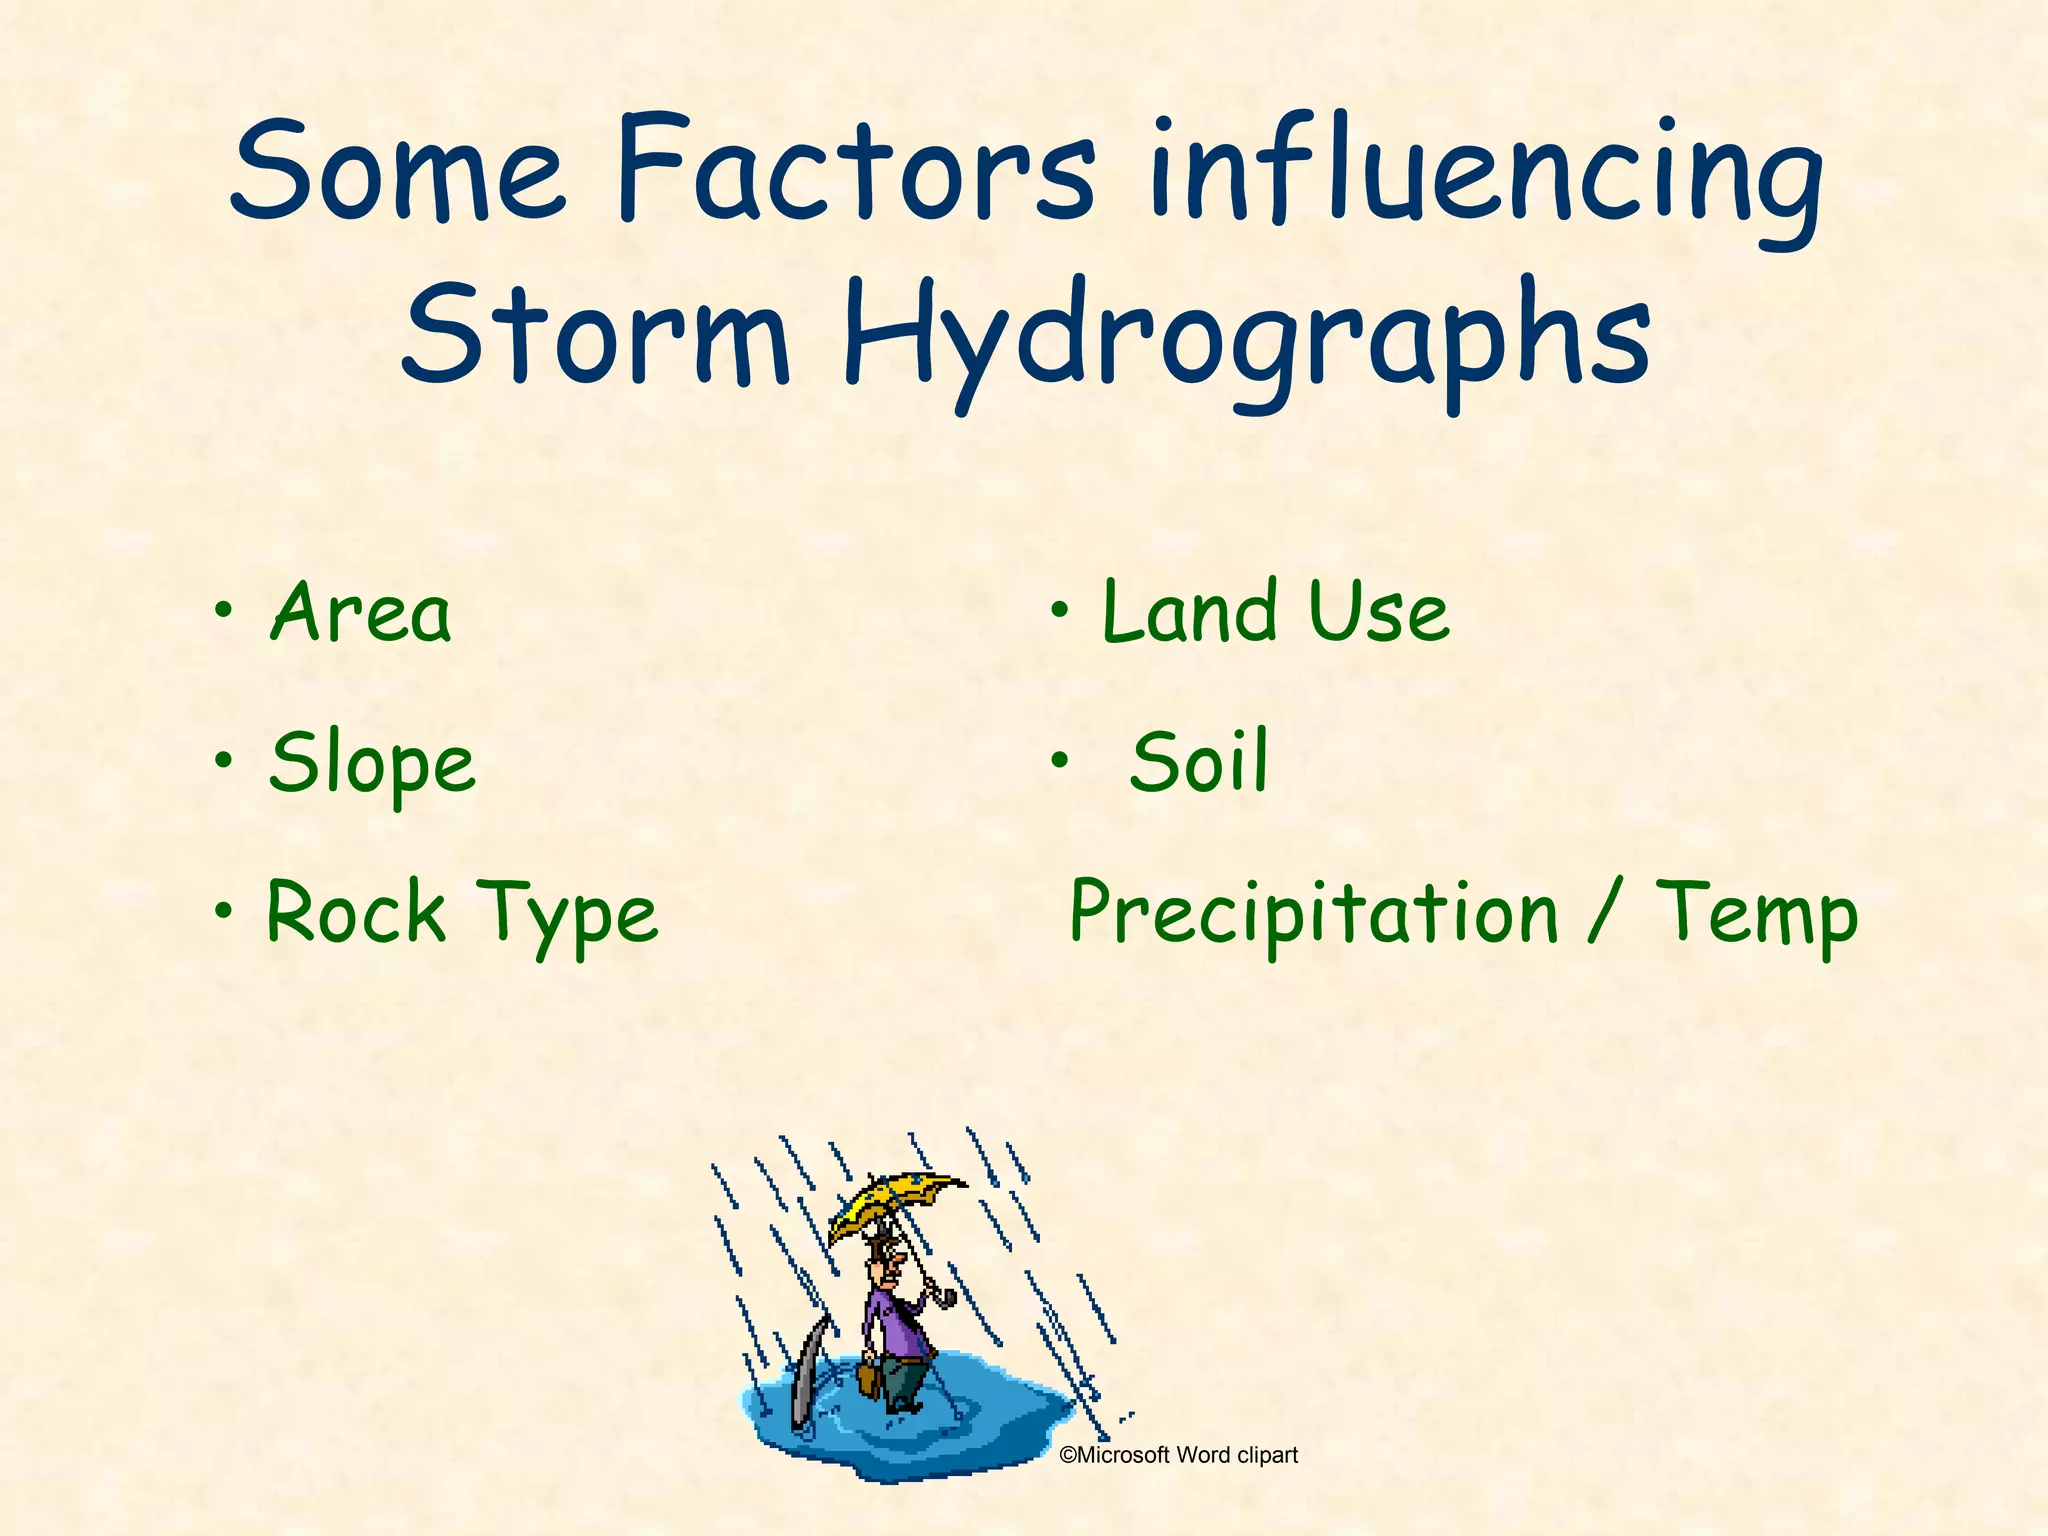
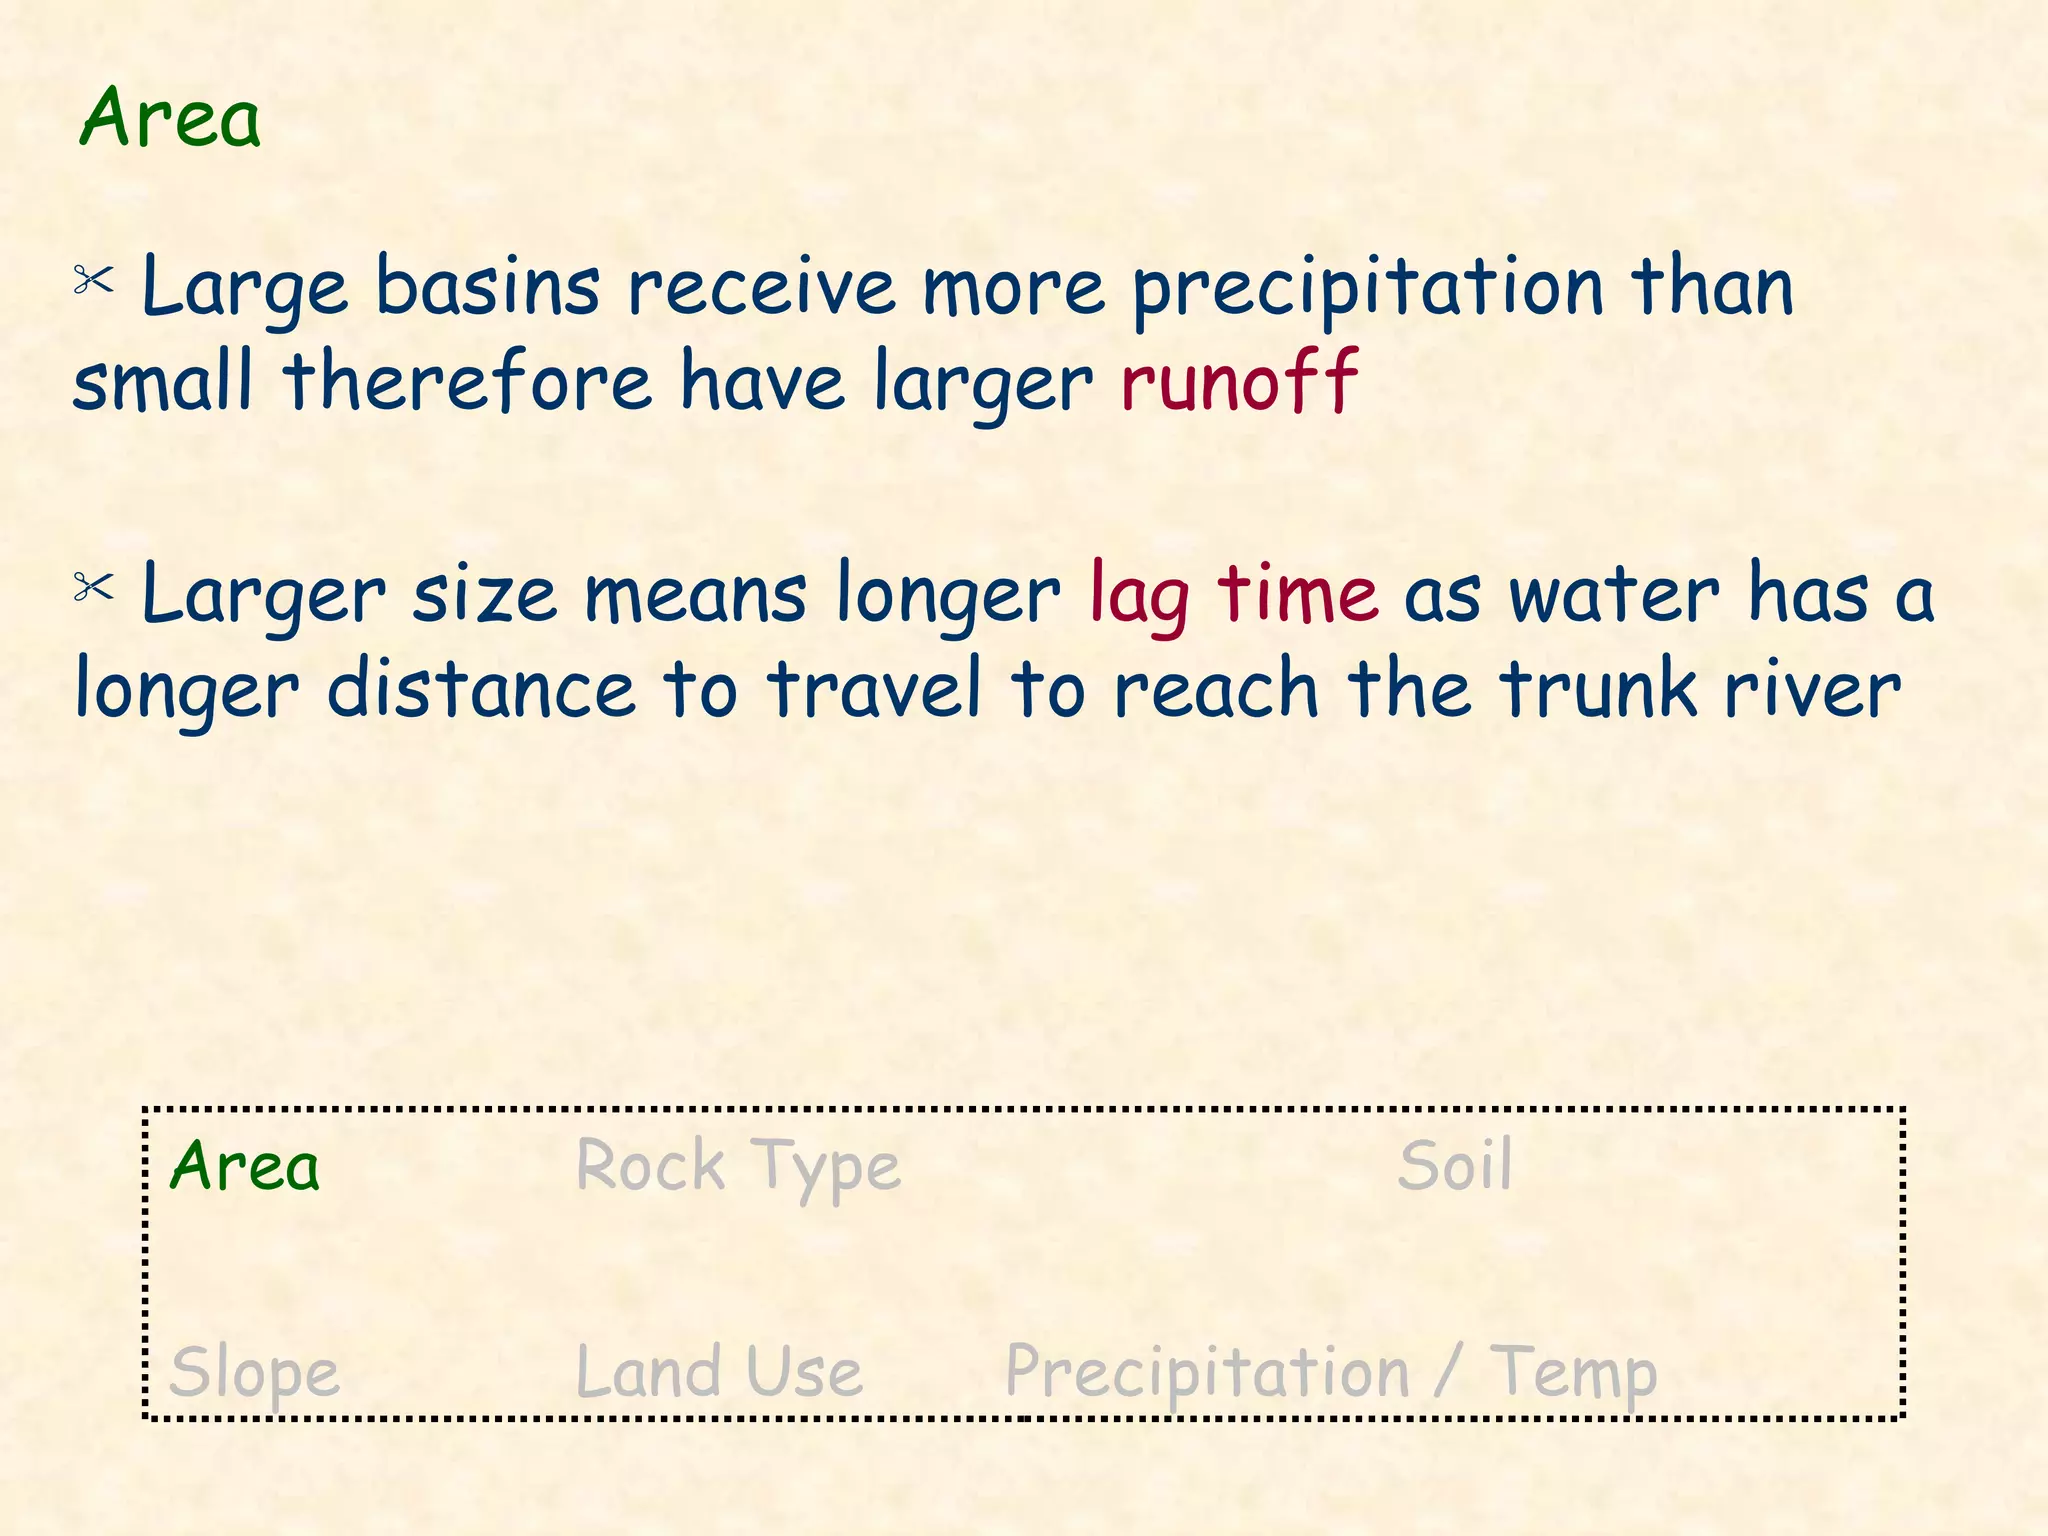
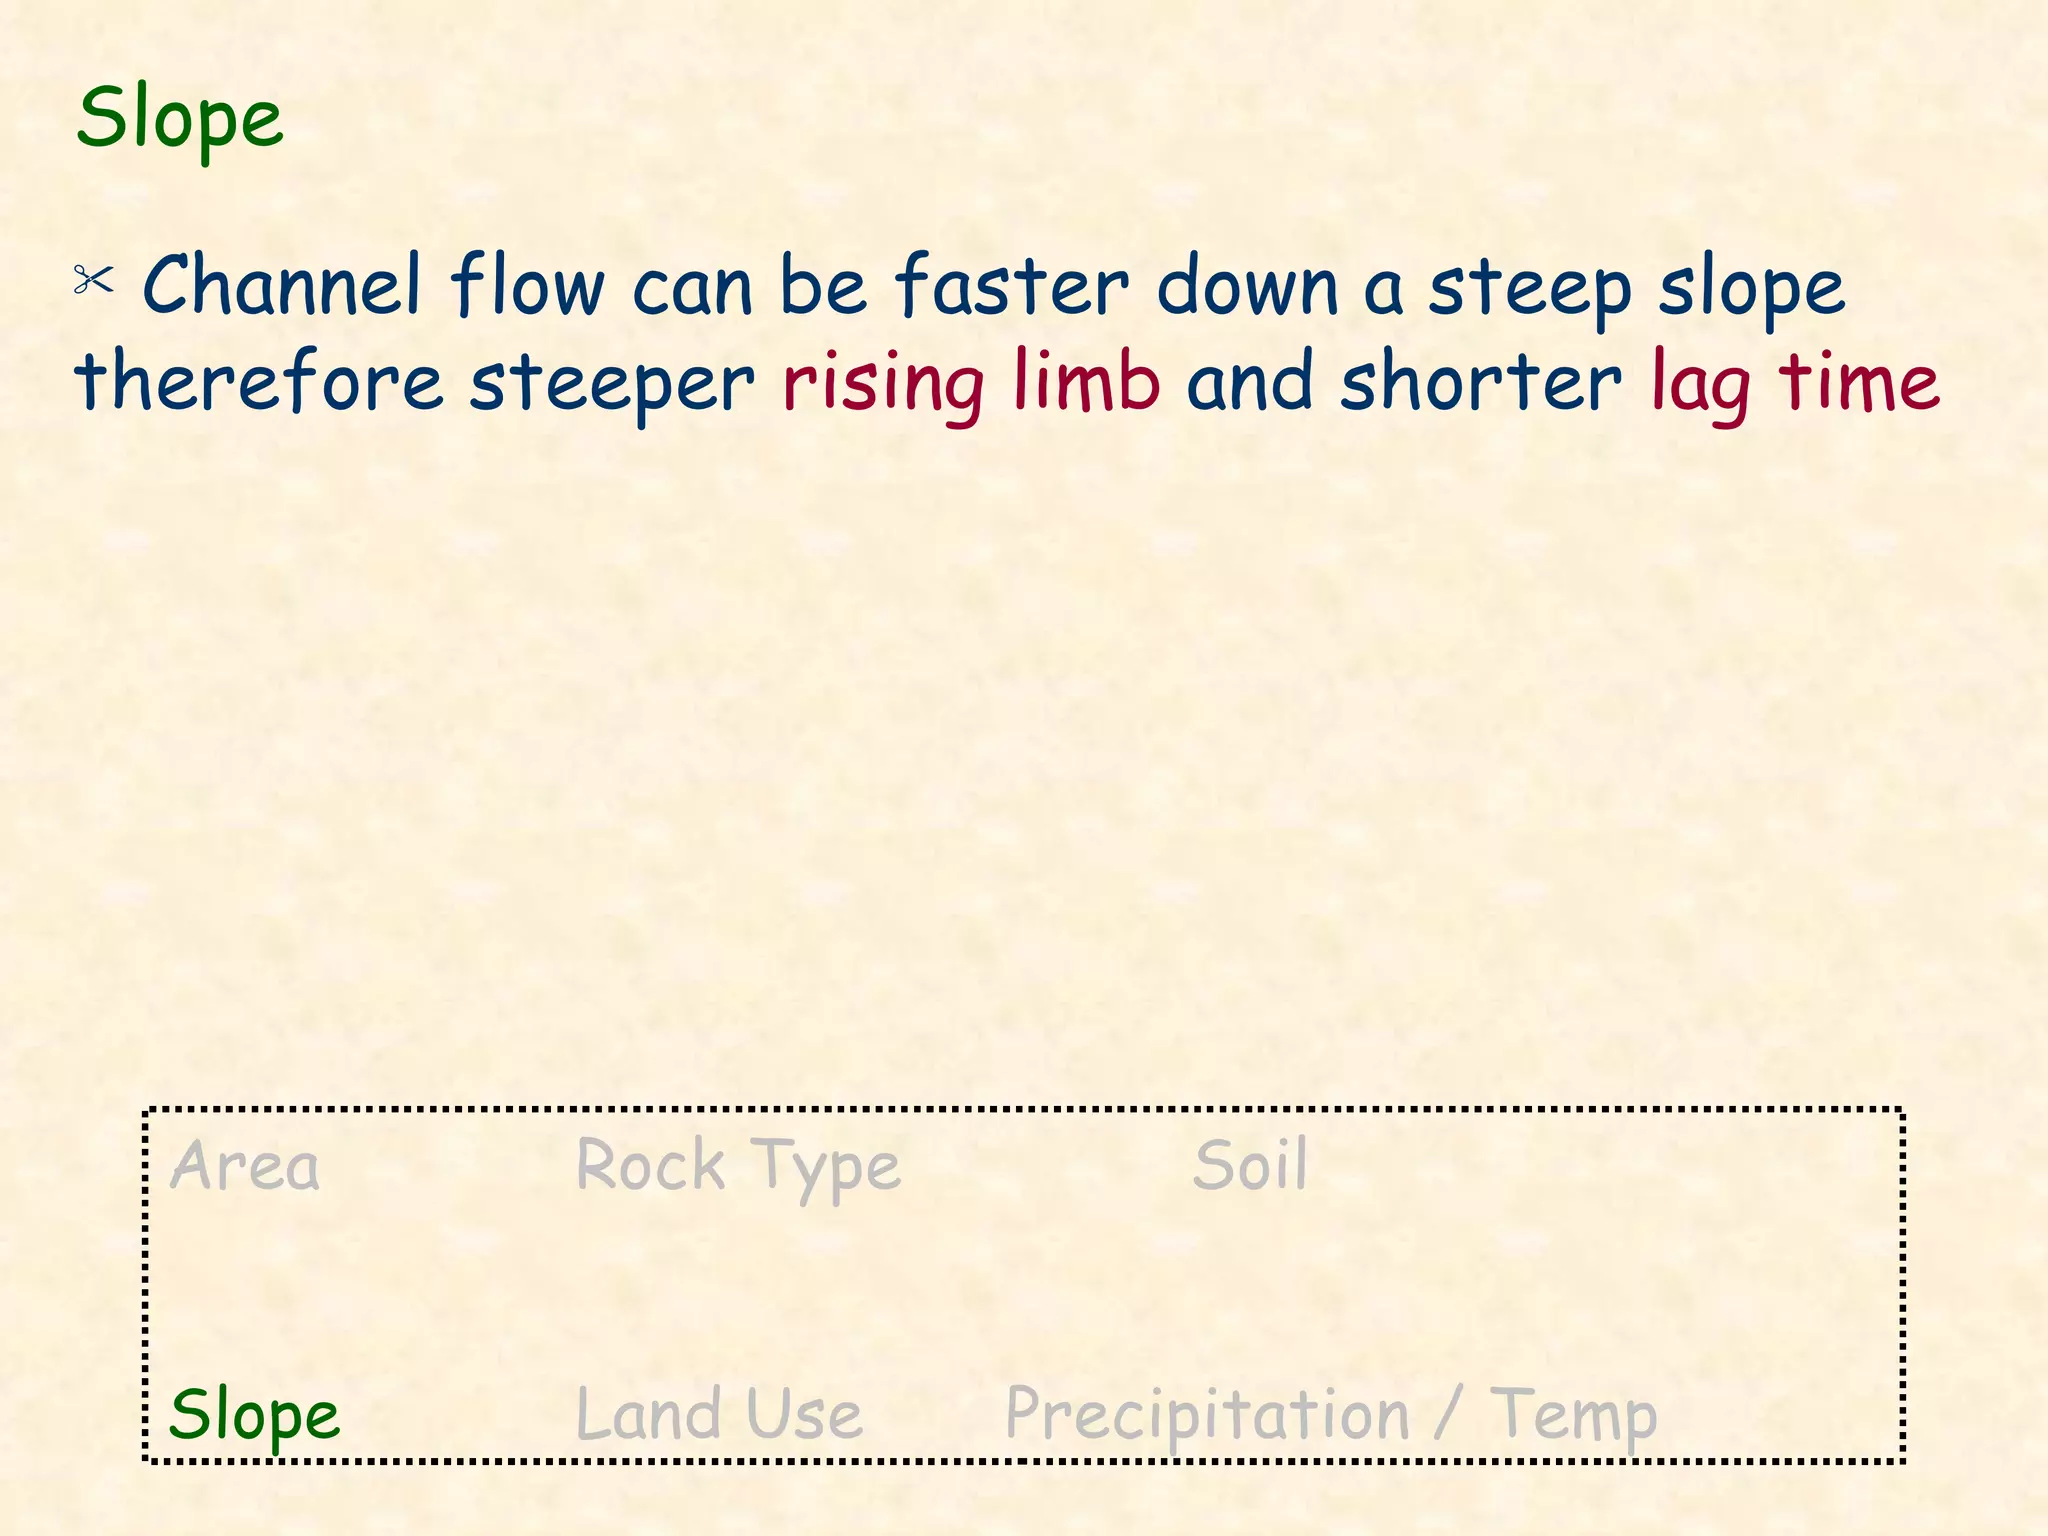
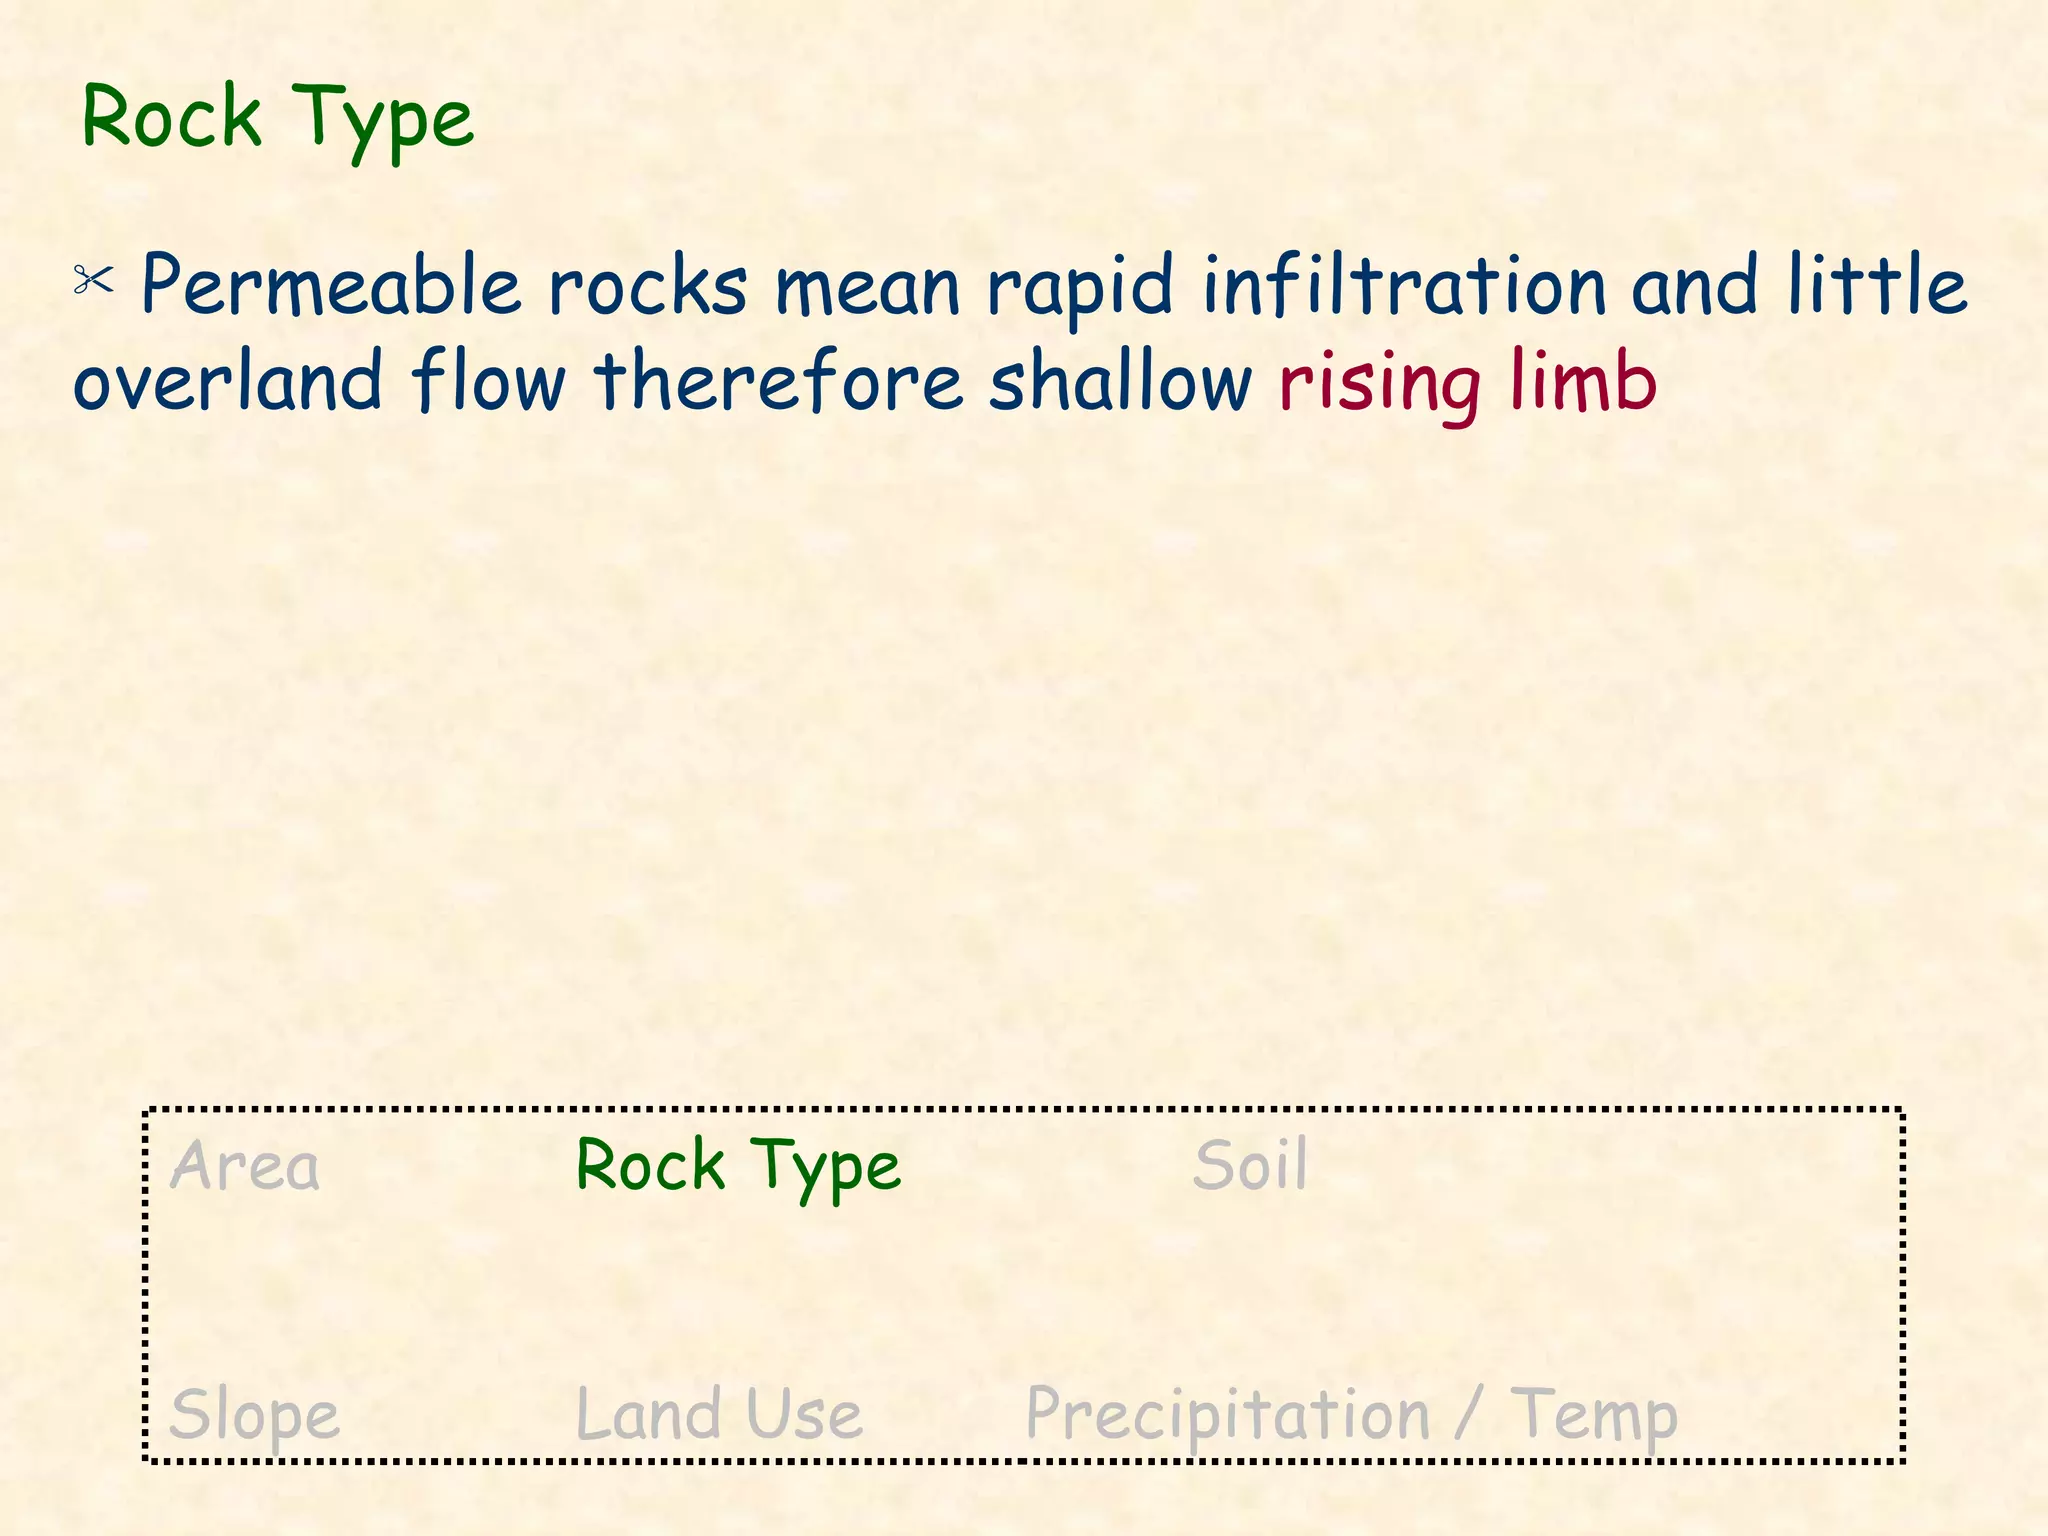
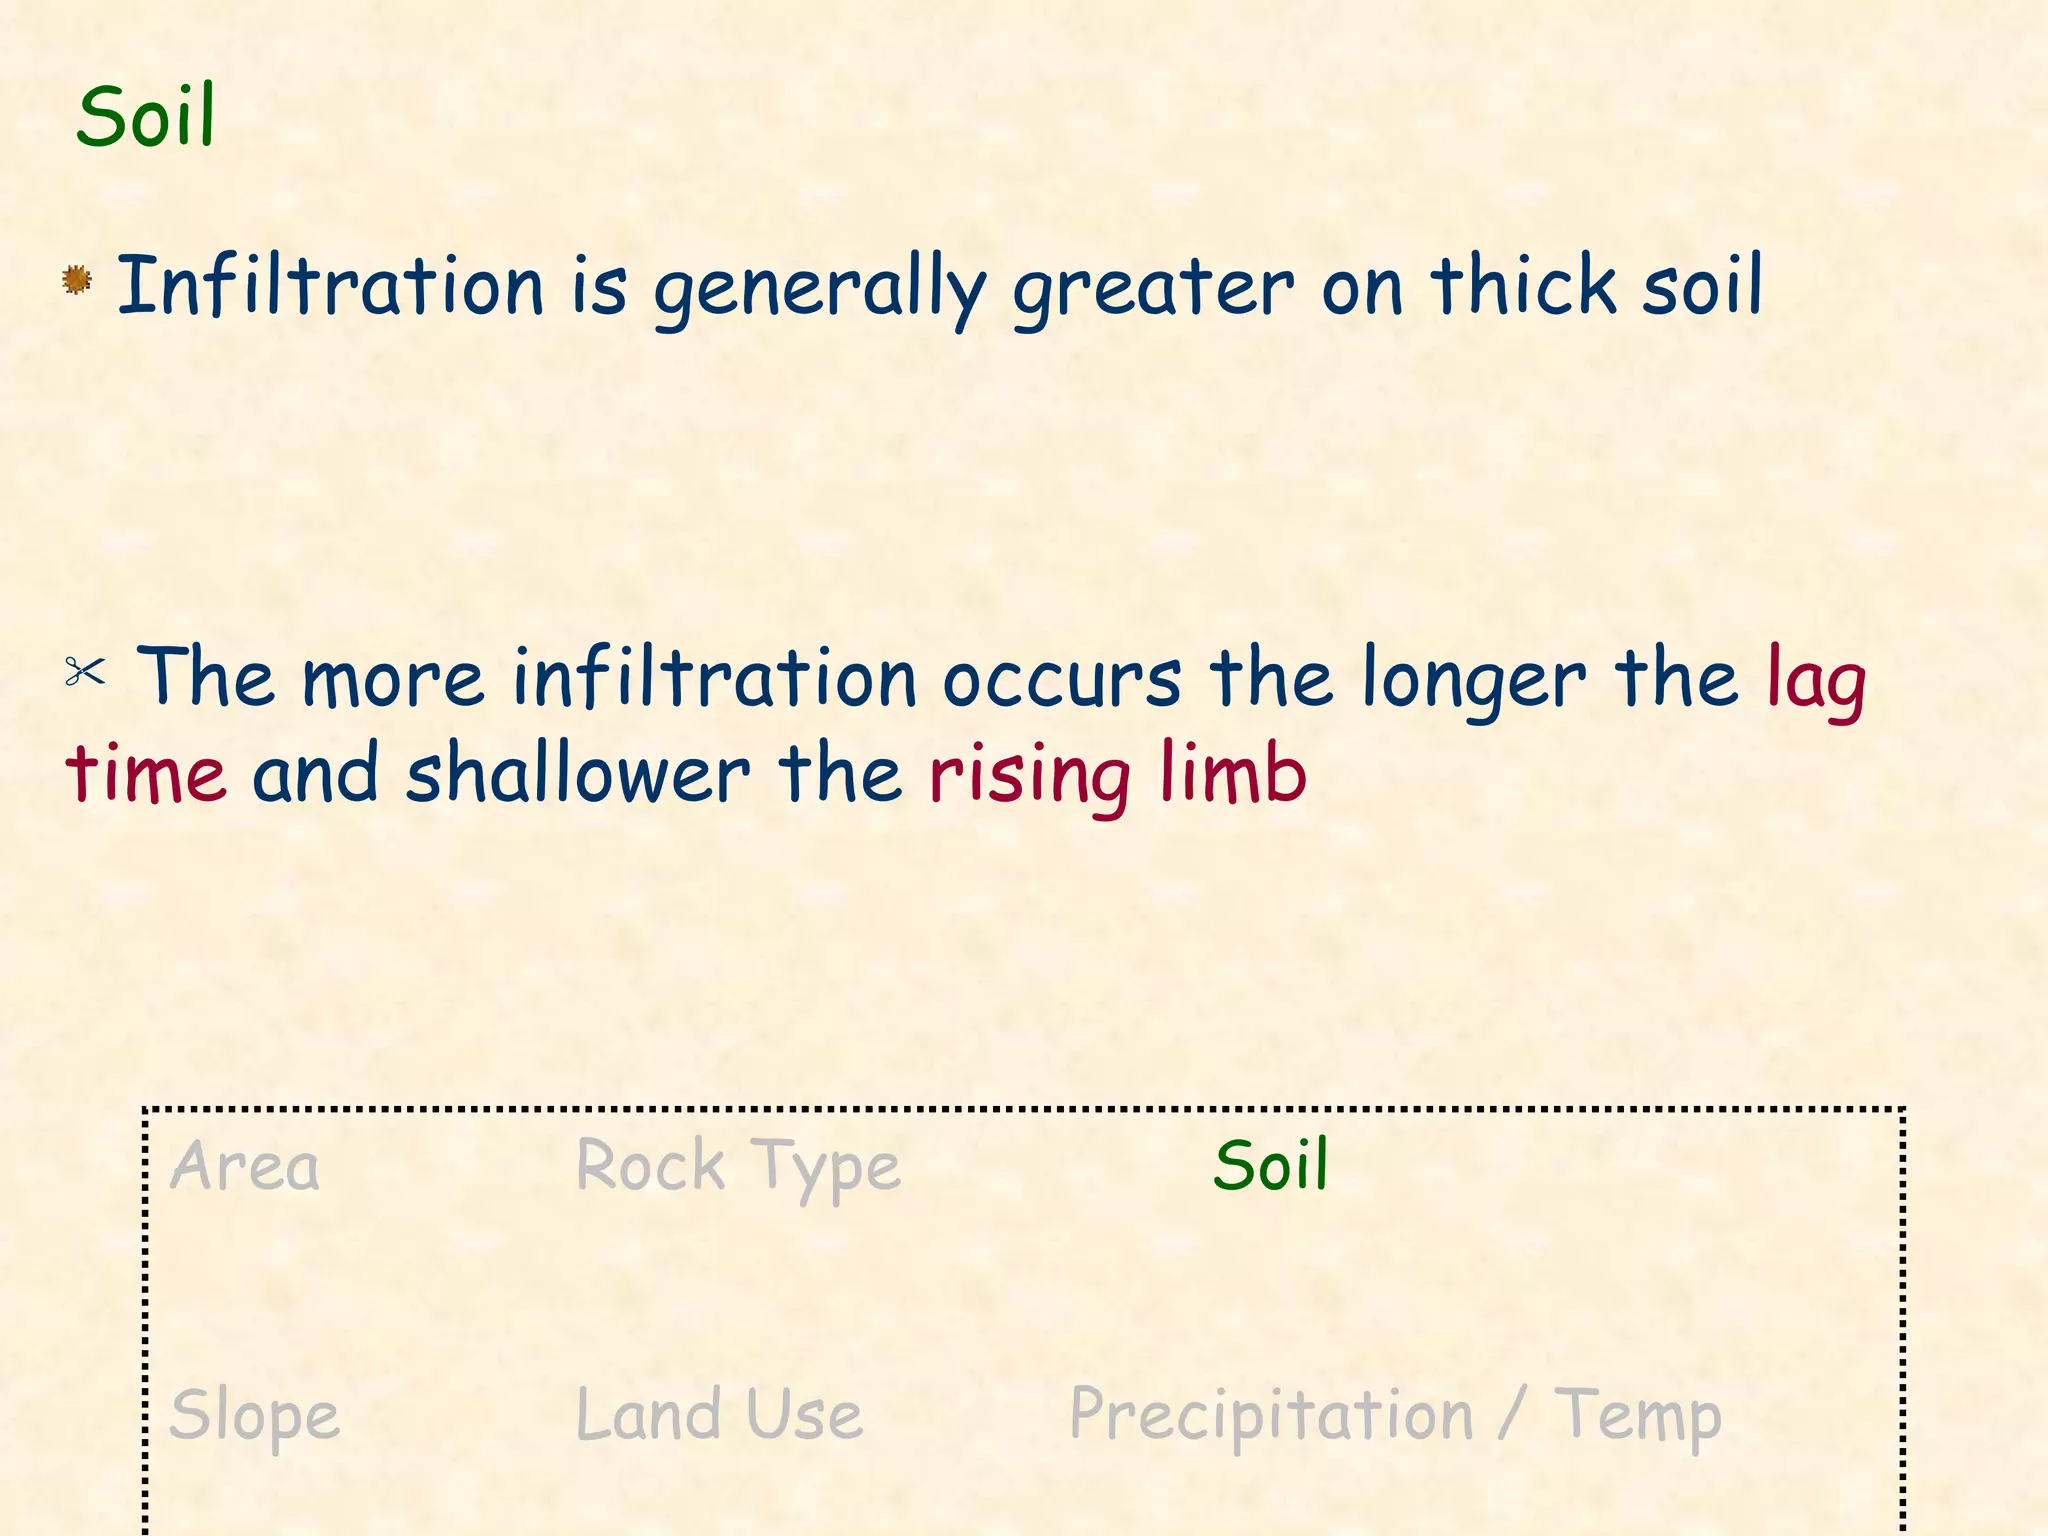
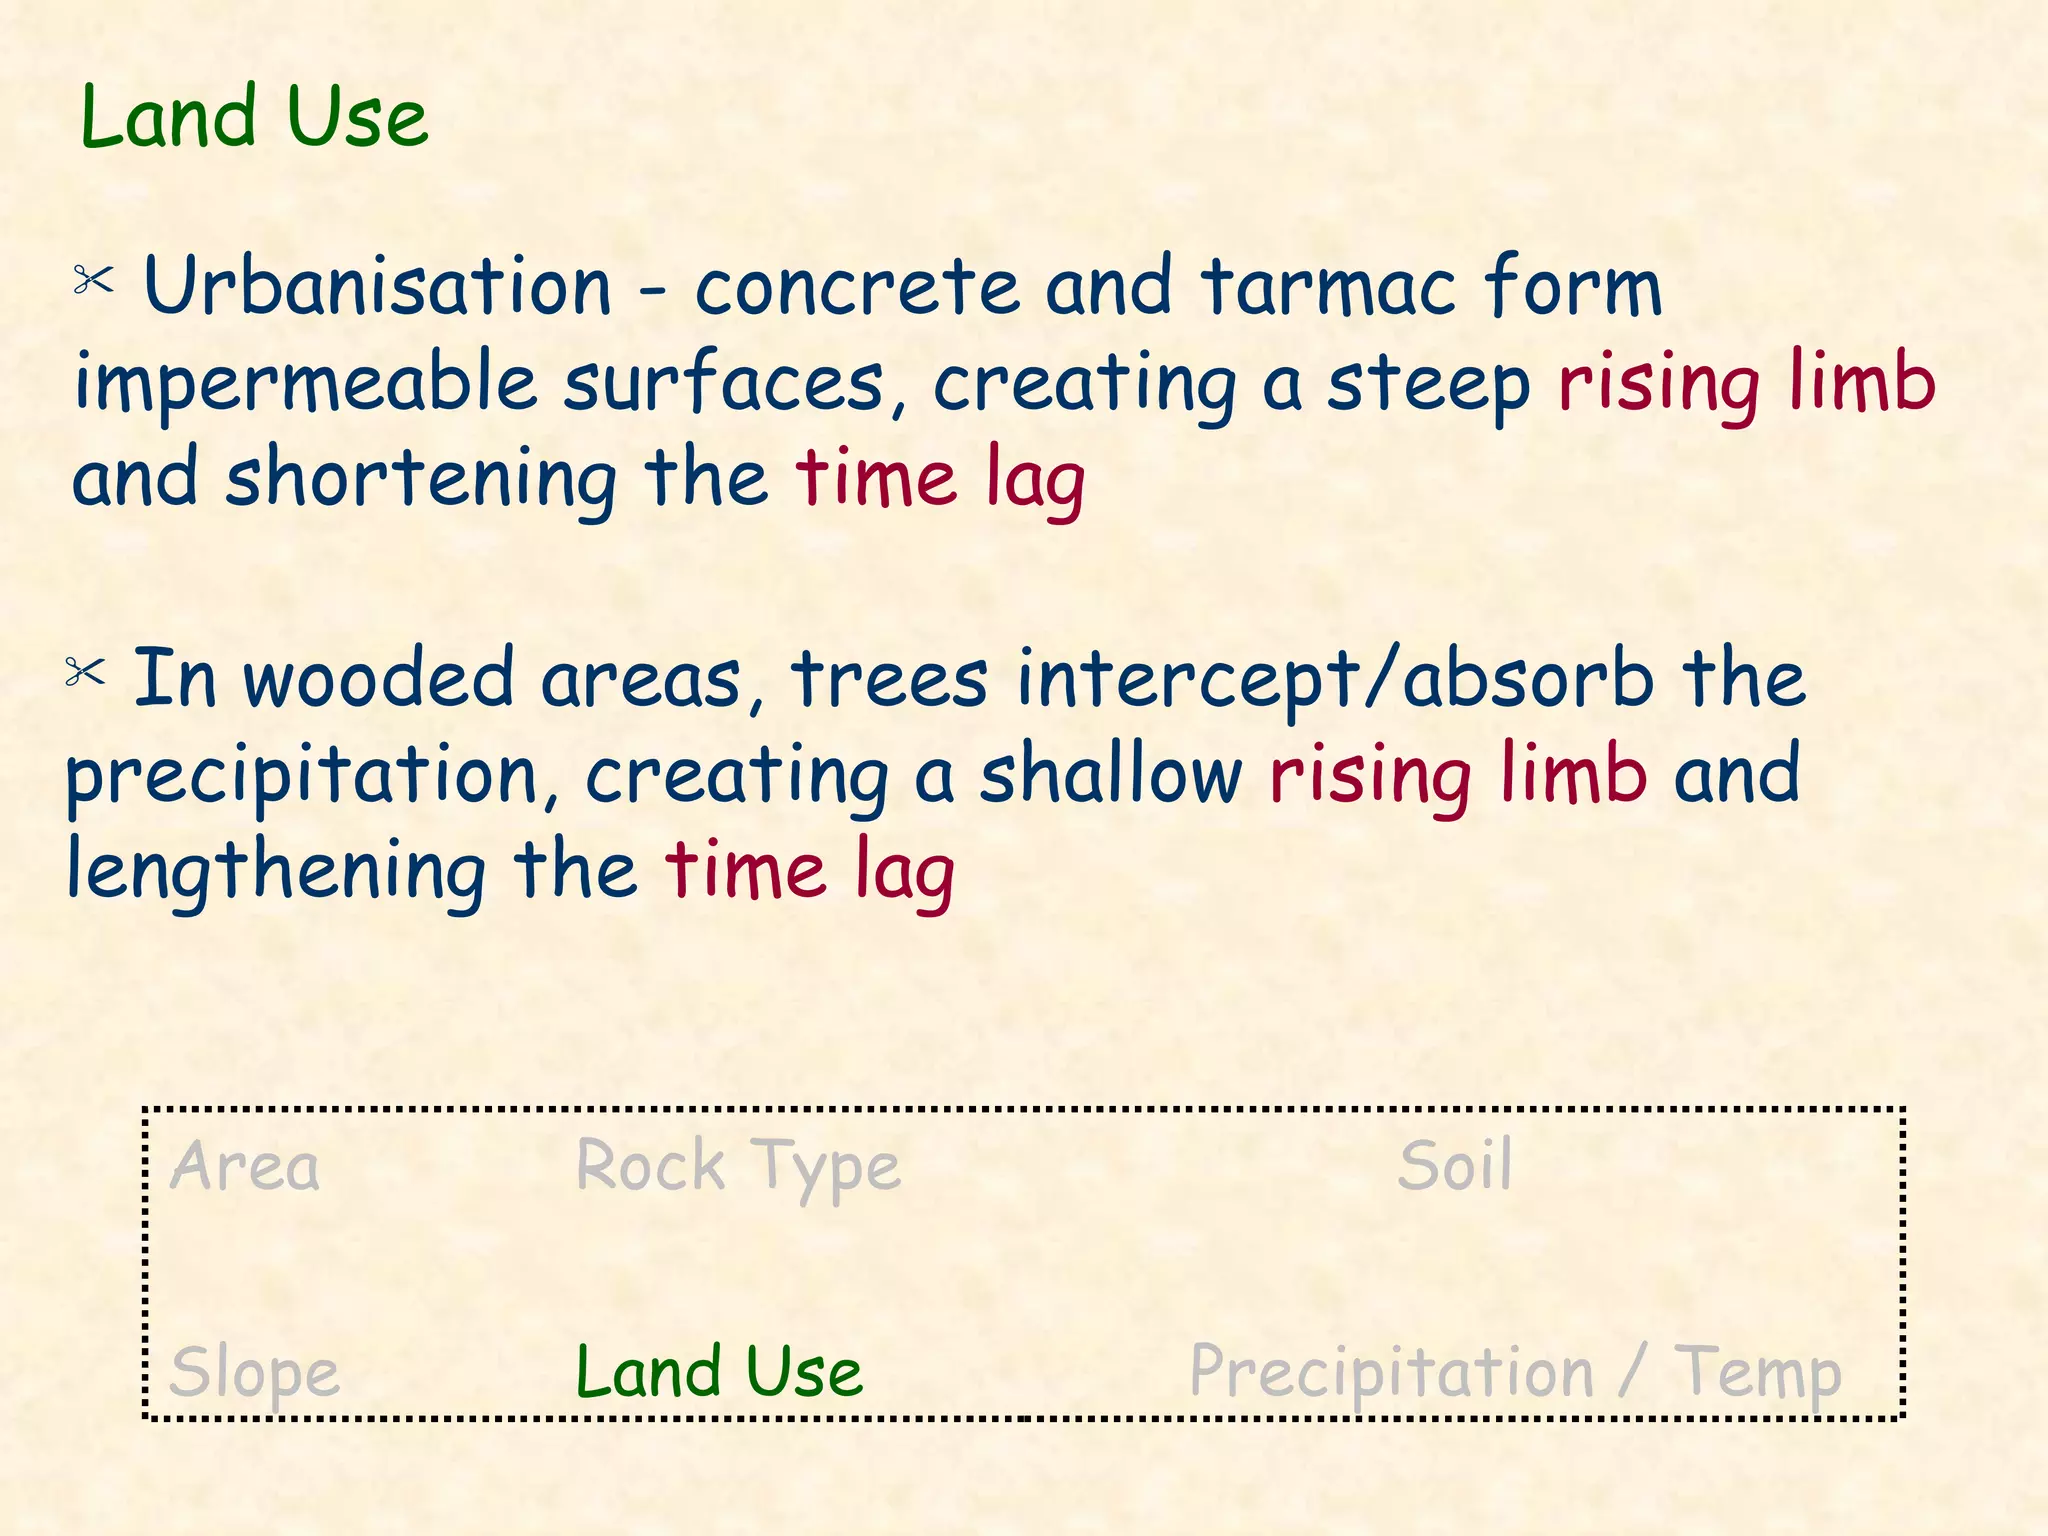
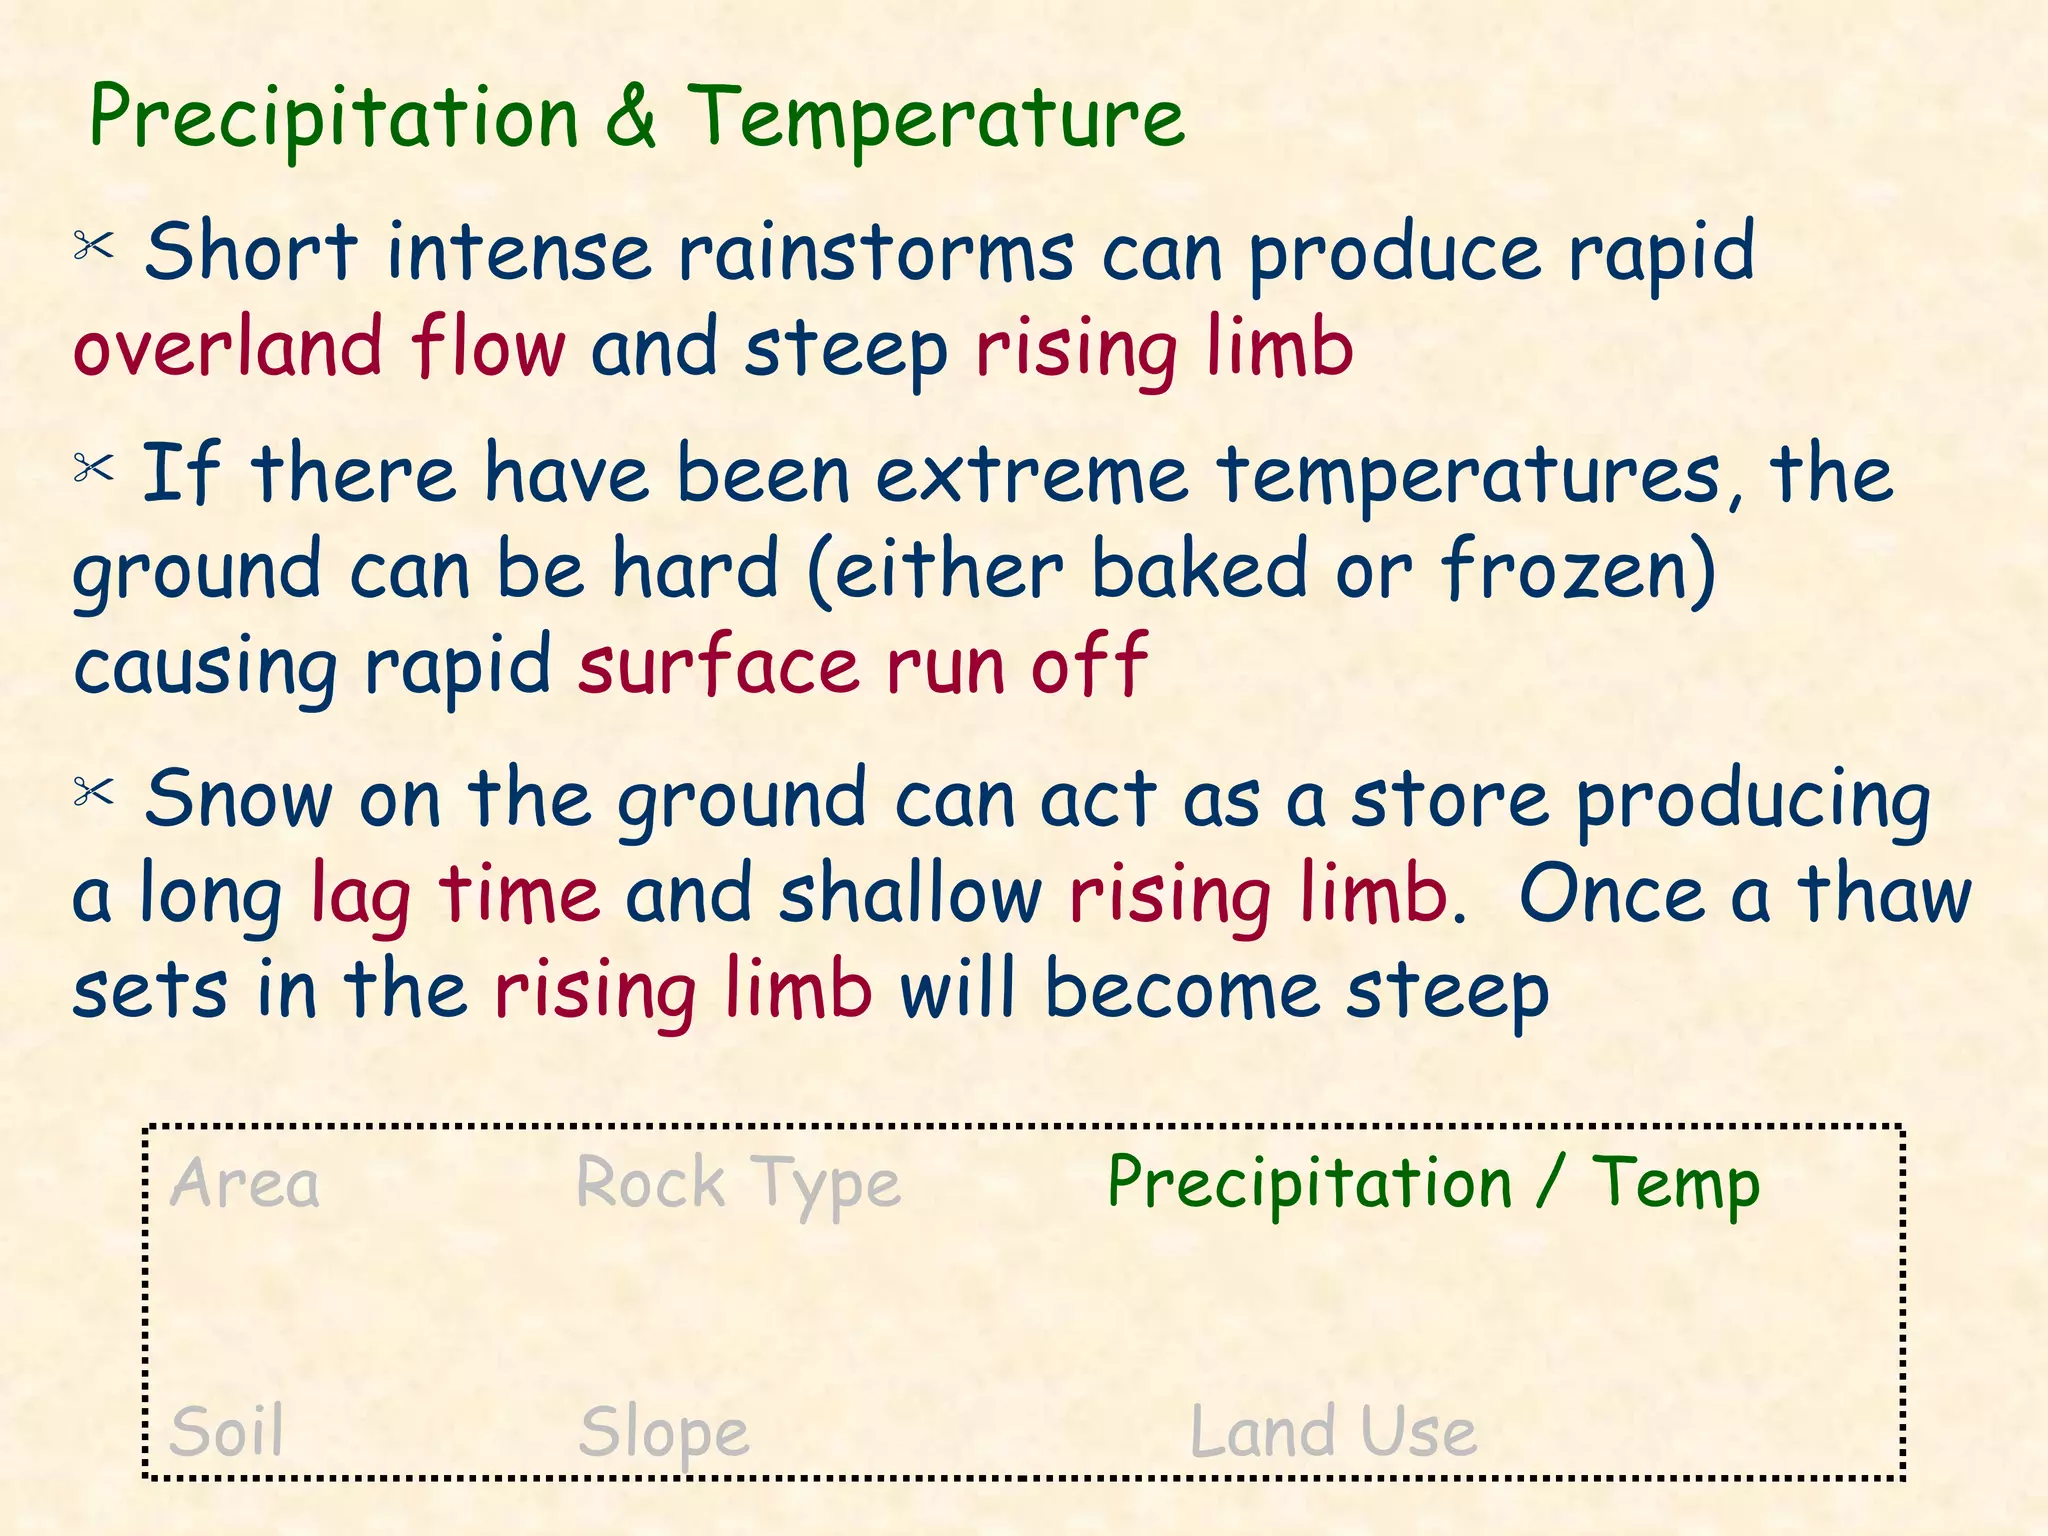
Construction And Analysis of Hydrographs © Microsoft Word clipart © Microsoft Word clipart
Hydrograph Record of River Discharge (the level of water flowing down a river channel) over a period of time, they show how certain rivers respond to a rainstorm. River   Discharge   (the level of water flowing down a river)  (is calculated) Storm Hydrographs Show the change in discharge caused by a period of rainfall =  cross sectional area rivers mean (average) velocity X (at a particular point in its course)
Why Construct & Analyse Hydrographs ? To find out discharge patterns of a particular drainage basin Help predict flooding events, therefore influence implementation of flood prevention measures © Microsoft Word clipart
Construction Of  Storm (flood) Hydrographs © Microsoft Word clipart
0  12  24  36  48  30  72 Hours from start of rain storm 3 2 1 Discharge (m 3 /s) Base flow Through flow Overland flow Rising limb Recession limb Basin lag time mm 4 3 2 Peak flow Flood Hydrograph
The discharge of the river is measured in  cumecs  - this stands for cubic metres per second 0  12  24  36  48  30  72 Hours from start of rain storm 3 2 1 Discharge (m 3 /s)
0  12  24  36  48  30  72 Hours from start of rain storm 3 2 1 Discharge (m 3 /s) mm 4 3 2 Rainfall shown in mm, as a bar graph
0  12  24  36  48  30  72 Hours from start of rain storm 3 2 1 Discharge (m 3 /s) mm 4 3 2 Discharge in m 3 /s, as a line graph
0  12  24  36  48  30  72 Hours from start of rain storm 3 2 1 Discharge (m 3 /s) Rising limb mm 4 3 2 Rising limb The normal (base) flow of the river starts to rise when run-off, ground and soil water reaches the river.
0  12  24  36  48  30  72 Hours from start of rain storm 3 2 1 Discharge (m 3 /s) Rising limb mm 4 3 2 Peak flow Peak flow Maximum discharge in the river, the  time when the river reaches its highest flow
0  12  24  36  48  30  72 Hours from start of rain storm 3 2 1 Discharge (m 3 /s) Rising limb Recession limb mm 4 3 2 Peak flow Recession limb shows that water is still reaching the river but in decreasing amounts
0  12  24  36  48  30  72 Hours from start of rain storm 3 2 1 Discharge (m 3 /s) Rising limb Recession limb Basin lag time mm 4 3 2 Peak flow Basin lag time The time it takes for the water to find its way to the river
0  12  24  36  48  30  72 Hours from start of rain storm 3 2 1 Discharge (m 3 /s) Base flow Rising limb Recession limb Basin lag time mm 4 3 2 Peak flow Base flow Normal discharge of the river
0  12  24  36  48  30  72 Hours from start of rain storm 3 2 1 Discharge (m 3 /s) Base flow Through flow Overland flow Rising limb Recession limb Basin lag time mm 4 3 2 Peak flow Overland flow Through flow + = Storm Flow
Volume of water reaching the river from surface run off Overland flow Through flow Volume of water reaching the river through the soil and underlying rock layers
Analysis © Microsoft Word clipart
Interpretation of Storm Hydrographs Rainfall Intensity Rising Limb Recession Limb Lag time Peak flow compared to Base flow Recovery rate, back to Base flow You need to refer to: Basin lag time 0  12  24  36  48  30  72 Hours from start of rain storm 3 2 1 Discharge (m 3 /s) Rising limb Recession limb mm 4 3 2 Peak flow Base flow Through flow Overland flow
Some Factors influencing Storm Hydrographs Area Slope Rock Type Land Use Soil Precipitation / Temp © Microsoft Word clipart
Area Large basins receive more precipitation than small therefore have larger  runoff Larger size means longer  lag time  as water has a longer distance to travel to reach the trunk river Area Rock Type Soil Slope Land Use  Precipitation / Temp
Slope Channel flow can be faster down a steep slope therefore steeper  rising limb  and shorter  lag time Area Rock Type Soil Slope Land Use  Precipitation / Temp
Rock Type Permeable rocks mean rapid infiltration and little overland flow therefore shallow  rising limb   Area Rock Type Soil Slope Land Use   Precipitation / Temp
Soil Infiltration is generally greater on thick soil The more infiltration occurs the longer the  lag time  and shallower the  rising limb Area Rock Type   Soil Slope Land Use  Precipitation / Temp
Land Use Urbanisation - concrete and tarmac form impermeable surfaces, creating a steep  rising limb  and shortening the  time lag In wooded areas, trees intercept/absorb the precipitation, creating a shallow  rising limb  and lengthening the  time lag   Area Rock Type Soil Slope Land Use Precipitation / Temp
Precipitation & Temperature Short intense rainstorms can produce rapid  overland flow  and steep  rising limb If there have been extreme temperatures, the ground can be hard (either baked or frozen) causing rapid  surface run off Snow on the ground can act as a store producing a long  lag time  and shallow  rising limb .  Once a thaw sets in the  rising limb  will become steep Area Rock Type   Precipitation / Temp Soil Slope   Land Use
Remember! These  influencing factors  will: Influence each other Change throughout the rivers course

Hydrograph explanation and animation

  • 1.
    Construction And Analysisof Hydrographs © Microsoft Word clipart © Microsoft Word clipart
  • 2.
    Hydrograph Record ofRiver Discharge (the level of water flowing down a river channel) over a period of time, they show how certain rivers respond to a rainstorm. River Discharge (the level of water flowing down a river) (is calculated) Storm Hydrographs Show the change in discharge caused by a period of rainfall = cross sectional area rivers mean (average) velocity X (at a particular point in its course)
  • 3.
    Why Construct &Analyse Hydrographs ? To find out discharge patterns of a particular drainage basin Help predict flooding events, therefore influence implementation of flood prevention measures © Microsoft Word clipart
  • 4.
    Construction Of Storm (flood) Hydrographs © Microsoft Word clipart
  • 5.
    0 12 24 36 48 30 72 Hours from start of rain storm 3 2 1 Discharge (m 3 /s) Base flow Through flow Overland flow Rising limb Recession limb Basin lag time mm 4 3 2 Peak flow Flood Hydrograph
  • 6.
    The discharge ofthe river is measured in cumecs - this stands for cubic metres per second 0 12 24 36 48 30 72 Hours from start of rain storm 3 2 1 Discharge (m 3 /s)
  • 7.
    0 12 24 36 48 30 72 Hours from start of rain storm 3 2 1 Discharge (m 3 /s) mm 4 3 2 Rainfall shown in mm, as a bar graph
  • 8.
    0 12 24 36 48 30 72 Hours from start of rain storm 3 2 1 Discharge (m 3 /s) mm 4 3 2 Discharge in m 3 /s, as a line graph
  • 9.
    0 12 24 36 48 30 72 Hours from start of rain storm 3 2 1 Discharge (m 3 /s) Rising limb mm 4 3 2 Rising limb The normal (base) flow of the river starts to rise when run-off, ground and soil water reaches the river.
  • 10.
    0 12 24 36 48 30 72 Hours from start of rain storm 3 2 1 Discharge (m 3 /s) Rising limb mm 4 3 2 Peak flow Peak flow Maximum discharge in the river, the time when the river reaches its highest flow
  • 11.
    0 12 24 36 48 30 72 Hours from start of rain storm 3 2 1 Discharge (m 3 /s) Rising limb Recession limb mm 4 3 2 Peak flow Recession limb shows that water is still reaching the river but in decreasing amounts
  • 12.
    0 12 24 36 48 30 72 Hours from start of rain storm 3 2 1 Discharge (m 3 /s) Rising limb Recession limb Basin lag time mm 4 3 2 Peak flow Basin lag time The time it takes for the water to find its way to the river
  • 13.
    0 12 24 36 48 30 72 Hours from start of rain storm 3 2 1 Discharge (m 3 /s) Base flow Rising limb Recession limb Basin lag time mm 4 3 2 Peak flow Base flow Normal discharge of the river
  • 14.
    0 12 24 36 48 30 72 Hours from start of rain storm 3 2 1 Discharge (m 3 /s) Base flow Through flow Overland flow Rising limb Recession limb Basin lag time mm 4 3 2 Peak flow Overland flow Through flow + = Storm Flow
  • 15.
    Volume of waterreaching the river from surface run off Overland flow Through flow Volume of water reaching the river through the soil and underlying rock layers
  • 16.
  • 17.
    Interpretation of StormHydrographs Rainfall Intensity Rising Limb Recession Limb Lag time Peak flow compared to Base flow Recovery rate, back to Base flow You need to refer to: Basin lag time 0 12 24 36 48 30 72 Hours from start of rain storm 3 2 1 Discharge (m 3 /s) Rising limb Recession limb mm 4 3 2 Peak flow Base flow Through flow Overland flow
  • 18.
    Some Factors influencingStorm Hydrographs Area Slope Rock Type Land Use Soil Precipitation / Temp © Microsoft Word clipart
  • 19.
    Area Large basinsreceive more precipitation than small therefore have larger runoff Larger size means longer lag time as water has a longer distance to travel to reach the trunk river Area Rock Type Soil Slope Land Use Precipitation / Temp
  • 20.
    Slope Channel flowcan be faster down a steep slope therefore steeper rising limb and shorter lag time Area Rock Type Soil Slope Land Use Precipitation / Temp
  • 21.
    Rock Type Permeablerocks mean rapid infiltration and little overland flow therefore shallow rising limb Area Rock Type Soil Slope Land Use Precipitation / Temp
  • 22.
    Soil Infiltration isgenerally greater on thick soil The more infiltration occurs the longer the lag time and shallower the rising limb Area Rock Type Soil Slope Land Use Precipitation / Temp
  • 23.
    Land Use Urbanisation- concrete and tarmac form impermeable surfaces, creating a steep rising limb and shortening the time lag In wooded areas, trees intercept/absorb the precipitation, creating a shallow rising limb and lengthening the time lag Area Rock Type Soil Slope Land Use Precipitation / Temp
  • 24.
    Precipitation & TemperatureShort intense rainstorms can produce rapid overland flow and steep rising limb If there have been extreme temperatures, the ground can be hard (either baked or frozen) causing rapid surface run off Snow on the ground can act as a store producing a long lag time and shallow rising limb . Once a thaw sets in the rising limb will become steep Area Rock Type Precipitation / Temp Soil Slope Land Use
  • 25.
    Remember! These influencing factors will: Influence each other Change throughout the rivers course