SlideShare a Scribd company logo
1 of 3
SCHOOL REPORT CARD
Summary of Information
1. Enrolment
● Total number of learners enrolled
o By gender
o Last 3 years
2. Health and nutritional status
•Number of learners who are severely wasted/wasted
• By gender
•For every key stage
• (K-3, 4-6, JHS, SHS)
•Current year
3. Learners materials*
● Thecount of shortages/excess learners materials per
grade level based on what the students are using
during the School Year
● Only subjects which have shortage/excess learners
materials will be listed per grade level
● Current year
4. Teachers’ professional development*
● Number of teachers who attended training/further
studies
● By kind/type of professional development (e.g. ICT,
Further studies, INSET, LAC, etc)
● Current year
5. Funding sources*
● Funding amount and sources (MOOE, LGU,
canteen, donors, etc.)
● Current year
6. School awards and recognitions*
● Top 3 awards/ recognition from award-giving bodies
duly recognized by DepEd
● Listing by title, award-giving body, level (school,
division, regional, national, international)
● Categorized into student, teacher, school head, and
school awards
● Current year
7. Number and rate of dropouts by cause
● Count and percentage of learners who do not finish
a particular grade level. (It does not capture learners
who finish a grade level but do not enrol in the next
grade level the following school year)
● Look at the five (5) major causes of dropout in the
school
● Last 3 years
8. Percentage of learners who completed the School Year
(Promotion Rate)
● Percentage of learners who completed the school
year
● Number of promoted learners over number of total
learners x 100
● Per grade level
● Current year
9. National Achievement Test (NAT) – by Mean Percentage
Score (MPS)
● MPS per subject
● Grade 6/10 results for complete schools
● Grade 3/8 results for incompleteschools
● Current year
10. Literacy level
● Total number of learners who are in the frustration,
instructional, and independent levels for English and
Filipino (oral and silent reading)
● Should show pre and post test results
● If PHIL-IRI is used, will cover grades 2-6 only
● Current year
11. School-Based Management Assessment Level
● School level based on SBM Assessment
12. Child-Friendly School Survey result*
● Survey to be accomplished by the School Planning
Team
● Based on CFSS point system:
o 25-29 points: Child-Friendly School
SCHOOL REPORT CARD
Summary of Information
1. Enrolment
● Total number of learners enrolled
o By gender
o Last 3 years
2. Health and nutritional status
•Number of learners who are severely wasted/wasted
• By gender
•For every key stage
• (K-3, 4-6, JHS, SHS)
•Current year
3. Learners materials*
● Thecount of shortages/excess learners materials per
grade level based on what the students are using
during the School Year
● Only subjects which have shortage/excess learners
materials will be listed per grade level
● Current year
4. Teachers’ professional development*
● Number of teachers who attended training/further
studies
● By kind/type of professional development (e.g. ICT,
Further studies, INSET, LAC, etc)
● Current year
5. Funding sources*
● Funding amount and sources (MOOE, LGU,
canteen, donors, etc.)
● Current year
6. School awards and recognitions*
● Top 3 awards/ recognition from award-giving bodies
duly recognized by DepEd
● Listing by title, award-giving body, level (school,
division, regional, national, international)
● Categorized into student, teacher, school head, and
school awards
● Current year
7. Number and rate of dropouts by cause
● Count and percentage of learners who do not finish
a particular grade level. (It does not capture learners
who finish a grade level but do not enrol in the next
grade level the following school year)
● Look at the five (5) major causes of dropout in the
school
● Last 3 years
8. Percentage of learners who completed the School Year
(Promotion Rate)
● Percentage of learners who completed the school
year
● Number of promoted learners over number of total
learners x 100
● Per grade level
● Current year
9. National Achievement Test (NAT) – by Mean Percentage
Score (MPS)
● MPS per subject
● Grade 6/10 results for complete schools
● Grade 3/8 results for incompleteschools
● Current yar
10. Literacy level
● Total number of learners who are in the frustration,
instructional, and independent levels for English and
Filipino (oral and silent reading)
● Should show pre and post test results
● If PHIL-IRI is used, will cover grades 2-6 only
● Current year
11. School-Based Management Assessment Level
● School level based on SBM Assessment
SCHOOL REPORT CARD
Summary of Information
Cont.
o 35 and above points: Very Outstanding Child-
Friendly School
● Current year
13. Stakeholders’ participation*
There will be two (2) data sets:
1.Percentage (number of attendees over those invited) of
parents/guardians and other stakeholders who attend during:
o Co-curricular activities (Science month, Reading
month, contests, etc.)
o Extra-curricular activities (Boy Scouts, Brigada
Eskwela, sports fests, etc.)
o Meetings and Assemblies (SIP, CI, General PTA, etc.)
• Current year
2.Total contribution (in kind, man-hours, etc.) of stakeholders
which are accounted
•Current year
•By reporting period (Mid-year and Year-end)
14. Learner-Teacher ratio
● Comparison of the actual ratio of learners to
teachers against the standard:
o Kinder (25:1)
o Grades 1 & 2 (40:1)
o Grades 3 to 10 (45:1)
o SHS (40:1)
●Per grade level
● Current year
15. Learner-Classroom ratio
● Comparison of the actual ratio of learners to
classrooms against the standard:
o Kinder (25:1)
o Grades 1 & 2 (40:1)
o Grades 3 to 10 (45:1)
o SHS (40:1)
● Per grade level
● Current year
16. Learner-Toilet ratio
•Comparison of the actual ratio of learners to
functional toilets against standards (50:1)
•Total number
•By gender
•Current year
17. Learner-Seat ratio
● Comparison of the actual ratio of learners to seats
against the standard (1:1)
● Total number
● Current year
18. Status of Annual Implementation Plan
(AIP)/Continuous Improvement (CI) Projects*
● Theprogress of CI projects
● Data sets may differ depending on what the school
wants to present
● Current year
19. Other stakeholders’ accomplishments* ● Reports done by
other stakeholders on their initiatives/activities
independent from the PIA/CI projects (e.g. activities of
the SGC, SPG/SSG, etc.)
● Data sets may differ depending on the
SCHOOL REPORT CARD
Summary of Information
Cont.
o 35 and above points: Very Outstanding Child-
Friendly School
● Current year
13. Stakeholders’ participation*
There will be two (2) data sets:
1.Percentage (number of attendees over those invited) of
parents/guardians and other stakeholders who attend during:
o Co-curricular activities (Science month, Reading
month, contests, etc.)
o Extra-curricular activities (Boy Scouts, Brigada
Eskwela, sports fests, etc.)
o Meetings and Assemblies (SIP, CI, General PTA, etc.)
• Current year
2.Total contribution (in kind, man-hours, etc.) of stakeholders
which are accounted
•Current year
•By reporting period (Mid-year and Year-end)
14. Learner-Teacher ratio
● Comparison of the actual ratio of learners to
teachers against the standard:
o Kinder (25:1)
o Grades 1 & 2 (40:1)
o Grades 3 to 10 (45:1)
o SHS (40:1)
●Per grade level
● Current year
15. Learner-Classroom ratio
● Comparison of the actual ratio of learners to
classrooms against the standard:
o Kinder (25:1)
o Grades 1 & 2 (40:1)
o Grades 3 to 10 (45:1)
o SHS (40:1)
● Per grade level
● Current year
16. Learner-Toilet ratio
•Comparison of the actual ratio of learners to
functional toilets against standards (50:1)
•Total number
•By gender
•Current year
17. Learner-Seat ratio
● Comparison of the actual ratio of learners to seats
against the standard (1:1)
● Total number
● Current year
18. Status of Annual Implementation Plan
(AIP)/Continuous Improvement (CI) Projects*
● Theprogress of CI projects
● Data sets may differ depending on what the school
wants to present
ISchool Report Card Summary of nformation

More Related Content

What's hot

Accomplishing school forms
Accomplishing school formsAccomplishing school forms
Accomplishing school formsElenita Mogueis
 
IEA: Evaluaciones externas 4º E.Primaria TIMSS PIRLS (Gabriela Noveanu) - Sim...
IEA: Evaluaciones externas 4º E.Primaria TIMSS PIRLS (Gabriela Noveanu) - Sim...IEA: Evaluaciones externas 4º E.Primaria TIMSS PIRLS (Gabriela Noveanu) - Sim...
IEA: Evaluaciones externas 4º E.Primaria TIMSS PIRLS (Gabriela Noveanu) - Sim...Instituto Nacional de Evaluación Educativa
 
Golden Triangle Plus 1
Golden Triangle Plus 1Golden Triangle Plus 1
Golden Triangle Plus 1Richard Voltz
 
Steps to resolve lis and ebeis issues
Steps to resolve lis and ebeis issuesSteps to resolve lis and ebeis issues
Steps to resolve lis and ebeis issuesTangub City Division
 
American education today
American education todayAmerican education today
American education todayTrevour Smith
 
Curriculum connection sept 8 2014
Curriculum connection sept 8  2014Curriculum connection sept 8  2014
Curriculum connection sept 8 2014theconnectedleader
 
Med brochure
Med brochureMed brochure
Med brochureJulia Tan
 
College planning spring 2010
College planning spring 2010College planning spring 2010
College planning spring 2010jbairdrps
 
Form IX & X Parent Night 2014
Form IX & X Parent Night 2014Form IX & X Parent Night 2014
Form IX & X Parent Night 2014ColsSchforGirls
 
Inequalities in educational opportunities and outcomes in secondary schools i...
Inequalities in educational opportunities and outcomes in secondary schools i...Inequalities in educational opportunities and outcomes in secondary schools i...
Inequalities in educational opportunities and outcomes in secondary schools i...Young Lives Oxford
 

What's hot (12)

Modified School Forms
Modified School FormsModified School Forms
Modified School Forms
 
Accomplishing school forms
Accomplishing school formsAccomplishing school forms
Accomplishing school forms
 
IEA: Evaluaciones externas 4º E.Primaria TIMSS PIRLS (Gabriela Noveanu) - Sim...
IEA: Evaluaciones externas 4º E.Primaria TIMSS PIRLS (Gabriela Noveanu) - Sim...IEA: Evaluaciones externas 4º E.Primaria TIMSS PIRLS (Gabriela Noveanu) - Sim...
IEA: Evaluaciones externas 4º E.Primaria TIMSS PIRLS (Gabriela Noveanu) - Sim...
 
Golden Triangle Plus 1
Golden Triangle Plus 1Golden Triangle Plus 1
Golden Triangle Plus 1
 
Steps to resolve lis and ebeis issues
Steps to resolve lis and ebeis issuesSteps to resolve lis and ebeis issues
Steps to resolve lis and ebeis issues
 
American education today
American education todayAmerican education today
American education today
 
Curriculum connection sept 8 2014
Curriculum connection sept 8  2014Curriculum connection sept 8  2014
Curriculum connection sept 8 2014
 
Med brochure
Med brochureMed brochure
Med brochure
 
College planning spring 2010
College planning spring 2010College planning spring 2010
College planning spring 2010
 
Form IX & X Parent Night 2014
Form IX & X Parent Night 2014Form IX & X Parent Night 2014
Form IX & X Parent Night 2014
 
School Success Data
School Success DataSchool Success Data
School Success Data
 
Inequalities in educational opportunities and outcomes in secondary schools i...
Inequalities in educational opportunities and outcomes in secondary schools i...Inequalities in educational opportunities and outcomes in secondary schools i...
Inequalities in educational opportunities and outcomes in secondary schools i...
 

Similar to ISchool Report Card Summary of nformation

Statistical Requirements of Educational Plan
Statistical Requirements of Educational PlanStatistical Requirements of Educational Plan
Statistical Requirements of Educational PlanRamil Gallardo
 
Report Card Presentation - Dec 11, 2018
Report Card Presentation - Dec 11, 2018Report Card Presentation - Dec 11, 2018
Report Card Presentation - Dec 11, 2018Franklin Matters
 
School record
School recordSchool record
School recordtmnaqash
 
Pirie Open House 2015
Pirie Open House 2015Pirie Open House 2015
Pirie Open House 2015Stacie Bell
 
2nd-Quarter-School-Monitoring-Evaluation-Adjustment.pptx
2nd-Quarter-School-Monitoring-Evaluation-Adjustment.pptx2nd-Quarter-School-Monitoring-Evaluation-Adjustment.pptx
2nd-Quarter-School-Monitoring-Evaluation-Adjustment.pptxFreddieGarbosaJr2
 
School Readiness 2016
School Readiness 2016School Readiness 2016
School Readiness 2016DJ van Wyk
 
Basic statistical tools in educational planning
Basic statistical tools in educational planningBasic statistical tools in educational planning
Basic statistical tools in educational planningRai Blanquera
 
SMEA-4th-Quarter-2O23-last-edited.pptx
SMEA-4th-Quarter-2O23-last-edited.pptxSMEA-4th-Quarter-2O23-last-edited.pptx
SMEA-4th-Quarter-2O23-last-edited.pptxDARRENLOUIEESTOMO
 
PISA 2018 Sneak Preview
PISA 2018 Sneak PreviewPISA 2018 Sneak Preview
PISA 2018 Sneak PreviewEduSkills OECD
 
Academic Honesty In The International Baccalaureate Diploma Programme
Academic Honesty In The International Baccalaureate Diploma ProgrammeAcademic Honesty In The International Baccalaureate Diploma Programme
Academic Honesty In The International Baccalaureate Diploma ProgrammeClaire Webber
 
PDC Postcard October 2013
PDC Postcard October 2013PDC Postcard October 2013
PDC Postcard October 2013Chris Shade
 
Lakeside Middle School ESSA Presentation February 2018
Lakeside Middle School ESSA Presentation February 2018Lakeside Middle School ESSA Presentation February 2018
Lakeside Middle School ESSA Presentation February 2018Spike Cook
 

Similar to ISchool Report Card Summary of nformation (20)

SRC-DATA.pptx
SRC-DATA.pptxSRC-DATA.pptx
SRC-DATA.pptx
 
ISU - School information slideshow (English version)
ISU - School information slideshow (English version)ISU - School information slideshow (English version)
ISU - School information slideshow (English version)
 
Statistical Requirements of Educational Plan
Statistical Requirements of Educational PlanStatistical Requirements of Educational Plan
Statistical Requirements of Educational Plan
 
Report Card Presentation - Dec 11, 2018
Report Card Presentation - Dec 11, 2018Report Card Presentation - Dec 11, 2018
Report Card Presentation - Dec 11, 2018
 
School record
School recordSchool record
School record
 
Elixir2010
Elixir2010Elixir2010
Elixir2010
 
Pirie Open House 2015
Pirie Open House 2015Pirie Open House 2015
Pirie Open House 2015
 
Elixir2010
Elixir2010Elixir2010
Elixir2010
 
2nd-Quarter-School-Monitoring-Evaluation-Adjustment.pptx
2nd-Quarter-School-Monitoring-Evaluation-Adjustment.pptx2nd-Quarter-School-Monitoring-Evaluation-Adjustment.pptx
2nd-Quarter-School-Monitoring-Evaluation-Adjustment.pptx
 
School Readiness 2016
School Readiness 2016School Readiness 2016
School Readiness 2016
 
Elixir2010
Elixir2010Elixir2010
Elixir2010
 
Basic statistical tools in educational planning
Basic statistical tools in educational planningBasic statistical tools in educational planning
Basic statistical tools in educational planning
 
SMEA-4th-Quarter-2O23-last-edited.pptx
SMEA-4th-Quarter-2O23-last-edited.pptxSMEA-4th-Quarter-2O23-last-edited.pptx
SMEA-4th-Quarter-2O23-last-edited.pptx
 
Elixir2010
Elixir2010Elixir2010
Elixir2010
 
PISA 2018 Sneak Preview
PISA 2018 Sneak PreviewPISA 2018 Sneak Preview
PISA 2018 Sneak Preview
 
kalyong ES SBM
kalyong ES SBMkalyong ES SBM
kalyong ES SBM
 
Academic Honesty In The International Baccalaureate Diploma Programme
Academic Honesty In The International Baccalaureate Diploma ProgrammeAcademic Honesty In The International Baccalaureate Diploma Programme
Academic Honesty In The International Baccalaureate Diploma Programme
 
PDC Postcard October 2013
PDC Postcard October 2013PDC Postcard October 2013
PDC Postcard October 2013
 
Lakeside Middle School ESSA Presentation February 2018
Lakeside Middle School ESSA Presentation February 2018Lakeside Middle School ESSA Presentation February 2018
Lakeside Middle School ESSA Presentation February 2018
 
Coffee 11 13 15
Coffee 11 13 15Coffee 11 13 15
Coffee 11 13 15
 

More from Alain Odartseam

More from Alain Odartseam (7)

Pfmat book
Pfmat bookPfmat book
Pfmat book
 
Mother tongue powerpoint
Mother tongue  powerpointMother tongue  powerpoint
Mother tongue powerpoint
 
Learner enrollment-and-survey-form
Learner enrollment-and-survey-formLearner enrollment-and-survey-form
Learner enrollment-and-survey-form
 
AiP Strategic Planning
AiP Strategic PlanningAiP Strategic Planning
AiP Strategic Planning
 
2018 phil iri forms- customized
2018 phil iri forms- customized2018 phil iri forms- customized
2018 phil iri forms- customized
 
Ra 9184
Ra 9184Ra 9184
Ra 9184
 
Boiler water testing
Boiler water testingBoiler water testing
Boiler water testing
 

Recently uploaded

This PowerPoint helps students to consider the concept of infinity.
This PowerPoint helps students to consider the concept of infinity.This PowerPoint helps students to consider the concept of infinity.
This PowerPoint helps students to consider the concept of infinity.christianmathematics
 
SECOND SEMESTER TOPIC COVERAGE SY 2023-2024 Trends, Networks, and Critical Th...
SECOND SEMESTER TOPIC COVERAGE SY 2023-2024 Trends, Networks, and Critical Th...SECOND SEMESTER TOPIC COVERAGE SY 2023-2024 Trends, Networks, and Critical Th...
SECOND SEMESTER TOPIC COVERAGE SY 2023-2024 Trends, Networks, and Critical Th...KokoStevan
 
Class 11th Physics NEET formula sheet pdf
Class 11th Physics NEET formula sheet pdfClass 11th Physics NEET formula sheet pdf
Class 11th Physics NEET formula sheet pdfAyushMahapatra5
 
Introduction to Nonprofit Accounting: The Basics
Introduction to Nonprofit Accounting: The BasicsIntroduction to Nonprofit Accounting: The Basics
Introduction to Nonprofit Accounting: The BasicsTechSoup
 
1029 - Danh muc Sach Giao Khoa 10 . pdf
1029 -  Danh muc Sach Giao Khoa 10 . pdf1029 -  Danh muc Sach Giao Khoa 10 . pdf
1029 - Danh muc Sach Giao Khoa 10 . pdfQucHHunhnh
 
Grant Readiness 101 TechSoup and Remy Consulting
Grant Readiness 101 TechSoup and Remy ConsultingGrant Readiness 101 TechSoup and Remy Consulting
Grant Readiness 101 TechSoup and Remy ConsultingTechSoup
 
Seal of Good Local Governance (SGLG) 2024Final.pptx
Seal of Good Local Governance (SGLG) 2024Final.pptxSeal of Good Local Governance (SGLG) 2024Final.pptx
Seal of Good Local Governance (SGLG) 2024Final.pptxnegromaestrong
 
Nutritional Needs Presentation - HLTH 104
Nutritional Needs Presentation - HLTH 104Nutritional Needs Presentation - HLTH 104
Nutritional Needs Presentation - HLTH 104misteraugie
 
APM Welcome, APM North West Network Conference, Synergies Across Sectors
APM Welcome, APM North West Network Conference, Synergies Across SectorsAPM Welcome, APM North West Network Conference, Synergies Across Sectors
APM Welcome, APM North West Network Conference, Synergies Across SectorsAssociation for Project Management
 
Unit-IV; Professional Sales Representative (PSR).pptx
Unit-IV; Professional Sales Representative (PSR).pptxUnit-IV; Professional Sales Representative (PSR).pptx
Unit-IV; Professional Sales Representative (PSR).pptxVishalSingh1417
 
Holdier Curriculum Vitae (April 2024).pdf
Holdier Curriculum Vitae (April 2024).pdfHoldier Curriculum Vitae (April 2024).pdf
Holdier Curriculum Vitae (April 2024).pdfagholdier
 
Activity 01 - Artificial Culture (1).pdf
Activity 01 - Artificial Culture (1).pdfActivity 01 - Artificial Culture (1).pdf
Activity 01 - Artificial Culture (1).pdfciinovamais
 
Explore beautiful and ugly buildings. Mathematics helps us create beautiful d...
Explore beautiful and ugly buildings. Mathematics helps us create beautiful d...Explore beautiful and ugly buildings. Mathematics helps us create beautiful d...
Explore beautiful and ugly buildings. Mathematics helps us create beautiful d...christianmathematics
 
Unit-IV- Pharma. Marketing Channels.pptx
Unit-IV- Pharma. Marketing Channels.pptxUnit-IV- Pharma. Marketing Channels.pptx
Unit-IV- Pharma. Marketing Channels.pptxVishalSingh1417
 
Russian Escort Service in Delhi 11k Hotel Foreigner Russian Call Girls in Delhi
Russian Escort Service in Delhi 11k Hotel Foreigner Russian Call Girls in DelhiRussian Escort Service in Delhi 11k Hotel Foreigner Russian Call Girls in Delhi
Russian Escort Service in Delhi 11k Hotel Foreigner Russian Call Girls in Delhikauryashika82
 
Web & Social Media Analytics Previous Year Question Paper.pdf
Web & Social Media Analytics Previous Year Question Paper.pdfWeb & Social Media Analytics Previous Year Question Paper.pdf
Web & Social Media Analytics Previous Year Question Paper.pdfJayanti Pande
 

Recently uploaded (20)

This PowerPoint helps students to consider the concept of infinity.
This PowerPoint helps students to consider the concept of infinity.This PowerPoint helps students to consider the concept of infinity.
This PowerPoint helps students to consider the concept of infinity.
 
SECOND SEMESTER TOPIC COVERAGE SY 2023-2024 Trends, Networks, and Critical Th...
SECOND SEMESTER TOPIC COVERAGE SY 2023-2024 Trends, Networks, and Critical Th...SECOND SEMESTER TOPIC COVERAGE SY 2023-2024 Trends, Networks, and Critical Th...
SECOND SEMESTER TOPIC COVERAGE SY 2023-2024 Trends, Networks, and Critical Th...
 
Mehran University Newsletter Vol-X, Issue-I, 2024
Mehran University Newsletter Vol-X, Issue-I, 2024Mehran University Newsletter Vol-X, Issue-I, 2024
Mehran University Newsletter Vol-X, Issue-I, 2024
 
Class 11th Physics NEET formula sheet pdf
Class 11th Physics NEET formula sheet pdfClass 11th Physics NEET formula sheet pdf
Class 11th Physics NEET formula sheet pdf
 
Introduction to Nonprofit Accounting: The Basics
Introduction to Nonprofit Accounting: The BasicsIntroduction to Nonprofit Accounting: The Basics
Introduction to Nonprofit Accounting: The Basics
 
1029 - Danh muc Sach Giao Khoa 10 . pdf
1029 -  Danh muc Sach Giao Khoa 10 . pdf1029 -  Danh muc Sach Giao Khoa 10 . pdf
1029 - Danh muc Sach Giao Khoa 10 . pdf
 
INDIA QUIZ 2024 RLAC DELHI UNIVERSITY.pptx
INDIA QUIZ 2024 RLAC DELHI UNIVERSITY.pptxINDIA QUIZ 2024 RLAC DELHI UNIVERSITY.pptx
INDIA QUIZ 2024 RLAC DELHI UNIVERSITY.pptx
 
Código Creativo y Arte de Software | Unidad 1
Código Creativo y Arte de Software | Unidad 1Código Creativo y Arte de Software | Unidad 1
Código Creativo y Arte de Software | Unidad 1
 
Grant Readiness 101 TechSoup and Remy Consulting
Grant Readiness 101 TechSoup and Remy ConsultingGrant Readiness 101 TechSoup and Remy Consulting
Grant Readiness 101 TechSoup and Remy Consulting
 
Seal of Good Local Governance (SGLG) 2024Final.pptx
Seal of Good Local Governance (SGLG) 2024Final.pptxSeal of Good Local Governance (SGLG) 2024Final.pptx
Seal of Good Local Governance (SGLG) 2024Final.pptx
 
Nutritional Needs Presentation - HLTH 104
Nutritional Needs Presentation - HLTH 104Nutritional Needs Presentation - HLTH 104
Nutritional Needs Presentation - HLTH 104
 
APM Welcome, APM North West Network Conference, Synergies Across Sectors
APM Welcome, APM North West Network Conference, Synergies Across SectorsAPM Welcome, APM North West Network Conference, Synergies Across Sectors
APM Welcome, APM North West Network Conference, Synergies Across Sectors
 
Unit-IV; Professional Sales Representative (PSR).pptx
Unit-IV; Professional Sales Representative (PSR).pptxUnit-IV; Professional Sales Representative (PSR).pptx
Unit-IV; Professional Sales Representative (PSR).pptx
 
Holdier Curriculum Vitae (April 2024).pdf
Holdier Curriculum Vitae (April 2024).pdfHoldier Curriculum Vitae (April 2024).pdf
Holdier Curriculum Vitae (April 2024).pdf
 
Activity 01 - Artificial Culture (1).pdf
Activity 01 - Artificial Culture (1).pdfActivity 01 - Artificial Culture (1).pdf
Activity 01 - Artificial Culture (1).pdf
 
Explore beautiful and ugly buildings. Mathematics helps us create beautiful d...
Explore beautiful and ugly buildings. Mathematics helps us create beautiful d...Explore beautiful and ugly buildings. Mathematics helps us create beautiful d...
Explore beautiful and ugly buildings. Mathematics helps us create beautiful d...
 
Unit-IV- Pharma. Marketing Channels.pptx
Unit-IV- Pharma. Marketing Channels.pptxUnit-IV- Pharma. Marketing Channels.pptx
Unit-IV- Pharma. Marketing Channels.pptx
 
Russian Escort Service in Delhi 11k Hotel Foreigner Russian Call Girls in Delhi
Russian Escort Service in Delhi 11k Hotel Foreigner Russian Call Girls in DelhiRussian Escort Service in Delhi 11k Hotel Foreigner Russian Call Girls in Delhi
Russian Escort Service in Delhi 11k Hotel Foreigner Russian Call Girls in Delhi
 
Advance Mobile Application Development class 07
Advance Mobile Application Development class 07Advance Mobile Application Development class 07
Advance Mobile Application Development class 07
 
Web & Social Media Analytics Previous Year Question Paper.pdf
Web & Social Media Analytics Previous Year Question Paper.pdfWeb & Social Media Analytics Previous Year Question Paper.pdf
Web & Social Media Analytics Previous Year Question Paper.pdf
 

ISchool Report Card Summary of nformation

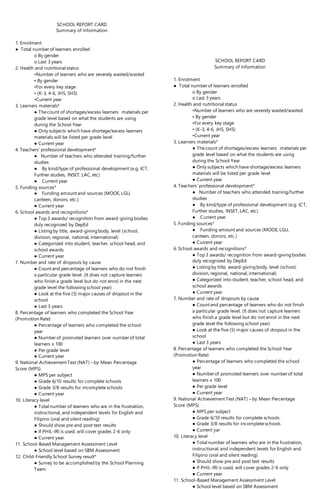
  • 1. SCHOOL REPORT CARD Summary of Information 1. Enrolment ● Total number of learners enrolled o By gender o Last 3 years 2. Health and nutritional status •Number of learners who are severely wasted/wasted • By gender •For every key stage • (K-3, 4-6, JHS, SHS) •Current year 3. Learners materials* ● Thecount of shortages/excess learners materials per grade level based on what the students are using during the School Year ● Only subjects which have shortage/excess learners materials will be listed per grade level ● Current year 4. Teachers’ professional development* ● Number of teachers who attended training/further studies ● By kind/type of professional development (e.g. ICT, Further studies, INSET, LAC, etc) ● Current year 5. Funding sources* ● Funding amount and sources (MOOE, LGU, canteen, donors, etc.) ● Current year 6. School awards and recognitions* ● Top 3 awards/ recognition from award-giving bodies duly recognized by DepEd ● Listing by title, award-giving body, level (school, division, regional, national, international) ● Categorized into student, teacher, school head, and school awards ● Current year 7. Number and rate of dropouts by cause ● Count and percentage of learners who do not finish a particular grade level. (It does not capture learners who finish a grade level but do not enrol in the next grade level the following school year) ● Look at the five (5) major causes of dropout in the school ● Last 3 years 8. Percentage of learners who completed the School Year (Promotion Rate) ● Percentage of learners who completed the school year ● Number of promoted learners over number of total learners x 100 ● Per grade level ● Current year 9. National Achievement Test (NAT) – by Mean Percentage Score (MPS) ● MPS per subject ● Grade 6/10 results for complete schools ● Grade 3/8 results for incompleteschools ● Current year 10. Literacy level ● Total number of learners who are in the frustration, instructional, and independent levels for English and Filipino (oral and silent reading) ● Should show pre and post test results ● If PHIL-IRI is used, will cover grades 2-6 only ● Current year 11. School-Based Management Assessment Level ● School level based on SBM Assessment 12. Child-Friendly School Survey result* ● Survey to be accomplished by the School Planning Team ● Based on CFSS point system: o 25-29 points: Child-Friendly School SCHOOL REPORT CARD Summary of Information 1. Enrolment ● Total number of learners enrolled o By gender o Last 3 years 2. Health and nutritional status •Number of learners who are severely wasted/wasted • By gender •For every key stage • (K-3, 4-6, JHS, SHS) •Current year 3. Learners materials* ● Thecount of shortages/excess learners materials per grade level based on what the students are using during the School Year ● Only subjects which have shortage/excess learners materials will be listed per grade level ● Current year 4. Teachers’ professional development* ● Number of teachers who attended training/further studies ● By kind/type of professional development (e.g. ICT, Further studies, INSET, LAC, etc) ● Current year 5. Funding sources* ● Funding amount and sources (MOOE, LGU, canteen, donors, etc.) ● Current year 6. School awards and recognitions* ● Top 3 awards/ recognition from award-giving bodies duly recognized by DepEd ● Listing by title, award-giving body, level (school, division, regional, national, international) ● Categorized into student, teacher, school head, and school awards ● Current year 7. Number and rate of dropouts by cause ● Count and percentage of learners who do not finish a particular grade level. (It does not capture learners who finish a grade level but do not enrol in the next grade level the following school year) ● Look at the five (5) major causes of dropout in the school ● Last 3 years 8. Percentage of learners who completed the School Year (Promotion Rate) ● Percentage of learners who completed the school year ● Number of promoted learners over number of total learners x 100 ● Per grade level ● Current year 9. National Achievement Test (NAT) – by Mean Percentage Score (MPS) ● MPS per subject ● Grade 6/10 results for complete schools ● Grade 3/8 results for incompleteschools ● Current yar 10. Literacy level ● Total number of learners who are in the frustration, instructional, and independent levels for English and Filipino (oral and silent reading) ● Should show pre and post test results ● If PHIL-IRI is used, will cover grades 2-6 only ● Current year 11. School-Based Management Assessment Level ● School level based on SBM Assessment
  • 2. SCHOOL REPORT CARD Summary of Information Cont. o 35 and above points: Very Outstanding Child- Friendly School ● Current year 13. Stakeholders’ participation* There will be two (2) data sets: 1.Percentage (number of attendees over those invited) of parents/guardians and other stakeholders who attend during: o Co-curricular activities (Science month, Reading month, contests, etc.) o Extra-curricular activities (Boy Scouts, Brigada Eskwela, sports fests, etc.) o Meetings and Assemblies (SIP, CI, General PTA, etc.) • Current year 2.Total contribution (in kind, man-hours, etc.) of stakeholders which are accounted •Current year •By reporting period (Mid-year and Year-end) 14. Learner-Teacher ratio ● Comparison of the actual ratio of learners to teachers against the standard: o Kinder (25:1) o Grades 1 & 2 (40:1) o Grades 3 to 10 (45:1) o SHS (40:1) ●Per grade level ● Current year 15. Learner-Classroom ratio ● Comparison of the actual ratio of learners to classrooms against the standard: o Kinder (25:1) o Grades 1 & 2 (40:1) o Grades 3 to 10 (45:1) o SHS (40:1) ● Per grade level ● Current year 16. Learner-Toilet ratio •Comparison of the actual ratio of learners to functional toilets against standards (50:1) •Total number •By gender •Current year 17. Learner-Seat ratio ● Comparison of the actual ratio of learners to seats against the standard (1:1) ● Total number ● Current year 18. Status of Annual Implementation Plan (AIP)/Continuous Improvement (CI) Projects* ● Theprogress of CI projects ● Data sets may differ depending on what the school wants to present ● Current year 19. Other stakeholders’ accomplishments* ● Reports done by other stakeholders on their initiatives/activities independent from the PIA/CI projects (e.g. activities of the SGC, SPG/SSG, etc.) ● Data sets may differ depending on the SCHOOL REPORT CARD Summary of Information Cont. o 35 and above points: Very Outstanding Child- Friendly School ● Current year 13. Stakeholders’ participation* There will be two (2) data sets: 1.Percentage (number of attendees over those invited) of parents/guardians and other stakeholders who attend during: o Co-curricular activities (Science month, Reading month, contests, etc.) o Extra-curricular activities (Boy Scouts, Brigada Eskwela, sports fests, etc.) o Meetings and Assemblies (SIP, CI, General PTA, etc.) • Current year 2.Total contribution (in kind, man-hours, etc.) of stakeholders which are accounted •Current year •By reporting period (Mid-year and Year-end) 14. Learner-Teacher ratio ● Comparison of the actual ratio of learners to teachers against the standard: o Kinder (25:1) o Grades 1 & 2 (40:1) o Grades 3 to 10 (45:1) o SHS (40:1) ●Per grade level ● Current year 15. Learner-Classroom ratio ● Comparison of the actual ratio of learners to classrooms against the standard: o Kinder (25:1) o Grades 1 & 2 (40:1) o Grades 3 to 10 (45:1) o SHS (40:1) ● Per grade level ● Current year 16. Learner-Toilet ratio •Comparison of the actual ratio of learners to functional toilets against standards (50:1) •Total number •By gender •Current year 17. Learner-Seat ratio ● Comparison of the actual ratio of learners to seats against the standard (1:1) ● Total number ● Current year 18. Status of Annual Implementation Plan (AIP)/Continuous Improvement (CI) Projects* ● Theprogress of CI projects ● Data sets may differ depending on what the school wants to present