SlideShare a Scribd company logo
1 of 6
Download to read offline
-------------------------

     PRESS RELEASE

    Contact: Belle Lenz

    Belle.lenz@mbww.com

    212-883-4791

    Friday 18 January 2013


    MAGNA GLOBAL US Update: TV Advertising Market Will Struggle in Post-Election &
    Olympics Year

    Core Media Owners Advertising Revenues are Expected to Grow by +0.6% (+2.7% ex-P&O)

    Growth in Digital Media and Mobile Advertising Predicted to Offset Revenue Declines in Television, Print
    and Radio


    Key points
   US core media owners advertising revenues grew +4.7% in 2012 to $153.4bn.

    Excluding record levels of incremental revenues generated by non-recurring events - Olympics ($640m)
    and Political ($2.8bn) (P&O) – the underlying growth was a more modest +2.7%.

    Digital media grew by +14.4% with online video reaching $2bn in advertising revenue and mobile
    advertising doubling in size to $3bn.

    For 2013, amidst slow economic recovery and a tough comparison, core media owners advertising revenues
    are expected to grow by +0.6% (still +2.7% ex-P&O).

   Television revenues will decline by -3.0% (compared to -1.4% previously forecast).

    Growth in digital media (+14.2%) and mobile advertising (+55.0%) will offset revenue declines in
    television, print and radio.


    2012: record Political spending drove market
    growth to +4.7% (+2.7% without P&O)
MAGNA GLOBAL has adjusted its 2012 estimates and revised its 2013 forecasts for the US advertising
market. Excluding the incremental revenues derived from Political and Olympic ad spending, core media
owners ad revenues grew by +2.7% in 2012.

Digital media remained strong (+14.4% to $36.3bn) driven by mobile advertising (up more than 80% to
nearly $3bn) and search (+18.4% excluding mobile, to $17.5bn). Traditional banner display formats had
minimal growth (+1.5% to $13.7bn) due to price declines. Online video also experienced price decreases in
2012 as the difference between online video (e.g. Hulu) and broadcast TV costs narrowed significantly; a
continued increase of supply and consumption of online video content led, however, to another year of
double-digit growth (+15.0% to $2.1bn). Overall, digital media represents 23.7% of core media advertising
in the US, which is now bigger than newspapers and magazines combined. However, in some of the most
advanced European markets (e.g. UK) digital media already controls more than 30% of total advertising,
suggesting there is still room for growth in the US too.


The various segments of television experienced widely contrasted trends in 2012. English-speaking national
TV networks advertising revenues decreased -2.6% to $13.1bn on a normalized basis, but increased +2.2%
if factoring in $640m of non-recurring Olympic ad spend. National cable television keeps gaining audience
share and advertising revenues from broadcast networks, as it grew by +5.1% to $23.1bn. National cable
represents 59% of total national television, compared to 40% in 2001, against 33% for English-Speaking
national broadcast networks, 3% for Spanish-speaking broadcast networks and 5% for syndication. Total
national television advertising (cable and broadcast, ex-P&O) increased +2.4%. Local TV media owner
revenues increased +1.5% (ex-P&O) to $19.8bn as the media benefited from a healthy automotive market.


Print advertising was challenged throughout the year. Ad pages were down almost 8% in magazines. On a
full-year basis we estimate revenues to have dropped by -6.8% for magazines and -6.5% for newspapers.
Outdoor advertising grew by +4.6%, in line with expectations, driven by the rise of digital inventory and
helped by political advertising in 3Q and 4Q. Broadcast and satellite radio (excluding digital) grew
modestly +0.6% to $15.3bn with satellite advertising growing faster than local and network radio. In
addition, radio media owners derived half a billion dollars of ad revenues from online activities (+7%) but
that only represents 3% of their total advertising revenues.


As anticipated by MAGNA GLOBAL, the cyclical Political and Olympics (P&O) spending hit record levels
and generated incremental advertising revenues of $2.8bn and $640m, respectively. The political spending
was 32% higher than in the last political cycle (2010, the first year affected by the Citizen United decision)
and 62% higher than in the previous Presidential election year (2008). Including these non-recurring
incremental revenues, local TV was up +13.4% to $22.6bn, total television was up +7.2% to $62.7bn and
total core media advertising was up +4.7% to $153.4bn. This is an average performance for a quadrennial
year: four years ago in 2008, the quadrennial boost was not nearly enough to offset the impact of economic
recession (-5.2%) but 2000 and 2004 were up by 11% and 7% respectively.


2013: healthy corporations will keep investing in
their brands despite slow economic growth (+0.6%
growth for core media, +2.7% without P&O)
Consistent with our previous update in October, the economic prospects for 2013 continue to point to a slow
recovery. The latest economic indicators have been mixed. Real GDP is now expected by the Survey of
Professional Forecasters (SPF) to increase by +2.0% (i.e. the same rate as 2012, a decrease of -0.1%
compared to summer expectations). Nominal GDP is expected to increase +4.0%. Of the two economic
indicators that we find more directly influential in our modeling of media owners advertising revenue levels,
real Personal Consumer Expenditure (PCE) is forecast to grow +2.1% (in line with previous forecasts) but
Industrial Production is expected to grow by only +2.4%, -0.5% slower than expected previously (+2.9%),
and slowing down from +3.7% growth in 2012.


Consumer confidence dipped in December to 72.9 (down from 82.7 in November) but most of the decrease
was likely due to the anxiety surrounding the “fiscal cliff”, so we expect the index to gradually return to the
80s if the debt ceiling deadline is met in February and the uncertainty created by the “fiscal cliff”
discussions are finally put behind us. Employment is still slowly improving as 155,000 new jobs were
created in December, in line with the average monthly gain of 2012, but that was not enough to change the
7.8% unemployment rate. More than twelve million Americans are still without a job.


On the bright side, most US companies are financially healthy and have the capability to keep investing in
marketing and communication. Corporate profitability after tax is expected to grow by +5.7% in 2013,
which is less than previously expected by the SPF (+6.9%) but still accelerating from +2.9% in 2012.


Under these conditions, MAGNA GLOBAL has reduced its top line 2013 growth forecast – for total
normalized media spend (excluding P&O, including direct marketing) - from +1.3% to +1.0%. This
assumes that the debt ceiling discussion in February will be successful, and that economic prospects remain
on track, so that marketers will feel confident enough to plan some increase of their marketing budgets in the
spring. Direct marketing categories are expected to decline again, but core media advertising (TV, Print,
Internet, OOH, radio) will outperform the trend at +2.7% (October forecast: +2.8%) and thus continue
to grow at a similar underlying rate as in 2012.


National television is the category we have revised most significantly, down to +2.1% from +4.8% in
October. Since the beginning of the broadcast season in September, the scatter market prices have showed
very little “premium” over the upfront CPM inflation despite the fact that primetime ratings have been
weaker than expected (-5% for broadcast networks, -2% for cable networks, on adults 18-49, including
sports) and broadcasters had to serve extra spots to meet their guaranteed impact. That unusual pattern
reveals weak demand. As a result, national broadcast revenues (ex P&O) were down by -5.5% in the second
half of 2012 and we expect a similar softness throughout the first part of 2013. English-speaking national
network TV will be impacted the most from this trend, with revenues decreasing by -6.4% (or -1.8% ex-
P&O) in 2013. National cable will continue to benefit from better ratings and gain market share from
broadcast: revenues will thus grow +4.0%. Local TV is forecast to grow +1.4% on a normalized basis and
drop -9.1% when including (the lack of) Political advertising. Overall, television media owners ad revenues
are now expected to decrease by -3.0% in 2013 (local and national, broadcast and cable, incl. P&O).

Digital media is largely unaffected by cyclical spending and will continue to grow double-digits in 2013
(+14.2% to $41.5bn) with mobile advertising alone growing +55% to $4.5bn.


Vincent Letang, EVP, Director of Global Forecasting said: “The concept of mobile advertising started
with smartphones but tablets are changing everything, rapidly establishing themselves as universal media
players (TV programmes, movies, radio, news, magazines) in a way never achieved through “personal”
computers. By their versatility and user-friendliness, tablets are increasing digital media usage and
redefining social media, online video and e-commerce. Their influence will be felt far beyond on-the-go
media usage as a growing proportion of that happens in the home. Part of that usage is cannibalizing media
time spent on desktops and laptops, but tablets bring incremental media exposure, partly through
multitasking” . This new environment creates new opportunities as well as challenges for marketers and
media owners. Despite the complexities in the ecosystem, the difficult upgrade of media measurement and
the painful redefinition of many business models, MAGNA GLOBAL believes we have only scratched the
surface of this new world: advertising on mobile devices is forecast to grow to $11.5bn in the next five years
and by 2017 it will represent 18% of total digital advertising and 6% of total media advertising in the US*.


Elsewhere we anticipate “paper-based” print media advertising revenues to decrease at a higher rate in 2013:
-7.9% for newspapers and -7.3% for magazines. Newspaper readership decline is likely to accelerate.
Magazines have more loyal readers but are struggling in the face of advertisers transferring part of their
budgets online and on air. Core categories (fashion, beauty, pharmaceutical) remain loyal but other
important categories (auto, technology, travel and finance) are increasing exploring cheaper alternatives on
television and digital media. Meanwhile, publishers are experimenting with tablet editions without deriving
any significant incremental advertising revenue yet. Radio advertising will experience a mild decline in
2013 (-0.5%), while outdoor media will be the only traditional media category to show some growth
(+3.6%).

In terms of spending categories, MAGNA GLOBAL is expecting technology, personal care and retail to be
positive, while ad spend from pharmaceuticals and food will show little or no growth.

In our long term forecast, we predict media owners ad revenues to accelerate over the next three years: 2014
(+3.1% excl. P&O) 2015 (+4.2%) and 2015 (+4.6%) as the economy gradually improves.

The next update of MAGNA GLOBAL’s US Advertising Forecasts will be published in April 2013.


*More insights on mobile advertising in MAGNA GLOBAL’s latest Media Economy Report: “The Ultimate
Mobile Deep Dive” published earlier in January. The full report is available for download here.
KEY FORECASTS


US Media Owners Advertising Revenues: growth forecasts by media category (incl.
P&O)

                                                                                                     2013E
                                               2011A             2012E              2013E
                                                                                                     (Oct. '12)
Total TV (incl. P&O)                           1.3%              7.2%               -3.0%            -1.4%
Internet                                       21.9%             14.4%              14.2%            11.7%
Newspapers                                     -9.2%             -6.5%              -7.9%            -7.4%
Magazines                                      -0.5%             -6.8%              -7.3%            -7.1%
Radio                                          -0.5%             0.6%               -0.5%            -0.6%
OOH                                            4.0%              4.6%               3.6%             3.9%
Total Core Media (incl. P&O)                   3.2%              4.7%               0.6%             0.8%
Directories                                    -20.2%            -23.5%             -25.4%           -25.6%
Direct Mail                                    -0.9%             -5.9%              -6.5%            -4.3%
Total Incl. DM                                 1.7%              2.6%               -0.8%            -0.4%


                                                                                 Source: MAGNA GLOBAL, January 2013


Summary of top line indicators 2012-2013

2012E                                          Incl. P&O        Ex P&O
Core Media (ex. DM) ($bn)                      $153.4           $150.0
  growth                                       4.7%             2.7%
  previous forecast (Oct 2012)                 4.6%             2.6%
Total Media (incl. DM) ($bn)                   $176.8           $173.4
  growth                                       2.6%             0.8%
  previous forecast (Oct 2012)                 2.7%             0.9%


2013E                                          Incl. P&O        Ex P&O
Core Media (ex. DM) ($bn)                      $154.4           $154.0
  growth                                       0.6%             2.7%
  previous forecast (Oct 2012)                 0.8%             2.8%
Total Media (incl. DM) ($bn)                   $175.4           $175.0
  growth                                       -0.8%            1.0%
  previous forecast (Oct 2012)                 -0.4%            1.3%
                                                                Source: MAGNA GLOBAL, January 2013
Notes
DM = Direct Marketing (traditional directories, direct mail).
P&O = Incremental Political and Olympic Advertising.


Long term forecasts 2004-2017

Normalized ad revenues excl. DM, excl. P&O

          2004     2005        2006    2007      2008      2009          2010     2011       2012     2013        2014    2015    2016    2017
Total     151.6    159.9       165.0   167.5     156.8     133.3         139.3    146.1      150.0    154.0       158.8   165.5   173.1   181.0
change    6.0%     5.4%        3.2%    1.5%      -6.4%     -15.0%        4.5%     4.9%       2.7%     2.7%        3.1%    4.2%    4.6%    4.6%
Source: MAGNA GLOBAL, January 2013


About MAGNA GLOBAL Advertising Forecasts

For more than 40 years, MAGNA GLOBAL forecasts have been the industry’s leading source for
measuring and forecasting advertising revenues. MAGNA GLOBAL forecasts media owners’
advertising revenues in the US and around the world through financial analyses of media
companies’ public filings, government reports, trade association data and local market expertise.
MAGNA GLOBAL’s new methodology was introduced to the industry in 2009 and has redefined
measurement for the advertising-supported media economy, delivering unparalleled authority and
accuracy. Our US Advertising Revenue Forecast study includes detailed data for more than
40 categories of media on a quarterly basis from 1990 to 2013 and on an annual basis from 1980 to
2017, updated quarterly. Detailed data in excel format is available to MAGNA GLOBAL
subscribers. Please contact vincent.letang@magnaglobal.com for further details.


About MAGNA GLOBAL

MAGNA GLOBAL is the strategic global media unit of Interpublic Group, driving forecasts,
insights and negotiation strategy across all media channels. The MAGNAGLOBAL Intelligence
Unit delivers the industry’s most accurate and authoritative forecast of media value. The MAGNA
GLOBAL Investment Unit harnesses $30 billion of Mediabrands global media billings. Follow us
on Twitter for updates @MAGNAGLOBAL.

More Related Content

More from Brian Crotty

Babelfish articles oct 16 mar 17 28-3-17 redux
Babelfish articles oct 16 mar 17 28-3-17 reduxBabelfish articles oct 16 mar 17 28-3-17 redux
Babelfish articles oct 16 mar 17 28-3-17 reduxBrian Crotty
 
Ebit - Buscape- #34 webshoppers english 2016
Ebit - Buscape- #34 webshoppers english 2016Ebit - Buscape- #34 webshoppers english 2016
Ebit - Buscape- #34 webshoppers english 2016Brian Crotty
 
MMA global mobile trends report 2016
MMA global mobile trends report 2016MMA global mobile trends report 2016
MMA global mobile trends report 2016Brian Crotty
 
Winterberry group the state of consumer data onboarding november 2016
Winterberry group   the state of consumer data onboarding november 2016Winterberry group   the state of consumer data onboarding november 2016
Winterberry group the state of consumer data onboarding november 2016Brian Crotty
 
Delloite tech trends 2016
Delloite  tech trends 2016Delloite  tech trends 2016
Delloite tech trends 2016Brian Crotty
 
MEC CES 2017-key-takeaways-and-trends-final
MEC CES 2017-key-takeaways-and-trends-finalMEC CES 2017-key-takeaways-and-trends-final
MEC CES 2017-key-takeaways-and-trends-finalBrian Crotty
 
Mindshare trends 2017
Mindshare trends 2017Mindshare trends 2017
Mindshare trends 2017Brian Crotty
 
Kantar-millward-brown Media and-digital-predictions 2017
Kantar-millward-brown Media and-digital-predictions 2017Kantar-millward-brown Media and-digital-predictions 2017
Kantar-millward-brown Media and-digital-predictions 2017Brian Crotty
 
Edelman-digital trends 2017
Edelman-digital trends 2017Edelman-digital trends 2017
Edelman-digital trends 2017Brian Crotty
 
Carats top 10 trends 2016
Carats top 10 trends 2016Carats top 10 trends 2016
Carats top 10 trends 2016Brian Crotty
 
Babelfish Articles Jan-Sep 2016 12-09-16 final
Babelfish Articles Jan-Sep 2016  12-09-16 finalBabelfish Articles Jan-Sep 2016  12-09-16 final
Babelfish Articles Jan-Sep 2016 12-09-16 finalBrian Crotty
 
Comscore Global+future+in+focus por2
Comscore Global+future+in+focus por2Comscore Global+future+in+focus por2
Comscore Global+future+in+focus por2Brian Crotty
 
eBit Web shoppers 32a edição
eBit Web shoppers 32a ediçãoeBit Web shoppers 32a edição
eBit Web shoppers 32a ediçãoBrian Crotty
 
JWT The future-100-­-trends-and-change-to-watch-in-2016
JWT The future-100-­-trends-and-change-to-watch-in-2016JWT The future-100-­-trends-and-change-to-watch-in-2016
JWT The future-100-­-trends-and-change-to-watch-in-2016Brian Crotty
 
Babelfish Articles July-Dec 2015 10-12-15
Babelfish Articles July-Dec 2015 10-12-15Babelfish Articles July-Dec 2015 10-12-15
Babelfish Articles July-Dec 2015 10-12-15Brian Crotty
 
Babelfish Articles #12 Jan-June 2015
Babelfish Articles #12 Jan-June 2015Babelfish Articles #12 Jan-June 2015
Babelfish Articles #12 Jan-June 2015Brian Crotty
 
Nielsen / IAB - Digital video-and-tv-advertising-viewing-budget-share-shift-a...
Nielsen / IAB - Digital video-and-tv-advertising-viewing-budget-share-shift-a...Nielsen / IAB - Digital video-and-tv-advertising-viewing-budget-share-shift-a...
Nielsen / IAB - Digital video-and-tv-advertising-viewing-budget-share-shift-a...Brian Crotty
 
Winterberry & USA IAB - Marketing data white paper Jan 2015
Winterberry & USA IAB - Marketing data white paper Jan 2015Winterberry & USA IAB - Marketing data white paper Jan 2015
Winterberry & USA IAB - Marketing data white paper Jan 2015Brian Crotty
 
Ford 2015-trend report book Jan 2015
Ford 2015-trend report book Jan 2015Ford 2015-trend report book Jan 2015
Ford 2015-trend report book Jan 2015Brian Crotty
 

More from Brian Crotty (20)

Babelfish articles oct 16 mar 17 28-3-17 redux
Babelfish articles oct 16 mar 17 28-3-17 reduxBabelfish articles oct 16 mar 17 28-3-17 redux
Babelfish articles oct 16 mar 17 28-3-17 redux
 
Ebit - Buscape- #34 webshoppers english 2016
Ebit - Buscape- #34 webshoppers english 2016Ebit - Buscape- #34 webshoppers english 2016
Ebit - Buscape- #34 webshoppers english 2016
 
MMA global mobile trends report 2016
MMA global mobile trends report 2016MMA global mobile trends report 2016
MMA global mobile trends report 2016
 
Fjord trends 2017
Fjord trends 2017Fjord trends 2017
Fjord trends 2017
 
Winterberry group the state of consumer data onboarding november 2016
Winterberry group   the state of consumer data onboarding november 2016Winterberry group   the state of consumer data onboarding november 2016
Winterberry group the state of consumer data onboarding november 2016
 
Delloite tech trends 2016
Delloite  tech trends 2016Delloite  tech trends 2016
Delloite tech trends 2016
 
MEC CES 2017-key-takeaways-and-trends-final
MEC CES 2017-key-takeaways-and-trends-finalMEC CES 2017-key-takeaways-and-trends-final
MEC CES 2017-key-takeaways-and-trends-final
 
Mindshare trends 2017
Mindshare trends 2017Mindshare trends 2017
Mindshare trends 2017
 
Kantar-millward-brown Media and-digital-predictions 2017
Kantar-millward-brown Media and-digital-predictions 2017Kantar-millward-brown Media and-digital-predictions 2017
Kantar-millward-brown Media and-digital-predictions 2017
 
Edelman-digital trends 2017
Edelman-digital trends 2017Edelman-digital trends 2017
Edelman-digital trends 2017
 
Carats top 10 trends 2016
Carats top 10 trends 2016Carats top 10 trends 2016
Carats top 10 trends 2016
 
Babelfish Articles Jan-Sep 2016 12-09-16 final
Babelfish Articles Jan-Sep 2016  12-09-16 finalBabelfish Articles Jan-Sep 2016  12-09-16 final
Babelfish Articles Jan-Sep 2016 12-09-16 final
 
Comscore Global+future+in+focus por2
Comscore Global+future+in+focus por2Comscore Global+future+in+focus por2
Comscore Global+future+in+focus por2
 
eBit Web shoppers 32a edição
eBit Web shoppers 32a ediçãoeBit Web shoppers 32a edição
eBit Web shoppers 32a edição
 
JWT The future-100-­-trends-and-change-to-watch-in-2016
JWT The future-100-­-trends-and-change-to-watch-in-2016JWT The future-100-­-trends-and-change-to-watch-in-2016
JWT The future-100-­-trends-and-change-to-watch-in-2016
 
Babelfish Articles July-Dec 2015 10-12-15
Babelfish Articles July-Dec 2015 10-12-15Babelfish Articles July-Dec 2015 10-12-15
Babelfish Articles July-Dec 2015 10-12-15
 
Babelfish Articles #12 Jan-June 2015
Babelfish Articles #12 Jan-June 2015Babelfish Articles #12 Jan-June 2015
Babelfish Articles #12 Jan-June 2015
 
Nielsen / IAB - Digital video-and-tv-advertising-viewing-budget-share-shift-a...
Nielsen / IAB - Digital video-and-tv-advertising-viewing-budget-share-shift-a...Nielsen / IAB - Digital video-and-tv-advertising-viewing-budget-share-shift-a...
Nielsen / IAB - Digital video-and-tv-advertising-viewing-budget-share-shift-a...
 
Winterberry & USA IAB - Marketing data white paper Jan 2015
Winterberry & USA IAB - Marketing data white paper Jan 2015Winterberry & USA IAB - Marketing data white paper Jan 2015
Winterberry & USA IAB - Marketing data white paper Jan 2015
 
Ford 2015-trend report book Jan 2015
Ford 2015-trend report book Jan 2015Ford 2015-trend report book Jan 2015
Ford 2015-trend report book Jan 2015
 

Magna Global: US Update Jan 2013

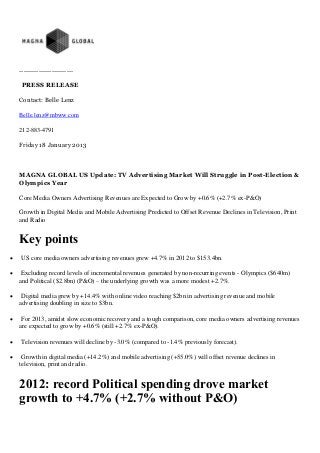
  • 1. ------------------------- PRESS RELEASE Contact: Belle Lenz Belle.lenz@mbww.com 212-883-4791 Friday 18 January 2013 MAGNA GLOBAL US Update: TV Advertising Market Will Struggle in Post-Election & Olympics Year Core Media Owners Advertising Revenues are Expected to Grow by +0.6% (+2.7% ex-P&O) Growth in Digital Media and Mobile Advertising Predicted to Offset Revenue Declines in Television, Print and Radio Key points  US core media owners advertising revenues grew +4.7% in 2012 to $153.4bn.  Excluding record levels of incremental revenues generated by non-recurring events - Olympics ($640m) and Political ($2.8bn) (P&O) – the underlying growth was a more modest +2.7%.  Digital media grew by +14.4% with online video reaching $2bn in advertising revenue and mobile advertising doubling in size to $3bn.  For 2013, amidst slow economic recovery and a tough comparison, core media owners advertising revenues are expected to grow by +0.6% (still +2.7% ex-P&O).  Television revenues will decline by -3.0% (compared to -1.4% previously forecast).  Growth in digital media (+14.2%) and mobile advertising (+55.0%) will offset revenue declines in television, print and radio. 2012: record Political spending drove market growth to +4.7% (+2.7% without P&O)
  • 2. MAGNA GLOBAL has adjusted its 2012 estimates and revised its 2013 forecasts for the US advertising market. Excluding the incremental revenues derived from Political and Olympic ad spending, core media owners ad revenues grew by +2.7% in 2012. Digital media remained strong (+14.4% to $36.3bn) driven by mobile advertising (up more than 80% to nearly $3bn) and search (+18.4% excluding mobile, to $17.5bn). Traditional banner display formats had minimal growth (+1.5% to $13.7bn) due to price declines. Online video also experienced price decreases in 2012 as the difference between online video (e.g. Hulu) and broadcast TV costs narrowed significantly; a continued increase of supply and consumption of online video content led, however, to another year of double-digit growth (+15.0% to $2.1bn). Overall, digital media represents 23.7% of core media advertising in the US, which is now bigger than newspapers and magazines combined. However, in some of the most advanced European markets (e.g. UK) digital media already controls more than 30% of total advertising, suggesting there is still room for growth in the US too. The various segments of television experienced widely contrasted trends in 2012. English-speaking national TV networks advertising revenues decreased -2.6% to $13.1bn on a normalized basis, but increased +2.2% if factoring in $640m of non-recurring Olympic ad spend. National cable television keeps gaining audience share and advertising revenues from broadcast networks, as it grew by +5.1% to $23.1bn. National cable represents 59% of total national television, compared to 40% in 2001, against 33% for English-Speaking national broadcast networks, 3% for Spanish-speaking broadcast networks and 5% for syndication. Total national television advertising (cable and broadcast, ex-P&O) increased +2.4%. Local TV media owner revenues increased +1.5% (ex-P&O) to $19.8bn as the media benefited from a healthy automotive market. Print advertising was challenged throughout the year. Ad pages were down almost 8% in magazines. On a full-year basis we estimate revenues to have dropped by -6.8% for magazines and -6.5% for newspapers. Outdoor advertising grew by +4.6%, in line with expectations, driven by the rise of digital inventory and helped by political advertising in 3Q and 4Q. Broadcast and satellite radio (excluding digital) grew modestly +0.6% to $15.3bn with satellite advertising growing faster than local and network radio. In addition, radio media owners derived half a billion dollars of ad revenues from online activities (+7%) but that only represents 3% of their total advertising revenues. As anticipated by MAGNA GLOBAL, the cyclical Political and Olympics (P&O) spending hit record levels and generated incremental advertising revenues of $2.8bn and $640m, respectively. The political spending was 32% higher than in the last political cycle (2010, the first year affected by the Citizen United decision) and 62% higher than in the previous Presidential election year (2008). Including these non-recurring incremental revenues, local TV was up +13.4% to $22.6bn, total television was up +7.2% to $62.7bn and total core media advertising was up +4.7% to $153.4bn. This is an average performance for a quadrennial year: four years ago in 2008, the quadrennial boost was not nearly enough to offset the impact of economic recession (-5.2%) but 2000 and 2004 were up by 11% and 7% respectively. 2013: healthy corporations will keep investing in their brands despite slow economic growth (+0.6% growth for core media, +2.7% without P&O) Consistent with our previous update in October, the economic prospects for 2013 continue to point to a slow recovery. The latest economic indicators have been mixed. Real GDP is now expected by the Survey of
  • 3. Professional Forecasters (SPF) to increase by +2.0% (i.e. the same rate as 2012, a decrease of -0.1% compared to summer expectations). Nominal GDP is expected to increase +4.0%. Of the two economic indicators that we find more directly influential in our modeling of media owners advertising revenue levels, real Personal Consumer Expenditure (PCE) is forecast to grow +2.1% (in line with previous forecasts) but Industrial Production is expected to grow by only +2.4%, -0.5% slower than expected previously (+2.9%), and slowing down from +3.7% growth in 2012. Consumer confidence dipped in December to 72.9 (down from 82.7 in November) but most of the decrease was likely due to the anxiety surrounding the “fiscal cliff”, so we expect the index to gradually return to the 80s if the debt ceiling deadline is met in February and the uncertainty created by the “fiscal cliff” discussions are finally put behind us. Employment is still slowly improving as 155,000 new jobs were created in December, in line with the average monthly gain of 2012, but that was not enough to change the 7.8% unemployment rate. More than twelve million Americans are still without a job. On the bright side, most US companies are financially healthy and have the capability to keep investing in marketing and communication. Corporate profitability after tax is expected to grow by +5.7% in 2013, which is less than previously expected by the SPF (+6.9%) but still accelerating from +2.9% in 2012. Under these conditions, MAGNA GLOBAL has reduced its top line 2013 growth forecast – for total normalized media spend (excluding P&O, including direct marketing) - from +1.3% to +1.0%. This assumes that the debt ceiling discussion in February will be successful, and that economic prospects remain on track, so that marketers will feel confident enough to plan some increase of their marketing budgets in the spring. Direct marketing categories are expected to decline again, but core media advertising (TV, Print, Internet, OOH, radio) will outperform the trend at +2.7% (October forecast: +2.8%) and thus continue to grow at a similar underlying rate as in 2012. National television is the category we have revised most significantly, down to +2.1% from +4.8% in October. Since the beginning of the broadcast season in September, the scatter market prices have showed very little “premium” over the upfront CPM inflation despite the fact that primetime ratings have been weaker than expected (-5% for broadcast networks, -2% for cable networks, on adults 18-49, including sports) and broadcasters had to serve extra spots to meet their guaranteed impact. That unusual pattern reveals weak demand. As a result, national broadcast revenues (ex P&O) were down by -5.5% in the second half of 2012 and we expect a similar softness throughout the first part of 2013. English-speaking national network TV will be impacted the most from this trend, with revenues decreasing by -6.4% (or -1.8% ex- P&O) in 2013. National cable will continue to benefit from better ratings and gain market share from broadcast: revenues will thus grow +4.0%. Local TV is forecast to grow +1.4% on a normalized basis and drop -9.1% when including (the lack of) Political advertising. Overall, television media owners ad revenues are now expected to decrease by -3.0% in 2013 (local and national, broadcast and cable, incl. P&O). Digital media is largely unaffected by cyclical spending and will continue to grow double-digits in 2013 (+14.2% to $41.5bn) with mobile advertising alone growing +55% to $4.5bn. Vincent Letang, EVP, Director of Global Forecasting said: “The concept of mobile advertising started with smartphones but tablets are changing everything, rapidly establishing themselves as universal media players (TV programmes, movies, radio, news, magazines) in a way never achieved through “personal”
  • 4. computers. By their versatility and user-friendliness, tablets are increasing digital media usage and redefining social media, online video and e-commerce. Their influence will be felt far beyond on-the-go media usage as a growing proportion of that happens in the home. Part of that usage is cannibalizing media time spent on desktops and laptops, but tablets bring incremental media exposure, partly through multitasking” . This new environment creates new opportunities as well as challenges for marketers and media owners. Despite the complexities in the ecosystem, the difficult upgrade of media measurement and the painful redefinition of many business models, MAGNA GLOBAL believes we have only scratched the surface of this new world: advertising on mobile devices is forecast to grow to $11.5bn in the next five years and by 2017 it will represent 18% of total digital advertising and 6% of total media advertising in the US*. Elsewhere we anticipate “paper-based” print media advertising revenues to decrease at a higher rate in 2013: -7.9% for newspapers and -7.3% for magazines. Newspaper readership decline is likely to accelerate. Magazines have more loyal readers but are struggling in the face of advertisers transferring part of their budgets online and on air. Core categories (fashion, beauty, pharmaceutical) remain loyal but other important categories (auto, technology, travel and finance) are increasing exploring cheaper alternatives on television and digital media. Meanwhile, publishers are experimenting with tablet editions without deriving any significant incremental advertising revenue yet. Radio advertising will experience a mild decline in 2013 (-0.5%), while outdoor media will be the only traditional media category to show some growth (+3.6%). In terms of spending categories, MAGNA GLOBAL is expecting technology, personal care and retail to be positive, while ad spend from pharmaceuticals and food will show little or no growth. In our long term forecast, we predict media owners ad revenues to accelerate over the next three years: 2014 (+3.1% excl. P&O) 2015 (+4.2%) and 2015 (+4.6%) as the economy gradually improves. The next update of MAGNA GLOBAL’s US Advertising Forecasts will be published in April 2013. *More insights on mobile advertising in MAGNA GLOBAL’s latest Media Economy Report: “The Ultimate Mobile Deep Dive” published earlier in January. The full report is available for download here.
  • 5. KEY FORECASTS US Media Owners Advertising Revenues: growth forecasts by media category (incl. P&O) 2013E 2011A 2012E 2013E (Oct. '12) Total TV (incl. P&O) 1.3% 7.2% -3.0% -1.4% Internet 21.9% 14.4% 14.2% 11.7% Newspapers -9.2% -6.5% -7.9% -7.4% Magazines -0.5% -6.8% -7.3% -7.1% Radio -0.5% 0.6% -0.5% -0.6% OOH 4.0% 4.6% 3.6% 3.9% Total Core Media (incl. P&O) 3.2% 4.7% 0.6% 0.8% Directories -20.2% -23.5% -25.4% -25.6% Direct Mail -0.9% -5.9% -6.5% -4.3% Total Incl. DM 1.7% 2.6% -0.8% -0.4% Source: MAGNA GLOBAL, January 2013 Summary of top line indicators 2012-2013 2012E Incl. P&O Ex P&O Core Media (ex. DM) ($bn) $153.4 $150.0 growth 4.7% 2.7% previous forecast (Oct 2012) 4.6% 2.6% Total Media (incl. DM) ($bn) $176.8 $173.4 growth 2.6% 0.8% previous forecast (Oct 2012) 2.7% 0.9% 2013E Incl. P&O Ex P&O Core Media (ex. DM) ($bn) $154.4 $154.0 growth 0.6% 2.7% previous forecast (Oct 2012) 0.8% 2.8% Total Media (incl. DM) ($bn) $175.4 $175.0 growth -0.8% 1.0% previous forecast (Oct 2012) -0.4% 1.3% Source: MAGNA GLOBAL, January 2013 Notes DM = Direct Marketing (traditional directories, direct mail). P&O = Incremental Political and Olympic Advertising. Long term forecasts 2004-2017 Normalized ad revenues excl. DM, excl. P&O 2004 2005 2006 2007 2008 2009 2010 2011 2012 2013 2014 2015 2016 2017 Total 151.6 159.9 165.0 167.5 156.8 133.3 139.3 146.1 150.0 154.0 158.8 165.5 173.1 181.0 change 6.0% 5.4% 3.2% 1.5% -6.4% -15.0% 4.5% 4.9% 2.7% 2.7% 3.1% 4.2% 4.6% 4.6%
  • 6. Source: MAGNA GLOBAL, January 2013 About MAGNA GLOBAL Advertising Forecasts For more than 40 years, MAGNA GLOBAL forecasts have been the industry’s leading source for measuring and forecasting advertising revenues. MAGNA GLOBAL forecasts media owners’ advertising revenues in the US and around the world through financial analyses of media companies’ public filings, government reports, trade association data and local market expertise. MAGNA GLOBAL’s new methodology was introduced to the industry in 2009 and has redefined measurement for the advertising-supported media economy, delivering unparalleled authority and accuracy. Our US Advertising Revenue Forecast study includes detailed data for more than 40 categories of media on a quarterly basis from 1990 to 2013 and on an annual basis from 1980 to 2017, updated quarterly. Detailed data in excel format is available to MAGNA GLOBAL subscribers. Please contact vincent.letang@magnaglobal.com for further details. About MAGNA GLOBAL MAGNA GLOBAL is the strategic global media unit of Interpublic Group, driving forecasts, insights and negotiation strategy across all media channels. The MAGNAGLOBAL Intelligence Unit delivers the industry’s most accurate and authoritative forecast of media value. The MAGNA GLOBAL Investment Unit harnesses $30 billion of Mediabrands global media billings. Follow us on Twitter for updates @MAGNAGLOBAL.