Law of supply and Change in Supply vs Change in Quantity Supplied.pptx
•Download as PPTX, PDF•
0 likes•3 views

The PowerPoint explains the concepts of the law of supply and its graphical curves, along with focusing on the topic "Change in supply vs. change in quantity supplied."

Recommended
More Related Content
Similar to Law of supply and Change in Supply vs Change in Quantity Supplied.pptx
Similar to Law of supply and Change in Supply vs Change in Quantity Supplied.pptx (20)
More from asad urrehman
More from asad urrehman (20)
Recently uploaded
Recently uploaded (20)
Law of supply and Change in Supply vs Change in Quantity Supplied.pptx
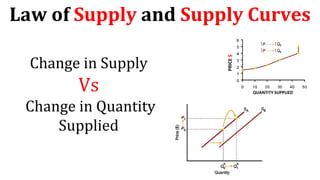
- 1. Law of Supply and Supply Curves Change in Supply Vs Change in Quantity Supplied PRICE $ QUANTITY SUPPLIED
- 2. The Law of Supply • The law of supply states that there is a positive relationship between price and quantity of a good supplied. • This means that supply curves typically have a positive slope. A supply curve is a graph illustrating how much of a product a firm will supply at different prices. Quantity supplied represents the number of units of a product that a firm would be willing and able to offer for sale at a particular price during a given time period. Quantity supplied Determinants of Supply: • Price of the good • Price of the related products • Cost of producing good Price of required inputs (labor / land) Technologies required for production
- 3. A change in supply is not the same as a change in quantity supplied. In first case, a higher price causes higher quantity supplied, and a move along the demand curve. In second case, changes in determinants of supply, other than price, cause an increase in supply, or a shift of the entire supply curve, from SA to SB. Change in Supply Vs Change in Quantity Supplied
- 4. When supply shifts to the right, supply increases. This causes quantity supplied to be greater than it was prior to the shift, for each and every price level. Change in Supply Vs Change in Quantity Supplied Change in price of a good or service leads to Change in quantity supplied (Movement along the curve). Change in costs, input prices, technology, or prices of related goods and services leads to Change in supply (Shift of curve).
- 5. For full video explanation, go to the below link and watch YouTube tutorial https://youtu.be/qPou_EMCrd0