Presentation1.pptx, diffusion weighted imaging in brain tumour.
•Download as PPTX, PDF•
36 likes•5,469 views


Recommended
Recommended
More Related Content
What's hot
What's hot (20)
Viewers also liked
Similar to Presentation1.pptx, diffusion weighted imaging in brain tumour.
Similar to Presentation1.pptx, diffusion weighted imaging in brain tumour. (20)
More from Abdellah Nazeer
More from Abdellah Nazeer (20)
Presentation1.pptx, diffusion weighted imaging in brain tumour.
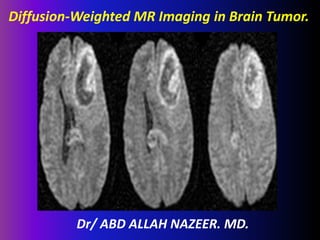
- 1. Diffusion-Weighted MR Imaging in Brain Tumor. Dr/ ABD ALLAH NAZEER. MD.
- 2. Diffusion Weighted (DW) Imaging: Diffusion-weighted MR imaging is the simplest form of diffusion imaging. A diffusion weighted MR sequence is an integral component of the MRI brain protocol for tumors. It is a pulse sequence sensitized to the random motion of water molecules (which is termed ' Brownian motion More Details'). Certain pathologies constrain the normal random motion of water molecules in the brain tissue and this is referred to as 'restricted diffusion'. Diffusion weighting enables one to distinguish between rapid diffusion of protons (unrestricted diffusion) and slow diffusion of protons (restricted diffusion). Lesions that have restricted diffusion appear hyperintense on diffusion images and hypointense on the accompanying apparent diffusion coefficient (ADC) maps. Using an ADC map it is possible to quantify the diffusion in brain tissues.
- 3. DWI has been used to assess brain tumors and while it has had limited success as a definitive prognostic tool, its proponents suggest that in certain settings it can increase both the sensitivity and specificity of MR imaging. DWI may be helpful is in distinguishing between brain abscesses and necrotic and cystic neoplasms on MRI. The abscesses have a high signal on DWI and a reduced Apparent Diffusion Coefficient (ADC) within the cavity. This restricted diffusion is thought to be related to the characteristic of the pus in the cavity; this may in turn lead to reduced water mobility, lower ADC, and bright signal on DWI.
- 4. DWI is also an effective way of differentiating an arachnoid cyst from epidermoid tumors. Both lesions present similar signal intensity characteristic of cerebrospinal fluid (CSF) on T1 and T2 sequences. On DWI, epidermoid tumors are hyperintense – for they are solidly composed –whereas arachnoid cysts are hypointense, demonstrating high diffusivity. The ADC values of epidermoid tumors are similar to those of the brain parenchyma, whilst ADC values of arachnoid cysts are similar to those of CSF. In certain settings diffusion-weighted imaging can increase both the sensitivity and specificity of MR imaging in the evaluation of brain tumors by providing information about tumor cellularity, which may in turn improve prediction of tumor grade. The mechanism in which DWI may help in the tumor grading is based on the fact that free water molecule diffusivity is restricted by cellularity increase in high-grade lesions. The reduction in extracellular space caused by tumor cellularity causes a relative reduction in the apparent diffusion coefficient (ADC) values.
- 5. Perhaps most helpfully, high grade tumors have in some studies been found to have low ADC values, suggesting a correlation between ADC values and tumor cellularity. In some studies, however, ADC values found in high- and low-grade gliomas have overlapped somewhat. It is well known that the brain tumors, specially the gliomas, are heterogeneous. Usually within a same neoplasm grade, mostly high grade, different histologic features of grades II–IV are presented. This limitation may also be explained by the fact that it is not only the tumor cellularity that is responsible for reducing the diffusibility. Lymphoma, a highly cellular tumor, has hyperintensity on DWI and reduced ADC values. While meningiomas also have a restricted diffusion, displaying low ADC values, they rarely present difficulty in diagnosis. DWI can be somewhat helpful in distinguishing medulloblastoma from other pediatric brain tumors, as it seems to display restricted diffusion presumably because of the densely packed tumor cells and high nuclear-to-cytoplasm ratio.
- 6. Diffusion-Tensor MR image The movement of water occurs in all three directions, and is assumed to behave in a manner physicists can describe using a Gaussian approximation. When water molecules diffuse equally in all directions, this is termed isotropic diffusion. In the white matter, however, free water molecules diffuse anisotropically, that is to say the water diffusion is not equal in all three orthogonal directions. The fractional anisotropy (FA) measures the fraction of the total magnitude of diffusion anisotropy. In addition to assessment of the diffusion in a single voxel, DTI has been used to attempt to map the white matter fiber tracts. A color-coded map of fiber orientation can also be determined by DTI. A different color has been attributed to represent a different fiber orientation along the three orthogonal spatial axes.
- 10. Glioblastoma in the right temporal lobe. A, T2-weighted image showing tumor of mixed intensity (from low to high) with peritumoral edema. B, The tumor shows heterogeneous enhancement after intravenous injection of contrast medium. C, On DWI, a solid portion of the tumor is isointense to moderately high in intensity, and edema is isointense. D, The ADC map calculated from DWI. Small circles from 1 to 12 in the right medial temporal lobe indicate the regions of interest (which are too small to be seen).
- 11. A–C, Gadolinium-enhanced T1-weighted MR image (400/14) (A), FLAIR MR image (10,002/175/22000) (B), and ADC map from DW image (b = 0, 1000 s/mm2) (C) obtained at 7-month follow-up after radiation treatment show a left parietotemporal mass with surrounding T2 prolongation. D–F, Gadolinium-enhanced T1-weighted MR image (400/14) (D), FLAIR MR image (10,002/175/22000 (E), and ADC map from DW image (b = 0, 1000 s/mm2) (F) show a new focus of enhancement in the left basal ganglia at 7-month follow-up after radiation treatment. Further follow-up imaging (not shown) revealed marked progression of enhancement and T2 prolongation. Patient had progressive functional deterioration in clinical course. This patient from the recurrence group exhibited a mean ADC in the enhancing lesion of 1.13 × 10⁻³ mm/s2, a mean ADC in T2 prolongation of 1.64 × 10⁻³ mm/s2, and a normalized ADC ratio of the enhancing region of 1.35. X indicates ROI of the enhancing lesion. ROI in T2 prolongation was drawn in a different section.
- 12. Images in a patient with glioblastoma multiforme. A, Contrast-enhanced T1- weighted MR image demonstrates an enhancing mass in the left temporal lobe that is not clearly high-grade glioma nor clearly metastasis on this conventional MR image. B, ROIs are placed within the hyperintense vasogenic edema on a T2-weighted MR image and within the corresponding contralateral white matter. C, MD overlay map renders a mean MD of 0.603 × 10⁻³ mm2/s. D, FA overlay map renders a mean FA of 0.301. The peritumoral DTI metrics are consistent with glioblastoma multiforme.
- 14. Grade II astrocytoma in the left insular portion. A, Tumor shows high intensity on a T2-weighted image. B, No enhancement is seen on a T2-weighted image. C, On DWI, the tumor is isointense to mildly hyperintense. D, On the ADC map, representative regions of interest are shown (small circles).
- 15. ADC and astrocytoma grade. WHO grade II (top row), grade III (middle row), and grade IV (bottom row) astrocytomas. Axial postcontrast T1-weighted images (left column), FLAIR images (middle column), and ADC maps (right column) demonstrate typical examples of 3 different grades of astrocytoma. With increasing tumor grade, the tumor ADC value of grade III astrocytoma is lower (black arrows) than that of grade II and the grade IV astrocytoma has the lowest (white arrow).
- 21. Decreased diffusion in tumours with high cellularity(Medulloblastoma).
- 24. Diffusion-weighted Imaging of Metastatic Brain Tumors: The SI on DWI may predict the histology of brain metastases. On DWI, the enhancing areas of metastatic brain tumors of different histologic types demonstrated different SI. Well differentiated adenocarcinomas tended to be hypointense; their SI was significantly lower than that of tumors with a different histology. Our 3 small-cell carcinomas and 1 large-cell neuroendocrine carcinoma manifested hyperintensity on DWI. Their ADC values reflected the cellularity of metastatic brain tumors.
- 25. Tumor in the right occipital lobe, metastasized from the lung. A, On a T2-weighted image, the solid portion of the tumor is mildly hyperintense, and peritumoral edema is present anterior to the tumor. B, Tumor shows relatively homogeneous enhancement after injection of contrast medium. C, On DWI, the solid portion of the tumor is isointense to mildly high in intensity. D, Regions of interest are shown (small circles) on the ADC map. The ADC values are 0.80, 0.74, 0.68, and 0.67, and the averaged ADC value is 0.72. Apparent restricted diffusion (high signal) in the tumor periphery appears to reflect T2 shine through effect, although peripheral high intensity is not seen on the T2-weighted image.
- 26. A 67-year-old man with a well differentiated adenocarcinoma from the lung. A, T2-weighted fast spin-echo image shows a parietotemporal lesion (arrow) near the trigone of the left lateral ventricle. It is hypointense relative to the normal-appearing white matter. The CNR of the solid lesion was 12. B, On contract-enhanced T1-weighted image, the lesion is enhanced (arrow). C, On DWI, the lesion is hypointense relative to the normal-appearing white matter (arrow). It was graded as −2. D, On ADC map, the nADC of the lesion was calculated as 1.95.
- 27. A 69-year-old man with small-cell carcinoma from the lung. A, On T2-weighted fast spin-echo image, the solid portion of a right parietal mass lesion (arrow) is hyperintense relative to the normal-appearing white matter. The CNR of the enhancing lesion was 45. B, On contract-enhanced T1-weighted image, the peripheral region of the lesion is enhanced (arrow). C, On DWI, the lesion is hyperintense relative to the normal-appearing cortical gray matter (arrow). The lesion was graded as +2. D, On ADC map, the solid lesion is slightly hyperintense. Its nADC was calculated as 0.57.
- 28. A 63-year-old man with large cell neuroendocrine carcinoma from the lung. A, On T2-weighted fast spin-echo image, the solid portion of left occipital lesion (arrow) is hyperintense relative to the normal-appearing white matter. The CNR of the enhancing lesion was 56. B, On contrast-enhanced T1-weighted image, the posterior part of the lesion is enhanced (arrow). There are multiple enhancing areas (arrowheads) in the left frontal lobe indicative of subacute infarction. C, On DWI, the solid lesion is hyperintense relative to the normal-appearing cortical gray matter (arrow). The lesion was ranked as grade +2. D, On ADC map, the solid lesion is hypointense; its nADC was calculated as 1.04.
- 29. Axial postcontrast T1-weighted with DWI of brain stem metastasis.
- 30. Images in a patient with lung carcinoma. A, Contrast-enhanced T1-weighted MR image demonstrates an enhancing mass adjacent to the central sulcus on the right side. B, ROIs are placed within the hyperintense vasogenic edema on this T2-weighted MR image and within the corresponding contralateral white matter. C, MD overlay map renders a mean MD of 0.908 × 10⁻³ mm2/s. D, FA overlay map renders a mean FA of 0.114. The peritumoral DTI metrics are consistent with lung metastasis.
- 31. Meningothelial meningioma in the left high frontal convexity. A, On a T2-weighted image, tumor is mildly high in intensity. B, Tumor enhances homogeneously on a T2-weighted image. C, The tumor is of high intensity on DWI. D, Regions of interest are shown on the ADC map. The ADC values are 0.76, 0.63, and 0.55, and the averaged ADC value is 0.65. Restricted diffusion in the tumor probably is caused by high tumor cellularity.
- 32. Fibrous meningioma in the left convexity. A, On a T2-weighted image, tumor intensity is mildly high and edema is present anterior to the tumor. B, The tumor enhances homogeneously. C, On DWI, the peripheral portion of the tumor is moderately hyperintense and the central portion is isointense. Peritumoral edema is mildly high in intensity. D, Regions of interest are shown on the ADC map. The ADC values are 0.83, 0.74, 0.71, 0.67, and 0.57, and the averaged ADC value is 0.70. Some areas of apparent restricted diffusion in the tumor probably reflect T2 shine-through effect, because ADC values in these areas are not low and the signals in those areas show high intensity on the T2-weighted image.
- 33. Prebulbar meningioma in a 10-year-old girl with history of torticollis. Sagittal, T1WI, Axial T2 & GRE T2* image shows an heterogeneous extra-axial mass (b) apparent diffusion coefficient (ADC) map show no restricted diffusion within mass.
- 40. Thank You.