SlideShare a Scribd company logo
1 of 6
Figure : Overall production information of AX1 and BX2
I have conducted many improvement projects and the most importance question which I was always asked is that how the improvement projects
which I have done improve the company P&L. First of all, before we start our improvement journey, we have to ask ourselves 5 questions.
1. What is the goal?
2. What to change?
3. What to change to?
4. How to change them?
5. What are the benefits from change?
All the improvement starts with the business objective which is business goal. The improvement illusion is the conventional costing system that
allocates the overhead cost to the products and services and this causes local optimize such as lot production the bigger production lot size is
cheaper than the small lot size. Therefore before select the improvement proposal we should ask for throughput not only the cost of the product that
completely allocate by the cost accountant. Throughput is the missing link of Lean and Six Sigma improvement.
Throughput = (Sale price - Variable cost)/ processing time on the constrain resource.
By Sornrakrit@gmail.com
Internal constraint: (Improvement selection)
Process A
C/T : 6 Minute
C/O : 60 Minute
Takt : 18.4 Min
Shift : 1 shift
Available : 9,600
minute
Process B
C/T : 7 minute
C/O : 60 Minute
Takt : 18.4 Min
Shift : 1 shift
Available : 9,600
Minute
Process C
C/T : 8 Minute
C/O : 60 Minute
Takt : 18.4 Min
Shift : 1 shift
Available : 9,600
Minute
Process D
C/T : 7 minute
C/O : 60 Minute
Takt : 18.4 Min
Shift : 1 shift
Available : 9,600
Minute
I I I
I
I
120 pcs 120 pcs 120 pcs
6 min 7 min 8 min 7 min
360 min 840 min 960 min
260 pcs
2880 min
28.0 min
720 min
1 X Weekly shipment
1 X Monthly shipment
500 pcs
90/60/30 day forecasts
Weekly order
3/1 Month forecasts
Monthly order
Production control
Daily order 130 PCS/Week
Tray = 52 PCS
Figure : Value stream mapping for product AX1
Throughput concept
By Sornrakrit@gmail.com
Process A
C/T : 3 Minute
C/O : 60 Minute
Takt : 18.4 Min
Shift : 1 shift
Available : 9,600
minute
Process B
C/T : 3.5 minute
C/O : 60 Minute
Takt : 18.4 Min
Shift : 1 shift
Available : 9,600
Minute
Process C
C/T : 14 Minute
C/O : 60 Minute
Takt : 18.4 Min
Shift : 1 shift
Available : 9,600
Minute
Process D
C/T : 3.5 minute
C/O : 60 Minute
Takt : 18.4 Min
Shift : 1 shift
Available : 9,600
Minute
I I I
I
I
120 pcs 120 pcs 120 pcs
3 min 3.5 min 14 min 3.5 min
360 min 1680 min 420 min
260 pcs
2280 min
24.0 min
420 min
1 X Weekly shipment
1 X Monthly shipment
500 pcs
90/60/30 day forecasts
Weekly order
3/1 Month forecasts
Monthly order
Production control
Daily order 130 PCS/Week
Tray = 52 PCS
Figure : Value stream mapping for product BX2 (Before improvement)
Throughput concept
By Sornrakrit@gmail.com
Hereafter is the example of how conventional costing give us the illusion. Throughput is the indicator to measure process rate at the constrain resource of the organization.
In order to simplify, I will use the value stream mapping of the product as example and we will consider only the production process time improvement only. We will not
consider the inventory reduction and the lead time reduction which could impact to the customer satisfaction even these are also importance KPIs which most of the conventional
company use them.
In this example, Assume that there are 2 improvement options which propose from the different engineer:
Option A:
Mr. A proposes to reduce production time of product BX2 in process B and D from 3.5 minute to 2.5 minute and this require investment 10,000 THB. For this improvement
proposal, the production lead time reduces 2 minute which equal -7%.
Option B:
Mr. B proposes to reduce production time of product BX2 in process C from 14 minute to be 13 minute, but it need to increase production time in process A from 3 minute to 6
minute. This improvement requires investment 15,000 THB. For this improvement proposal, the production lead-time increase 3 minute which equal +8%.
As you are the management which option you will select and why.
In Lean and Six sigma Concept we all will select Option A instead of Option B because option A we reduce the process time in Process B 1 minute from 3.5 minute to 2.5 minute
(28.57%) and Process D 1 minute from 3.5 minute to 2.5 minute (28.57%) and the total process will reduce 2 minute from 24 minute to 22 minute (8.33%). Moreover, the investment
cost for option A is only 10,000 THB which less than Option B around 33 %. In option B, we reduce the process time at process C 1 minute from 14 minute to 13 minute (7.14%),
but in process A the process time will increase 3 minute from 3 minute to 6 minute (100%) and the total process time increase 2 minute from 24 minute to 26 minute (8.33%).
However, we should consider both option A and B base on the financial result as well.
Figure : Company profitability before improvement
Throughput concept
By Sornrakrit@gmail.com
Figure : Company profitability after improvement (Option B)
Figure : Company profitability after improvement (Option A)
The profitability after improvement option B is higher than option A and higher than before improvement due to
the company can produce the product BX2 30 unit more than before improvement and this product still can be sold
because production mix is lower than the market demand. In short, the real improvement of the system is the
improvement that increase the capability of the system.
Throughput concept
By Sornrakrit@gmail.com
Improvement projects
Cost saving
Positive impact to P&L
project
Negative impact to
P&L project
Capital for reinvestment in the
improvement projects
Company profit Investors attractiveness
Stock price
New investment capital
New investors
I would like to explain about the green loop which is the reinforce loop first. If we selected the improvement projects that have positive impact to
P&L, we will gain more cost saving and we can use the cost saving for reinvestment in the remaining improvement projects that have positive
impact to P&L also. More cost saving will increase company profit. Once the company profit higher than the industrial average, it will increase
the investment attractiveness. When the investment attractive increase, it will lead to the increasing in stock price. Once stock price increase, the
new investors will willing to invest in the company stock. Then the company will gain the new investment capital from the new investors which
the company will invest in the improvement projects. When the company profit increase, The company can pay more dividend to the
stockholder, employee welfare, salary adjustment and bonus. Good salary, welfare and bonus will attract the talent people to join the company.
The more talent people join the company, the more improvement project will be proposed and it will start the process again as cycle. The red path
is the contrary with the green path.
Employee welfare and bonus Dividend Amount
Talent people join the company
Reinforce loop
By Sornrakrit@gmail.com

More Related Content

Similar to Internal constrain

Productivity improvement through better planning
Productivity improvement through better planningProductivity improvement through better planning
Productivity improvement through better planningZakir Husain
 
Chapter 3 JIT, Value Added and Waste .docx
Chapter 3 JIT, Value Added and Waste            .docxChapter 3 JIT, Value Added and Waste            .docx
Chapter 3 JIT, Value Added and Waste .docxadkinspaige22
 
The quest of one-piece-flow in IT by Pierre Masai, Toyota Motor Europe
The quest of one-piece-flow in IT by Pierre Masai, Toyota Motor EuropeThe quest of one-piece-flow in IT by Pierre Masai, Toyota Motor Europe
The quest of one-piece-flow in IT by Pierre Masai, Toyota Motor EuropeInstitut Lean France
 
Strategic project integration
Strategic project integrationStrategic project integration
Strategic project integrationEdward Jones
 
Webinar: Prioritising with cost of delay
Webinar: Prioritising with cost of delayWebinar: Prioritising with cost of delay
Webinar: Prioritising with cost of delayNiels Verdonk
 
Amy Friend- STC Spectrum- From Epic to Short Story: A Process to Reduce Cycle...
Amy Friend- STC Spectrum- From Epic to Short Story: A Process to Reduce Cycle...Amy Friend- STC Spectrum- From Epic to Short Story: A Process to Reduce Cycle...
Amy Friend- STC Spectrum- From Epic to Short Story: A Process to Reduce Cycle...Amy S. Friend
 
Cost and management accounting (2) (1)
Cost and management accounting (2) (1)Cost and management accounting (2) (1)
Cost and management accounting (2) (1)smumbahelp
 
Cost and management accounting (2) (1)
Cost and management accounting (2) (1)Cost and management accounting (2) (1)
Cost and management accounting (2) (1)smumbahelp
 
Certified kaizen practitioner v1.0
Certified kaizen practitioner v1.0Certified kaizen practitioner v1.0
Certified kaizen practitioner v1.0Vishy Chandra
 
Damon 2016 nov 15
Damon 2016 nov 15Damon 2016 nov 15
Damon 2016 nov 15Damon Chan
 
Synopsis on Productivity
Synopsis on ProductivitySynopsis on Productivity
Synopsis on ProductivityTanmay Bhatt
 
QCC - QIC Presentation, Mission Possible Team
QCC - QIC Presentation, Mission Possible TeamQCC - QIC Presentation, Mission Possible Team
QCC - QIC Presentation, Mission Possible TeamArief M Ridwan
 

Similar to Internal constrain (20)

Ab mojakoe-20122013
Ab mojakoe-20122013Ab mojakoe-20122013
Ab mojakoe-20122013
 
Productivity improvement through better planning
Productivity improvement through better planningProductivity improvement through better planning
Productivity improvement through better planning
 
Lean introduction
Lean introductionLean introduction
Lean introduction
 
Just In Time (JIT)
Just In Time (JIT)Just In Time (JIT)
Just In Time (JIT)
 
Chapter 3 JIT, Value Added and Waste .docx
Chapter 3 JIT, Value Added and Waste            .docxChapter 3 JIT, Value Added and Waste            .docx
Chapter 3 JIT, Value Added and Waste .docx
 
Sachin_Deshpande
Sachin_DeshpandeSachin_Deshpande
Sachin_Deshpande
 
Sachin_Deshpande
Sachin_DeshpandeSachin_Deshpande
Sachin_Deshpande
 
CV_Dhage2
CV_Dhage2CV_Dhage2
CV_Dhage2
 
Pmp integration chapter 4
Pmp integration chapter 4Pmp integration chapter 4
Pmp integration chapter 4
 
Black & white
Black & whiteBlack & white
Black & white
 
The quest of one-piece-flow in IT by Pierre Masai, Toyota Motor Europe
The quest of one-piece-flow in IT by Pierre Masai, Toyota Motor EuropeThe quest of one-piece-flow in IT by Pierre Masai, Toyota Motor Europe
The quest of one-piece-flow in IT by Pierre Masai, Toyota Motor Europe
 
Strategic project integration
Strategic project integrationStrategic project integration
Strategic project integration
 
Webinar: Prioritising with cost of delay
Webinar: Prioritising with cost of delayWebinar: Prioritising with cost of delay
Webinar: Prioritising with cost of delay
 
Amy Friend- STC Spectrum- From Epic to Short Story: A Process to Reduce Cycle...
Amy Friend- STC Spectrum- From Epic to Short Story: A Process to Reduce Cycle...Amy Friend- STC Spectrum- From Epic to Short Story: A Process to Reduce Cycle...
Amy Friend- STC Spectrum- From Epic to Short Story: A Process to Reduce Cycle...
 
Cost and management accounting (2) (1)
Cost and management accounting (2) (1)Cost and management accounting (2) (1)
Cost and management accounting (2) (1)
 
Cost and management accounting (2) (1)
Cost and management accounting (2) (1)Cost and management accounting (2) (1)
Cost and management accounting (2) (1)
 
Certified kaizen practitioner v1.0
Certified kaizen practitioner v1.0Certified kaizen practitioner v1.0
Certified kaizen practitioner v1.0
 
Damon 2016 nov 15
Damon 2016 nov 15Damon 2016 nov 15
Damon 2016 nov 15
 
Synopsis on Productivity
Synopsis on ProductivitySynopsis on Productivity
Synopsis on Productivity
 
QCC - QIC Presentation, Mission Possible Team
QCC - QIC Presentation, Mission Possible TeamQCC - QIC Presentation, Mission Possible Team
QCC - QIC Presentation, Mission Possible Team
 

Recently uploaded

Presentation on Slab, Beam, Column, and Foundation/Footing
Presentation on Slab,  Beam, Column, and Foundation/FootingPresentation on Slab,  Beam, Column, and Foundation/Footing
Presentation on Slab, Beam, Column, and Foundation/FootingEr. Suman Jyoti
 
scipt v1.pptxcxxxxxxxxxxxxxxxxxxxxxxxxxxxxxxxxxxxxxxxxxxxxxxxxxxxxxxxxxxxxxxx...
scipt v1.pptxcxxxxxxxxxxxxxxxxxxxxxxxxxxxxxxxxxxxxxxxxxxxxxxxxxxxxxxxxxxxxxxx...scipt v1.pptxcxxxxxxxxxxxxxxxxxxxxxxxxxxxxxxxxxxxxxxxxxxxxxxxxxxxxxxxxxxxxxxx...
scipt v1.pptxcxxxxxxxxxxxxxxxxxxxxxxxxxxxxxxxxxxxxxxxxxxxxxxxxxxxxxxxxxxxxxxx...HenryBriggs2
 
Path loss model, OKUMURA Model, Hata Model
Path loss model, OKUMURA Model, Hata ModelPath loss model, OKUMURA Model, Hata Model
Path loss model, OKUMURA Model, Hata ModelDrAjayKumarYadav4
 
Fundamentals of Structure in C Programming
Fundamentals of Structure in C ProgrammingFundamentals of Structure in C Programming
Fundamentals of Structure in C ProgrammingChandrakantDivate1
 
5G and 6G refer to generations of mobile network technology, each representin...
5G and 6G refer to generations of mobile network technology, each representin...5G and 6G refer to generations of mobile network technology, each representin...
5G and 6G refer to generations of mobile network technology, each representin...archanaece3
 
Lect.1: Getting Started (CS771: Machine Learning by Prof. Purushottam Kar, II...
Lect.1: Getting Started (CS771: Machine Learning by Prof. Purushottam Kar, II...Lect.1: Getting Started (CS771: Machine Learning by Prof. Purushottam Kar, II...
Lect.1: Getting Started (CS771: Machine Learning by Prof. Purushottam Kar, II...singhalabhi53
 
Post office management system project ..pdf
Post office management system project ..pdfPost office management system project ..pdf
Post office management system project ..pdfKamal Acharya
 
Autodesk Construction Cloud (Autodesk Build).pptx
Autodesk Construction Cloud (Autodesk Build).pptxAutodesk Construction Cloud (Autodesk Build).pptx
Autodesk Construction Cloud (Autodesk Build).pptxMustafa Ahmed
 
HOA1&2 - Module 3 - PREHISTORCI ARCHITECTURE OF KERALA.pptx
HOA1&2 - Module 3 - PREHISTORCI ARCHITECTURE OF KERALA.pptxHOA1&2 - Module 3 - PREHISTORCI ARCHITECTURE OF KERALA.pptx
HOA1&2 - Module 3 - PREHISTORCI ARCHITECTURE OF KERALA.pptxSCMS School of Architecture
 
Standard vs Custom Battery Packs - Decoding the Power Play
Standard vs Custom Battery Packs - Decoding the Power PlayStandard vs Custom Battery Packs - Decoding the Power Play
Standard vs Custom Battery Packs - Decoding the Power PlayEpec Engineered Technologies
 
Worksharing and 3D Modeling with Revit.pptx
Worksharing and 3D Modeling with Revit.pptxWorksharing and 3D Modeling with Revit.pptx
Worksharing and 3D Modeling with Revit.pptxMustafa Ahmed
 
UNIT 4 PTRP final Convergence in probability.pptx
UNIT 4 PTRP final Convergence in probability.pptxUNIT 4 PTRP final Convergence in probability.pptx
UNIT 4 PTRP final Convergence in probability.pptxkalpana413121
 
TMU_GDSC_20240509.pdfTMU_GDSC_20240509.pdf
TMU_GDSC_20240509.pdfTMU_GDSC_20240509.pdfTMU_GDSC_20240509.pdfTMU_GDSC_20240509.pdf
TMU_GDSC_20240509.pdfTMU_GDSC_20240509.pdfssuserded2d4
 
Fundamentals of Internet of Things (IoT) Part-2
Fundamentals of Internet of Things (IoT) Part-2Fundamentals of Internet of Things (IoT) Part-2
Fundamentals of Internet of Things (IoT) Part-2ChandrakantDivate1
 
8th International Conference on Soft Computing, Mathematics and Control (SMC ...
8th International Conference on Soft Computing, Mathematics and Control (SMC ...8th International Conference on Soft Computing, Mathematics and Control (SMC ...
8th International Conference on Soft Computing, Mathematics and Control (SMC ...josephjonse
 
Overview of Transformation in Computer Graphics
Overview of Transformation in Computer GraphicsOverview of Transformation in Computer Graphics
Overview of Transformation in Computer GraphicsChandrakantDivate1
 
litvinenko_Henry_Intrusion_Hong-Kong_2024.pdf
litvinenko_Henry_Intrusion_Hong-Kong_2024.pdflitvinenko_Henry_Intrusion_Hong-Kong_2024.pdf
litvinenko_Henry_Intrusion_Hong-Kong_2024.pdfAlexander Litvinenko
 
Independent Solar-Powered Electric Vehicle Charging Station
Independent Solar-Powered Electric Vehicle Charging StationIndependent Solar-Powered Electric Vehicle Charging Station
Independent Solar-Powered Electric Vehicle Charging Stationsiddharthteach18
 
Computer Networks Basics of Network Devices
Computer Networks  Basics of Network DevicesComputer Networks  Basics of Network Devices
Computer Networks Basics of Network DevicesChandrakantDivate1
 

Recently uploaded (20)

Presentation on Slab, Beam, Column, and Foundation/Footing
Presentation on Slab,  Beam, Column, and Foundation/FootingPresentation on Slab,  Beam, Column, and Foundation/Footing
Presentation on Slab, Beam, Column, and Foundation/Footing
 
scipt v1.pptxcxxxxxxxxxxxxxxxxxxxxxxxxxxxxxxxxxxxxxxxxxxxxxxxxxxxxxxxxxxxxxxx...
scipt v1.pptxcxxxxxxxxxxxxxxxxxxxxxxxxxxxxxxxxxxxxxxxxxxxxxxxxxxxxxxxxxxxxxxx...scipt v1.pptxcxxxxxxxxxxxxxxxxxxxxxxxxxxxxxxxxxxxxxxxxxxxxxxxxxxxxxxxxxxxxxxx...
scipt v1.pptxcxxxxxxxxxxxxxxxxxxxxxxxxxxxxxxxxxxxxxxxxxxxxxxxxxxxxxxxxxxxxxxx...
 
Path loss model, OKUMURA Model, Hata Model
Path loss model, OKUMURA Model, Hata ModelPath loss model, OKUMURA Model, Hata Model
Path loss model, OKUMURA Model, Hata Model
 
Fundamentals of Structure in C Programming
Fundamentals of Structure in C ProgrammingFundamentals of Structure in C Programming
Fundamentals of Structure in C Programming
 
5G and 6G refer to generations of mobile network technology, each representin...
5G and 6G refer to generations of mobile network technology, each representin...5G and 6G refer to generations of mobile network technology, each representin...
5G and 6G refer to generations of mobile network technology, each representin...
 
Lect.1: Getting Started (CS771: Machine Learning by Prof. Purushottam Kar, II...
Lect.1: Getting Started (CS771: Machine Learning by Prof. Purushottam Kar, II...Lect.1: Getting Started (CS771: Machine Learning by Prof. Purushottam Kar, II...
Lect.1: Getting Started (CS771: Machine Learning by Prof. Purushottam Kar, II...
 
Post office management system project ..pdf
Post office management system project ..pdfPost office management system project ..pdf
Post office management system project ..pdf
 
Autodesk Construction Cloud (Autodesk Build).pptx
Autodesk Construction Cloud (Autodesk Build).pptxAutodesk Construction Cloud (Autodesk Build).pptx
Autodesk Construction Cloud (Autodesk Build).pptx
 
HOA1&2 - Module 3 - PREHISTORCI ARCHITECTURE OF KERALA.pptx
HOA1&2 - Module 3 - PREHISTORCI ARCHITECTURE OF KERALA.pptxHOA1&2 - Module 3 - PREHISTORCI ARCHITECTURE OF KERALA.pptx
HOA1&2 - Module 3 - PREHISTORCI ARCHITECTURE OF KERALA.pptx
 
Standard vs Custom Battery Packs - Decoding the Power Play
Standard vs Custom Battery Packs - Decoding the Power PlayStandard vs Custom Battery Packs - Decoding the Power Play
Standard vs Custom Battery Packs - Decoding the Power Play
 
Worksharing and 3D Modeling with Revit.pptx
Worksharing and 3D Modeling with Revit.pptxWorksharing and 3D Modeling with Revit.pptx
Worksharing and 3D Modeling with Revit.pptx
 
UNIT 4 PTRP final Convergence in probability.pptx
UNIT 4 PTRP final Convergence in probability.pptxUNIT 4 PTRP final Convergence in probability.pptx
UNIT 4 PTRP final Convergence in probability.pptx
 
TMU_GDSC_20240509.pdfTMU_GDSC_20240509.pdf
TMU_GDSC_20240509.pdfTMU_GDSC_20240509.pdfTMU_GDSC_20240509.pdfTMU_GDSC_20240509.pdf
TMU_GDSC_20240509.pdfTMU_GDSC_20240509.pdf
 
Fundamentals of Internet of Things (IoT) Part-2
Fundamentals of Internet of Things (IoT) Part-2Fundamentals of Internet of Things (IoT) Part-2
Fundamentals of Internet of Things (IoT) Part-2
 
Integrated Test Rig For HTFE-25 - Neometrix
Integrated Test Rig For HTFE-25 - NeometrixIntegrated Test Rig For HTFE-25 - Neometrix
Integrated Test Rig For HTFE-25 - Neometrix
 
8th International Conference on Soft Computing, Mathematics and Control (SMC ...
8th International Conference on Soft Computing, Mathematics and Control (SMC ...8th International Conference on Soft Computing, Mathematics and Control (SMC ...
8th International Conference on Soft Computing, Mathematics and Control (SMC ...
 
Overview of Transformation in Computer Graphics
Overview of Transformation in Computer GraphicsOverview of Transformation in Computer Graphics
Overview of Transformation in Computer Graphics
 
litvinenko_Henry_Intrusion_Hong-Kong_2024.pdf
litvinenko_Henry_Intrusion_Hong-Kong_2024.pdflitvinenko_Henry_Intrusion_Hong-Kong_2024.pdf
litvinenko_Henry_Intrusion_Hong-Kong_2024.pdf
 
Independent Solar-Powered Electric Vehicle Charging Station
Independent Solar-Powered Electric Vehicle Charging StationIndependent Solar-Powered Electric Vehicle Charging Station
Independent Solar-Powered Electric Vehicle Charging Station
 
Computer Networks Basics of Network Devices
Computer Networks  Basics of Network DevicesComputer Networks  Basics of Network Devices
Computer Networks Basics of Network Devices
 

Internal constrain

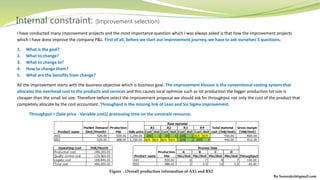
  • 1. Figure : Overall production information of AX1 and BX2 I have conducted many improvement projects and the most importance question which I was always asked is that how the improvement projects which I have done improve the company P&L. First of all, before we start our improvement journey, we have to ask ourselves 5 questions. 1. What is the goal? 2. What to change? 3. What to change to? 4. How to change them? 5. What are the benefits from change? All the improvement starts with the business objective which is business goal. The improvement illusion is the conventional costing system that allocates the overhead cost to the products and services and this causes local optimize such as lot production the bigger production lot size is cheaper than the small lot size. Therefore before select the improvement proposal we should ask for throughput not only the cost of the product that completely allocate by the cost accountant. Throughput is the missing link of Lean and Six Sigma improvement. Throughput = (Sale price - Variable cost)/ processing time on the constrain resource. By Sornrakrit@gmail.com Internal constraint: (Improvement selection)
  • 2. Process A C/T : 6 Minute C/O : 60 Minute Takt : 18.4 Min Shift : 1 shift Available : 9,600 minute Process B C/T : 7 minute C/O : 60 Minute Takt : 18.4 Min Shift : 1 shift Available : 9,600 Minute Process C C/T : 8 Minute C/O : 60 Minute Takt : 18.4 Min Shift : 1 shift Available : 9,600 Minute Process D C/T : 7 minute C/O : 60 Minute Takt : 18.4 Min Shift : 1 shift Available : 9,600 Minute I I I I I 120 pcs 120 pcs 120 pcs 6 min 7 min 8 min 7 min 360 min 840 min 960 min 260 pcs 2880 min 28.0 min 720 min 1 X Weekly shipment 1 X Monthly shipment 500 pcs 90/60/30 day forecasts Weekly order 3/1 Month forecasts Monthly order Production control Daily order 130 PCS/Week Tray = 52 PCS Figure : Value stream mapping for product AX1 Throughput concept By Sornrakrit@gmail.com
  • 3. Process A C/T : 3 Minute C/O : 60 Minute Takt : 18.4 Min Shift : 1 shift Available : 9,600 minute Process B C/T : 3.5 minute C/O : 60 Minute Takt : 18.4 Min Shift : 1 shift Available : 9,600 Minute Process C C/T : 14 Minute C/O : 60 Minute Takt : 18.4 Min Shift : 1 shift Available : 9,600 Minute Process D C/T : 3.5 minute C/O : 60 Minute Takt : 18.4 Min Shift : 1 shift Available : 9,600 Minute I I I I I 120 pcs 120 pcs 120 pcs 3 min 3.5 min 14 min 3.5 min 360 min 1680 min 420 min 260 pcs 2280 min 24.0 min 420 min 1 X Weekly shipment 1 X Monthly shipment 500 pcs 90/60/30 day forecasts Weekly order 3/1 Month forecasts Monthly order Production control Daily order 130 PCS/Week Tray = 52 PCS Figure : Value stream mapping for product BX2 (Before improvement) Throughput concept By Sornrakrit@gmail.com
  • 4. Hereafter is the example of how conventional costing give us the illusion. Throughput is the indicator to measure process rate at the constrain resource of the organization. In order to simplify, I will use the value stream mapping of the product as example and we will consider only the production process time improvement only. We will not consider the inventory reduction and the lead time reduction which could impact to the customer satisfaction even these are also importance KPIs which most of the conventional company use them. In this example, Assume that there are 2 improvement options which propose from the different engineer: Option A: Mr. A proposes to reduce production time of product BX2 in process B and D from 3.5 minute to 2.5 minute and this require investment 10,000 THB. For this improvement proposal, the production lead time reduces 2 minute which equal -7%. Option B: Mr. B proposes to reduce production time of product BX2 in process C from 14 minute to be 13 minute, but it need to increase production time in process A from 3 minute to 6 minute. This improvement requires investment 15,000 THB. For this improvement proposal, the production lead-time increase 3 minute which equal +8%. As you are the management which option you will select and why. In Lean and Six sigma Concept we all will select Option A instead of Option B because option A we reduce the process time in Process B 1 minute from 3.5 minute to 2.5 minute (28.57%) and Process D 1 minute from 3.5 minute to 2.5 minute (28.57%) and the total process will reduce 2 minute from 24 minute to 22 minute (8.33%). Moreover, the investment cost for option A is only 10,000 THB which less than Option B around 33 %. In option B, we reduce the process time at process C 1 minute from 14 minute to 13 minute (7.14%), but in process A the process time will increase 3 minute from 3 minute to 6 minute (100%) and the total process time increase 2 minute from 24 minute to 26 minute (8.33%). However, we should consider both option A and B base on the financial result as well. Figure : Company profitability before improvement Throughput concept By Sornrakrit@gmail.com
  • 5. Figure : Company profitability after improvement (Option B) Figure : Company profitability after improvement (Option A) The profitability after improvement option B is higher than option A and higher than before improvement due to the company can produce the product BX2 30 unit more than before improvement and this product still can be sold because production mix is lower than the market demand. In short, the real improvement of the system is the improvement that increase the capability of the system. Throughput concept By Sornrakrit@gmail.com
  • 6. Improvement projects Cost saving Positive impact to P&L project Negative impact to P&L project Capital for reinvestment in the improvement projects Company profit Investors attractiveness Stock price New investment capital New investors I would like to explain about the green loop which is the reinforce loop first. If we selected the improvement projects that have positive impact to P&L, we will gain more cost saving and we can use the cost saving for reinvestment in the remaining improvement projects that have positive impact to P&L also. More cost saving will increase company profit. Once the company profit higher than the industrial average, it will increase the investment attractiveness. When the investment attractive increase, it will lead to the increasing in stock price. Once stock price increase, the new investors will willing to invest in the company stock. Then the company will gain the new investment capital from the new investors which the company will invest in the improvement projects. When the company profit increase, The company can pay more dividend to the stockholder, employee welfare, salary adjustment and bonus. Good salary, welfare and bonus will attract the talent people to join the company. The more talent people join the company, the more improvement project will be proposed and it will start the process again as cycle. The red path is the contrary with the green path. Employee welfare and bonus Dividend Amount Talent people join the company Reinforce loop By Sornrakrit@gmail.com