SlideShare a Scribd company logo
1 of 14
Download to read offline
Key work health and safety statistics
Queensland 2021
Work-related injury fatalities
Workplace Health and Safety Queensland
Safe Work Australia compiles the Work-related Traumatic Injury Fatalities data set which provides national
statistics on all workers and bystanders fatally injured at work. This report presents a summary of Queensland
results from this dataset, based on Safe Work Australia’s Key WHS Statistics report and results for Australia.
The national data set includes a range of information sources, such as:
•	
initial reporting of fatalities in the media or on relevant authority websites such as police, road authorities and
the Australian Transport Safety Bureau
•	
notifications to Safe Work Australia from the jurisdictional authorities
•	
the National Coronial Information System which provides confidential access to coroners’, police and other
investigative reports.
Work-related fatalities resulting from diseases, natural causes and suicides are excluded. Further explanatory
notes on the data can be found in the Explanatory notes for Safe Work Australia datasets.
Trends in worker fatalities, 2003 to 2020
Queensland's fatality rate
decreased by 63%
from the peak in 2007
0.0
0.5
1.0
1.5
2.0
2.5
3.0
3.5
4.0
0
10
20
30
40
50
60
70
80
90
2
0
1
7
2
0
1
8
2
0
1
9
2
0
2
0
2
0
1
6
2
0
1
5
2
0
1
4
2
0
1
3
2
0
1
2
2
0
1
1
2
0
1
0
2
0
0
9
2
0
0
8
2
0
0
7
2
0
0
6
2
0
0
5
2
0
0
4
2
0
0
3
Queensland
number
of
fatalities
Queensland
fatalities
per
100,000
workers
Worker fatalities by gender, 2020
Number of fatalities
Fatality rate
(fatalities per
100,000 workers)
2
0.2
32
2.5
Total
34
Total
1.4
Male
Female
Work-related injury fatalities
Key work health and safety statistics Queensland 2021 page 2
Worker fatalities by age group, 2020
Age group (years) Queensland number of
fatalities
Queensland fatality rate
(fatalities per 100,000
workers)
under 25 1 0.2
25–34 3 0.5
35–44 5 0.9
45–54 6 1.2
55–64 15 4.2
65 and over 4 4.7
Total 34 1.4
Worker fatality by state/territory, 2020*
fatalities
(4.6 per
100,000
workers)
fatalities (2.1 per
100,000 workers)
11
34
53
fatalities (0.8 per
100,000 workers)
8
51
194
Australian Total
6
29
fatalities (1.3 per
100,000 workers)
fatalities (1.4 per
100,000 workers)
fatalities (1.3 per
100,000 workers)
fatalities (1.5 per
100,000 workers)
fatalities (3.2 per
100,000 workers)
fatalities (1.5 per
100,000 workers)
2
* Fatalities are presented according to the state or territory where the fatality occurred, not the jurisdiction under which the fatality fell.
Work-related injury fatalities
Key work health and safety statistics Queensland 2021 page 3
Worker fatalities by mechanism of incident, 2020
Other mechanisms
Contact with electricity
Falls from a height
Rollover of non-road vehicle
Being trapped by moving machinery
Being hit by moving objects
Being hit by falling objects
Vehicle incident* 56%
9%
6%
6%
6%
3%
3%
12%
Note: Only mechanisms accounting for 5 per cent or more of national fatalities are included. The remaining mechanisms are grouped
together under ‘other mechanisms’.
Work-related injury fatalities by mechanism
of fatal injury, 2020
Queensland
number of
fatalities
Queensland
proportion of
injury fatalities
Vehicle incident* 19 56%
Being hit by falling objects 3 9%
Being hit by moving objects 2 6%
Being trapped by moving machinery 2 6%
Rollover of non-road vehicle 2 6%
Falls from a height 1 3%
Contact with electricity 1 3%
Other mechanisms 4 12%
Total 34 100%
*Vehicle collisions include fatalities that occurred as a direct result of a vehicle crash. Vehicles include not only road vehicles such as cars
and trucks, but also machines such as aircraft, boats, loaders, tractors and quad bikes.
Work-related injury fatalities
Key work health and safety statistics Queensland 2021 page 4
Worker fatalities by occupation, 2020
Machinery operators and drivers
Technicians and
Trades Workers
Labourers
3.7
fatalities per 100,000 workers
5.8
fatalities per
100,000 workers
fatalities per
100,000 workers
1.7
Work-related injury fatalities by occupation, 2020 Queensland number
of fatalities
Queensland fatality
rate (fatalities per
100,000 workers)
Machinery operators and drivers 10 5.8
Labourers 10 3.7
Technicians and trades workers 6 1.7
Managers 5 1.6
Community and personal service workers 1 0.4
Clerical and administrative workers 1 0.3
Professionals 1 0.2
Sales workers 0 0.0
Total 34 1.4
Work-related injury fatalities
Key work health and safety statistics Queensland 2021 page 5
Worker fatalities by industry, 2020
Agriculture, forestry
and fishing
12.2
Transport, postal
and warehousing
7.9
Electricity, gas, water
and waste services
3.5
fatalities per
100,000 workers
fatalities per
100,000 workers
fatalities per
100,000 workers
Work-related injury fatalities by industry, 2020 Queensland number
of fatalities
Queensland fatality
rate (fatalities per
100,000 workers)
Agriculture, forestry and fishing 11 12.2
Transport, postal and warehousing 10 7.9
Electricity, gas, water and waste services 1 3.5
Administrative and support services 2 2.5
Rental, hiring and real estate services 1 2.0
Construction 4 1.7
Mining 1 1.5
Manufacturing 2 1.2
Accommodation and food services 1 0.6
Health care and social assistance 1 0.3
Public administration and safety 0 0.0
Professional, scientific and technical services 0 0.0
Other services 0 0.0
Education and training 0 0.0
Retail trade 0 0.0
Wholesale trade 0 0.0
Arts and recreation services 0 0.0
Financial and insurance services 0 0.0
Information media and telecommunications 0 0.0
Total 34 1.4
Work-related injury and disease
Key work health and safety statistics Queensland 2021 page 6
Safe Work Australia compiles the National Dataset for Compensation-based Statistics which comprises information
on workers’ compensation claims provided by each of the jurisdictional workers’ compensation authorities.
Data in this report refers to Queensland serious claims only. Serious claims relate to where the compensated injury
or disease resulted in one week or more off work. Data for 2019–20 is preliminary (denoted by a ‘p’) and therefore
is subject to revision in subsequent years as further claims are finalised. Serious claim numbers are rounded to the
nearest five and as such the figures may not add to the total. Further explanatory notes on the data can be found
in the Explanatory notes for Safe Work Australia datasets.
Serious claims statistics, 2019-20p*
Median time lost
5.6
weeks per serious claim
Frequency rate of
7.6
serious claims per
million hours worked
Median compensation paid
$9,900
per serious claim
Total of
28,732
serious claims
*preliminary data subject to revision in subsequent years as further claims are finalised.
Serious claim rate, 2000–01 to 2019–20p*
The Queensland serious claim
frequency rate
dropped by 19%
from 2009–10 to 2018–19
0
2
4
6
8
10
12
14
16
18
20
2000-01
2001-02
2002-03
2003-04
2004-05
2005-06
2006-07
2007-08
2008-09
2009-10
2010-11
2011-12
2012-13
2013-14
2014-15
2015-16
2016-17
2017-18
2019-20p*
2018-19
Queensland incidence rate (serious claims per 1,000 employees)
Queensland frequency rate (serious claims per million hours worked)
*preliminary data subject to revision in subsequent years as further claims are finalised.
Work-related injury and disease
Key work health and safety statistics Queensland 2021 page 7
Serious claims by gender, 2019–20p*
Frequency rate
(serious claims per
million hours worked)
Median time
lost from work
(weeks)
Median
compensation
paid per claim
5.4
$7,600
5.6
6.8 8.2
$11,400
Male
Female
Gender Number of serious claims Frequency rate
(serious claims per
million hours worked)
Incidence rate
(serious claims per
1000 employees)
Queensland female 11,000 6.8 9.6
Queensland male 17,660 8.2 15.0
Queensland total 28,730 7.6 12.4
*preliminary data subject to revision in subsequent years as further claims are finalised.
Work-related injury and disease
Key work health and safety statistics Queensland 2021 page 8
Serious claims by age group, 2019–20p*
Workers aged
60-64 years had
the highest claim rate of
Workers aged
35-39 years had
the lowest claim rate of
claims per million
hours worked
6.6 claims per million
hours worked
10.2
Age group (years) Number of serious claims Queensland frequency
rate (serious claims per
million hours worked)
Queensland incidence
rate (serious claims per
1,000 employees)
Under 20 1,056 7.5 7.0
20-24 2,872 8.3 12.2
25-29 3,233 6.8 11.6
30-34 3,032 6.6 11.0
35-39 2,895 6.6 11.5
40-44 2,960 7.0 12.4
45-49 3,352 7.2 12.9
50-54 3,404 8.7 15.3
55-59 3,097 9.3 15.6
60-64 2,082 10.2 15.8
65 and over 749 7.0 9.4
Total 28,732 7.6 12.4
*preliminary data subject to revision in subsequent years as further claims are finalised.
**The 65 and over age group had a frequency rate of 7.4 claims per million hours worked in Queensland, however rates are likely to be
understated due to retirement choices.
Work-related injury and disease
Key work health and safety statistics Queensland 2021 page 9
Serious claims by mechanism of incident, 2019–20p*
Body stressing
41%
Falls, trips and
slips of a person
23%
Sound and pressure
Biological factors
Chemicals and other
substances
Heat, electricity and other
environmental factors
Mental stress
Vehicle incidents and other
Hitting objects with a part
of the body
Being hit by moving objects
Falls, trips and slips
of a person
Body stressing 41%
23%
16%
7%
5%
5%
1%
1%
Mechanism of incident Queensland number of serious
claims
Proportion of serious claims
Female Male Total Female Male Total
Body stressing 4,767 7,114 11,902 43% 40% 41%
Falls, trips and slips of a person 2,774 3,699 6,495 25% 21% 23%
Being hit by moving objects 1,346 3,184 4,546 12% 18% 16%
Hitting objects with a part of the body 463 1,618 2,089 4% 9% 7%
Vehicle incidents and other 530 958 1,489 5% 5% 5%
Mental stress 816 574 1,390 7% 3% 5%
Heat, electricity and other environmental
factors
165 252 420 1% 1% 1%
Chemicals and other substances 94 166 260 1% 1% 1%
Biological factors 41 64 105 0% 0% 0%
Sound and pressure 6 30 36 0% 0% 0%
Total 11,002 17,659 28,732 100% 100% 100%
*preliminary data subject to revision in subsequent years as further claims are finalised.
**other mechanisms of incident include biological factors, sound and pressure, other multiple mechanisms of incident, roll over, slide or
cave-in and unspecified mechanisms of incident.
***vehicle collisions include claims where the injury was the direct result of a vehicle crash. Vehicles include not only road vehicles such as
cars and trucks, but also machines such as aircraft, boats, loaders, tractors and quad bikes.
Work-related injury and disease
Key work health and safety statistics Queensland 2021 page 10
Serious claims by nature of injury/disease, 2019–20p*
Disease
9%
Traumatic joint/ligament
and muscle/tendon injury
49%
Wounds, lacerations, amputations
and internal organ damage
13%
Injury
91%
Intracranial injuries
Nervous system and
sense organ diseases
Burn
Digestive system diseases
Other injuries
Mental disorders
Fractures
Musculoskeletal and
connective tissue diseases
Wounds, lacerations, amputations
and internal organ damage
Traumatic joint/ligament
and muscle/tendon injury
49%
13%
12%
11%
5%
3%
2%
2%
1%
1%
Note: Order of injury is based on national results.
Nature of injury/disease Queensland number of
serious claims
Proportion of serious claims
Female Male Total Female Male Total
Traumatic joint/ligament and muscle/tendon
injury
5,720 8,403 14,155 53% 48% 49%
Wounds, lacerations, amputations and internal
organ damage
861 2,982 3,858 8% 17% 13%
Musculoskeletal and connective tissue diseases 1,538 1,824 3,371 14% 11% 12%
Fractures 1,034 2,038 3,082 10% 12% 11%
Mental disorders 823 595 1,418 8% 3% 5%
Other injuries 325 468 794 3% 3% 3%
Digestive system diseases 36 480 516 0% 3% 2%
Burn 172 303 478 2% 2% 2%
Nervous system and sense organ diseases 189 167 356 2% 1% 1%
Intracranial injuries 79 88 167 1% 1% 1%
Total 10,777 17,348 28,732 100% 100% 100%
*preliminary data subject to revision in subsequent years as further claims are finalised.
**other injuries includes those related to poisoning, electrocution, air pressure, weather conditions, unspecified injuries and injuries not
classified elsewhere.
***Injuries or diseases accounting for less than 1% of serious claims nationally are not included separately but are included in the tota
Work-related injury and disease
Key work health and safety statistics Queensland 2021 page 11
Serious claims by bodily location of injury, 2019–20p*
25%
37%
5%
3%
2%
25%
2%
Trunk
Arms/upper limbs
Neck
Head
Lower limbs
Other locations***
Non-physical locations
Body location of injury/disease Number of serious
claims
Proportion of
serious claims
Upper limbs 10,699 37%
Trunk 7,186 25%
Lower limbs 7,129 25%
Non-physical locations 1,418 5%
Head 880 3%
Multiple locations 607 2%
Neck 588 2%
Total 28,732 100%
*Preliminary data subject to revision in subsequent years as further claims are finalised. Order of results is based on national results.
**Claims where the bodily location was unknown are not included separately but are included in the total.
***Other locations include multiple locations and systemic locations.
Work-related injury and disease
Key work health and safety statistics Queensland 2021 page 12
Serious claims by occupation, 2019–20p*
24%Labourers
19% Community and
personal service workers
18% Technicians and trades
workers
14% Machinery operators
and drivers
8% Professionals
4%Sales workers
3% Clerical and
administrative workers
3% Managers
6% Not stated
Labourers
20.3
serious claims per
million hours worked
Machinery operators
and drivers
13.2
serious claims per
million hours worked
Community and
personal service workers
15.6
serious claims per
million hours worked
Proportion of
serious claims
*preliminary data subject to revision in subsequent years as further claims are finalised.
Serious claims by occupation, 2019–20p*
Occupation Number of serious
claims
Queensland
frequency rate
(serious claims
per million hours
worked)
Queensland
incidence rate
(serious claims per
1,000 employees)
Labourers 6,889 20.3 28.9
Community and personal service workers 5,576 15.6 20.1
Technicians and trades workers 5,214 8.8 16.4
Machinery operators and drivers 4,148 13.2 25.1
Professionals 2,345 2.7 4.6
Sales workers 1,256 4.5 5.6
Clerical and administrative workers 868 1.8 2.7
Managers 837 1.5 3.2
Not stated 1,599 n/a n/a
Total 28,732 7.6 12.4
*Preliminary data subject to revision in subsequent years as further claims are finalised. Order of results is based on national results.
**Claims where the occupation was unknown are not included separately but are included in the total.
Work-related injury and disease
Key work health and safety statistics Queensland 2021 page 13
Serious claims by industry, 2019–20p*
Health care and
social assistance
Manufacturing
Proportion of
serious claims
Administrative and
support services**
serious claims per
million hours worked
10.8
serious claims per
million hours worked
11.8
serious claims per
million hours worked
14.7
19%
Health care and
social assistance
12%
Manufacturing
12%
Construction
7%
Retail trade
7%
Administrative and
support services
7%
Public administration
and safety
7%
Transport, postal and
warehousing
6%
Education and training
*Preliminary data subject to revision in subsequent years as further claims are finalised.
**The Administrative and support services industry includes labour hire workers. For example; some construction workers.
***‘Other industries’ includes all other industries excluding the top nine industries by number of serious claims.
Work-related injury and disease
Key work health and safety statistics Queensland 2021 page 14
Serious claims by industry, 2019–20p*
Industry Number of serious
claims
Queensland
frequency rate
(serious claims
per million hours
worked)
Queensland
incidence rate
(serious claims
per 1,000
employees)
Health care and social assistance 5,474 10.8 15.9
Manufacturing 3,377 11.8 22.0
Construction 3,314 8.8 17.2
Retail trade 2,082 6.6 9.0
Administrative and support services 2,079 14.7 22.9
Public administration and safety 1,910 8.3 13.4
Transport, postal and warehousing 1,871 9.3 16.9
Education and training 1,811 5.4 8.3
Accommodation and food services 1,669 7.2 8.7
Wholesale trade 1,174 9.2 17.3
Agriculture, forestry and fishing 1,072 9.9 20.7
Other services 852 5.9 9.5
Mining 518 4.1 8.6
Arts and recreation services 375 6.5 8.2
Professional, scientific and technical services 334 1.1 2.0
Rental, hiring and real estate services 290 3.6 6.1
Electricity, gas, water and waste services 256 4.4 8.2
Financial and insurance services 99 0.9 1.7
Information media and telecommunications 55 1.2 2.1
Not stated division 120 n/a n/a
Total 28,732 7.6 12.4
*preliminary data subject to revision in subsequent years as further claims are finalised.
** Claims where the industry was unknown are not included separately but are included in the total.
© State of Queensland 2022. Unless otherwise noted, this document is available under a Creative Commons Attribution 4.0 International Licence (https://creativecommons.
org/licenses/). You are free to copy and redistribute the work, so long as you attribute The State of Queensland. The material presented in this publication is distributed by the
Queensland Government for information only and is subject to change without notice. The Queensland Government disclaims all responsibility and liability (including liability in
negligence) for all expenses, losses, damages and costs incurred as a result of the information being inaccurate or incomplete in any way and for any reason. PN12783
AEU22/6336

More Related Content

What's hot

Curso de prevencion panaderias
Curso de prevencion panaderiasCurso de prevencion panaderias
Curso de prevencion panaderiasConfulayen
 
Seguridad en trabajos en caliente
Seguridad en trabajos en calienteSeguridad en trabajos en caliente
Seguridad en trabajos en calienteYanet Caldas
 
“Equipos de almacenamiento y normas de manejo de materiales peligrosos”
“Equipos de almacenamiento y normas de manejo de materiales peligrosos”“Equipos de almacenamiento y normas de manejo de materiales peligrosos”
“Equipos de almacenamiento y normas de manejo de materiales peligrosos”armandorc19
 
8 Busqueda Y Rescate
8 Busqueda Y Rescate8 Busqueda Y Rescate
8 Busqueda Y RescateELFI TORRES
 

What's hot (7)

seguridad visual
seguridad visualseguridad visual
seguridad visual
 
Top 10 Accidents In The Workplace
Top 10 Accidents In The WorkplaceTop 10 Accidents In The Workplace
Top 10 Accidents In The Workplace
 
Curso de prevencion panaderias
Curso de prevencion panaderiasCurso de prevencion panaderias
Curso de prevencion panaderias
 
Seguridad en trabajos en caliente
Seguridad en trabajos en calienteSeguridad en trabajos en caliente
Seguridad en trabajos en caliente
 
“Equipos de almacenamiento y normas de manejo de materiales peligrosos”
“Equipos de almacenamiento y normas de manejo de materiales peligrosos”“Equipos de almacenamiento y normas de manejo de materiales peligrosos”
“Equipos de almacenamiento y normas de manejo de materiales peligrosos”
 
8 Busqueda Y Rescate
8 Busqueda Y Rescate8 Busqueda Y Rescate
8 Busqueda Y Rescate
 
Copasst
CopasstCopasst
Copasst
 

Similar to Key work health and safety statistics Queensland 2021

Australian Workers’ Compensation Statistics Report - 2012-2013
Australian Workers’ Compensation Statistics Report - 2012-2013Australian Workers’ Compensation Statistics Report - 2012-2013
Australian Workers’ Compensation Statistics Report - 2012-2013Flint Wilkes
 
Australian Workers Compensation Statistics Report - 2011-2012
Australian Workers Compensation Statistics Report - 2011-2012Australian Workers Compensation Statistics Report - 2011-2012
Australian Workers Compensation Statistics Report - 2011-2012Flint Wilkes
 
Understanding Broadband to Influence Business Growth (Price County WI)
Understanding Broadband to Influence Business Growth (Price County WI)Understanding Broadband to Influence Business Growth (Price County WI)
Understanding Broadband to Influence Business Growth (Price County WI)WI Broadband
 
ELECTRICAL SAFETY ASSESSMENT OF POWER INDUSTRY
ELECTRICAL SAFETY ASSESSMENT OF POWER INDUSTRYELECTRICAL SAFETY ASSESSMENT OF POWER INDUSTRY
ELECTRICAL SAFETY ASSESSMENT OF POWER INDUSTRYIRJET Journal
 
Dr.munir baghdad road traffic injuries,Epidemiological Characteristics, 2010-...
Dr.munir baghdad road traffic injuries,Epidemiological Characteristics, 2010-...Dr.munir baghdad road traffic injuries,Epidemiological Characteristics, 2010-...
Dr.munir baghdad road traffic injuries,Epidemiological Characteristics, 2010-...munir salman
 
Employment Prospects Avison
Employment Prospects   AvisonEmployment Prospects   Avison
Employment Prospects Avisonkmfusion
 
NABE_IT_Roundtable_China_Tech_Demand_04_2010
NABE_IT_Roundtable_China_Tech_Demand_04_2010NABE_IT_Roundtable_China_Tech_Demand_04_2010
NABE_IT_Roundtable_China_Tech_Demand_04_2010Mark Killion, CFA
 
Insurance and Private Pensions Sector in Turkey - Akif EROĞLU (2016)
Insurance and Private Pensions Sector in Turkey - Akif EROĞLU (2016)Insurance and Private Pensions Sector in Turkey - Akif EROĞLU (2016)
Insurance and Private Pensions Sector in Turkey - Akif EROĞLU (2016)SigortaTatbikatcilariDernegi
 
2013 DCD Intelligence Census results, UK figures
2013 DCD Intelligence Census results, UK figures2013 DCD Intelligence Census results, UK figures
2013 DCD Intelligence Census results, UK figuresDarran Blatch
 
Australian Workers’ Compensation Statistics Report - 2013-2014
Australian Workers’ Compensation Statistics Report - 2013-2014Australian Workers’ Compensation Statistics Report - 2013-2014
Australian Workers’ Compensation Statistics Report - 2013-2014Flint Wilkes
 
Pathways Institute panel presentation june 23, 2017-- What Will Be
Pathways Institute panel presentation   june 23, 2017-- What Will BePathways Institute panel presentation   june 23, 2017-- What Will Be
Pathways Institute panel presentation june 23, 2017-- What Will Bekfryda
 
Australia in Transition: Disruption breeds new infrastructure investment oppo...
Australia in Transition: Disruption breeds new infrastructure investment oppo...Australia in Transition: Disruption breeds new infrastructure investment oppo...
Australia in Transition: Disruption breeds new infrastructure investment oppo...Turlough Guerin GAICD FGIA
 
Global Megatrends CSIRO.pdf
Global Megatrends CSIRO.pdfGlobal Megatrends CSIRO.pdf
Global Megatrends CSIRO.pdfJon Whittle
 
Nigel Roberts presents 'It’s Time for a Revolution - Insights from the EY Fut...
Nigel Roberts presents 'It’s Time for a Revolution - Insights from the EY Fut...Nigel Roberts presents 'It’s Time for a Revolution - Insights from the EY Fut...
Nigel Roberts presents 'It’s Time for a Revolution - Insights from the EY Fut...ChrisBai4
 

Similar to Key work health and safety statistics Queensland 2021 (20)

Australian Workers’ Compensation Statistics Report - 2012-2013
Australian Workers’ Compensation Statistics Report - 2012-2013Australian Workers’ Compensation Statistics Report - 2012-2013
Australian Workers’ Compensation Statistics Report - 2012-2013
 
Australian Workers Compensation Statistics Report - 2011-2012
Australian Workers Compensation Statistics Report - 2011-2012Australian Workers Compensation Statistics Report - 2011-2012
Australian Workers Compensation Statistics Report - 2011-2012
 
Understanding Broadband to Influence Business Growth (Price County WI)
Understanding Broadband to Influence Business Growth (Price County WI)Understanding Broadband to Influence Business Growth (Price County WI)
Understanding Broadband to Influence Business Growth (Price County WI)
 
ELECTRICAL SAFETY ASSESSMENT OF POWER INDUSTRY
ELECTRICAL SAFETY ASSESSMENT OF POWER INDUSTRYELECTRICAL SAFETY ASSESSMENT OF POWER INDUSTRY
ELECTRICAL SAFETY ASSESSMENT OF POWER INDUSTRY
 
ONS Economic Forum, 17 April 2023.pptx
ONS Economic Forum, 17 April 2023.pptxONS Economic Forum, 17 April 2023.pptx
ONS Economic Forum, 17 April 2023.pptx
 
11.06.14 ed presentation cabinet
11.06.14 ed presentation   cabinet11.06.14 ed presentation   cabinet
11.06.14 ed presentation cabinet
 
Hssh0910
Hssh0910Hssh0910
Hssh0910
 
Dr.munir baghdad road traffic injuries,Epidemiological Characteristics, 2010-...
Dr.munir baghdad road traffic injuries,Epidemiological Characteristics, 2010-...Dr.munir baghdad road traffic injuries,Epidemiological Characteristics, 2010-...
Dr.munir baghdad road traffic injuries,Epidemiological Characteristics, 2010-...
 
Employment Prospects Avison
Employment Prospects   AvisonEmployment Prospects   Avison
Employment Prospects Avison
 
NABE_IT_Roundtable_China_Tech_Demand_04_2010
NABE_IT_Roundtable_China_Tech_Demand_04_2010NABE_IT_Roundtable_China_Tech_Demand_04_2010
NABE_IT_Roundtable_China_Tech_Demand_04_2010
 
Insurance and Private Pensions Sector in Turkey - Akif EROĞLU (2016)
Insurance and Private Pensions Sector in Turkey - Akif EROĞLU (2016)Insurance and Private Pensions Sector in Turkey - Akif EROĞLU (2016)
Insurance and Private Pensions Sector in Turkey - Akif EROĞLU (2016)
 
Economic Forum - 16 May 2022
Economic Forum - 16 May 2022Economic Forum - 16 May 2022
Economic Forum - 16 May 2022
 
2013 DCD Intelligence Census results, UK figures
2013 DCD Intelligence Census results, UK figures2013 DCD Intelligence Census results, UK figures
2013 DCD Intelligence Census results, UK figures
 
Australian Workers’ Compensation Statistics Report - 2013-2014
Australian Workers’ Compensation Statistics Report - 2013-2014Australian Workers’ Compensation Statistics Report - 2013-2014
Australian Workers’ Compensation Statistics Report - 2013-2014
 
Benchmarking risk againt national data
Benchmarking risk againt national data   Benchmarking risk againt national data
Benchmarking risk againt national data
 
Product Safety Policy in Japan
Product Safety Policy in JapanProduct Safety Policy in Japan
Product Safety Policy in Japan
 
Pathways Institute panel presentation june 23, 2017-- What Will Be
Pathways Institute panel presentation   june 23, 2017-- What Will BePathways Institute panel presentation   june 23, 2017-- What Will Be
Pathways Institute panel presentation june 23, 2017-- What Will Be
 
Australia in Transition: Disruption breeds new infrastructure investment oppo...
Australia in Transition: Disruption breeds new infrastructure investment oppo...Australia in Transition: Disruption breeds new infrastructure investment oppo...
Australia in Transition: Disruption breeds new infrastructure investment oppo...
 
Global Megatrends CSIRO.pdf
Global Megatrends CSIRO.pdfGlobal Megatrends CSIRO.pdf
Global Megatrends CSIRO.pdf
 
Nigel Roberts presents 'It’s Time for a Revolution - Insights from the EY Fut...
Nigel Roberts presents 'It’s Time for a Revolution - Insights from the EY Fut...Nigel Roberts presents 'It’s Time for a Revolution - Insights from the EY Fut...
Nigel Roberts presents 'It’s Time for a Revolution - Insights from the EY Fut...
 

More from myosh team

Critical Control Leadership & Verifications: Operationalising Critical Contro...
Critical Control Leadership & Verifications: Operationalising Critical Contro...Critical Control Leadership & Verifications: Operationalising Critical Contro...
Critical Control Leadership & Verifications: Operationalising Critical Contro...myosh team
 
Understanding Injury Risk in Ageing Workers for a Sustainable Workforce
Understanding Injury Risk in Ageing Workers for a Sustainable WorkforceUnderstanding Injury Risk in Ageing Workers for a Sustainable Workforce
Understanding Injury Risk in Ageing Workers for a Sustainable Workforcemyosh team
 
Benchmarking: Explore Unique Ways to Reflect, Learn and Improve
Benchmarking: Explore Unique Ways to Reflect, Learn and ImproveBenchmarking: Explore Unique Ways to Reflect, Learn and Improve
Benchmarking: Explore Unique Ways to Reflect, Learn and Improvemyosh team
 
Safety vs Wellbeing Programs – How to Boost Employee Engagement
Safety vs Wellbeing Programs – How to Boost Employee EngagementSafety vs Wellbeing Programs – How to Boost Employee Engagement
Safety vs Wellbeing Programs – How to Boost Employee Engagementmyosh team
 
Continuum e-Learning
Continuum e-LearningContinuum e-Learning
Continuum e-Learningmyosh team
 
Psychosocial Dx: Identifying Invisible 45003 Factors
Psychosocial Dx: Identifying Invisible 45003 FactorsPsychosocial Dx: Identifying Invisible 45003 Factors
Psychosocial Dx: Identifying Invisible 45003 Factorsmyosh team
 
Psychosocial Risk Series – 1. ISO 45003 vs Model Code of Practice
Psychosocial Risk Series – 1. ISO 45003 vs Model Code of PracticePsychosocial Risk Series – 1. ISO 45003 vs Model Code of Practice
Psychosocial Risk Series – 1. ISO 45003 vs Model Code of Practicemyosh team
 
myosh Critical Control Management Presentation.pdf
myosh Critical Control Management Presentation.pdfmyosh Critical Control Management Presentation.pdf
myosh Critical Control Management Presentation.pdfmyosh team
 
Psychosocial Risk Series : Mental Fitness – Opening up Conversations
Psychosocial Risk Series : Mental Fitness – Opening up ConversationsPsychosocial Risk Series : Mental Fitness – Opening up Conversations
Psychosocial Risk Series : Mental Fitness – Opening up Conversationsmyosh team
 
Psychosocial Risk Series : Change Management
Psychosocial Risk Series : Change ManagementPsychosocial Risk Series : Change Management
Psychosocial Risk Series : Change Managementmyosh team
 
Navigating H&S in Complex Times
Navigating H&S in Complex TimesNavigating H&S in Complex Times
Navigating H&S in Complex Timesmyosh team
 
Psychosocial Risk Series : HR vs Safety – Psychosocial Ownership
Psychosocial Risk Series : HR vs Safety – Psychosocial OwnershipPsychosocial Risk Series : HR vs Safety – Psychosocial Ownership
Psychosocial Risk Series : HR vs Safety – Psychosocial Ownershipmyosh team
 
Psychosocial Risk Series : Change Management
Psychosocial Risk Series : Change ManagementPsychosocial Risk Series : Change Management
Psychosocial Risk Series : Change Managementmyosh team
 
The State of Safety Culture in Mining Webinar - Slides.pdf
The State of Safety Culture in Mining Webinar - Slides.pdfThe State of Safety Culture in Mining Webinar - Slides.pdf
The State of Safety Culture in Mining Webinar - Slides.pdfmyosh team
 
Operational Leadership and Critical Risk Management
Operational Leadership and Critical Risk ManagementOperational Leadership and Critical Risk Management
Operational Leadership and Critical Risk Managementmyosh team
 
Joint Action Solutions
Joint Action SolutionsJoint Action Solutions
Joint Action Solutionsmyosh team
 
ICMM Critical Control Management Implementation Guide
ICMM Critical Control Management Implementation GuideICMM Critical Control Management Implementation Guide
ICMM Critical Control Management Implementation Guidemyosh team
 
Code of practice - Mine Safety Management System
Code of practice - Mine Safety Management SystemCode of practice - Mine Safety Management System
Code of practice - Mine Safety Management Systemmyosh team
 
Underreporting and the Implications for Serious Injury and Fatality Prevention
Underreporting and the Implications for Serious Injury and Fatality PreventionUnderreporting and the Implications for Serious Injury and Fatality Prevention
Underreporting and the Implications for Serious Injury and Fatality Preventionmyosh team
 
Webinar – OKR vs KPI: Measuring Health and Safety Metrics that Matter
Webinar – OKR vs KPI: Measuring Health and Safety Metrics that MatterWebinar – OKR vs KPI: Measuring Health and Safety Metrics that Matter
Webinar – OKR vs KPI: Measuring Health and Safety Metrics that Mattermyosh team
 

More from myosh team (20)

Critical Control Leadership & Verifications: Operationalising Critical Contro...
Critical Control Leadership & Verifications: Operationalising Critical Contro...Critical Control Leadership & Verifications: Operationalising Critical Contro...
Critical Control Leadership & Verifications: Operationalising Critical Contro...
 
Understanding Injury Risk in Ageing Workers for a Sustainable Workforce
Understanding Injury Risk in Ageing Workers for a Sustainable WorkforceUnderstanding Injury Risk in Ageing Workers for a Sustainable Workforce
Understanding Injury Risk in Ageing Workers for a Sustainable Workforce
 
Benchmarking: Explore Unique Ways to Reflect, Learn and Improve
Benchmarking: Explore Unique Ways to Reflect, Learn and ImproveBenchmarking: Explore Unique Ways to Reflect, Learn and Improve
Benchmarking: Explore Unique Ways to Reflect, Learn and Improve
 
Safety vs Wellbeing Programs – How to Boost Employee Engagement
Safety vs Wellbeing Programs – How to Boost Employee EngagementSafety vs Wellbeing Programs – How to Boost Employee Engagement
Safety vs Wellbeing Programs – How to Boost Employee Engagement
 
Continuum e-Learning
Continuum e-LearningContinuum e-Learning
Continuum e-Learning
 
Psychosocial Dx: Identifying Invisible 45003 Factors
Psychosocial Dx: Identifying Invisible 45003 FactorsPsychosocial Dx: Identifying Invisible 45003 Factors
Psychosocial Dx: Identifying Invisible 45003 Factors
 
Psychosocial Risk Series – 1. ISO 45003 vs Model Code of Practice
Psychosocial Risk Series – 1. ISO 45003 vs Model Code of PracticePsychosocial Risk Series – 1. ISO 45003 vs Model Code of Practice
Psychosocial Risk Series – 1. ISO 45003 vs Model Code of Practice
 
myosh Critical Control Management Presentation.pdf
myosh Critical Control Management Presentation.pdfmyosh Critical Control Management Presentation.pdf
myosh Critical Control Management Presentation.pdf
 
Psychosocial Risk Series : Mental Fitness – Opening up Conversations
Psychosocial Risk Series : Mental Fitness – Opening up ConversationsPsychosocial Risk Series : Mental Fitness – Opening up Conversations
Psychosocial Risk Series : Mental Fitness – Opening up Conversations
 
Psychosocial Risk Series : Change Management
Psychosocial Risk Series : Change ManagementPsychosocial Risk Series : Change Management
Psychosocial Risk Series : Change Management
 
Navigating H&S in Complex Times
Navigating H&S in Complex TimesNavigating H&S in Complex Times
Navigating H&S in Complex Times
 
Psychosocial Risk Series : HR vs Safety – Psychosocial Ownership
Psychosocial Risk Series : HR vs Safety – Psychosocial OwnershipPsychosocial Risk Series : HR vs Safety – Psychosocial Ownership
Psychosocial Risk Series : HR vs Safety – Psychosocial Ownership
 
Psychosocial Risk Series : Change Management
Psychosocial Risk Series : Change ManagementPsychosocial Risk Series : Change Management
Psychosocial Risk Series : Change Management
 
The State of Safety Culture in Mining Webinar - Slides.pdf
The State of Safety Culture in Mining Webinar - Slides.pdfThe State of Safety Culture in Mining Webinar - Slides.pdf
The State of Safety Culture in Mining Webinar - Slides.pdf
 
Operational Leadership and Critical Risk Management
Operational Leadership and Critical Risk ManagementOperational Leadership and Critical Risk Management
Operational Leadership and Critical Risk Management
 
Joint Action Solutions
Joint Action SolutionsJoint Action Solutions
Joint Action Solutions
 
ICMM Critical Control Management Implementation Guide
ICMM Critical Control Management Implementation GuideICMM Critical Control Management Implementation Guide
ICMM Critical Control Management Implementation Guide
 
Code of practice - Mine Safety Management System
Code of practice - Mine Safety Management SystemCode of practice - Mine Safety Management System
Code of practice - Mine Safety Management System
 
Underreporting and the Implications for Serious Injury and Fatality Prevention
Underreporting and the Implications for Serious Injury and Fatality PreventionUnderreporting and the Implications for Serious Injury and Fatality Prevention
Underreporting and the Implications for Serious Injury and Fatality Prevention
 
Webinar – OKR vs KPI: Measuring Health and Safety Metrics that Matter
Webinar – OKR vs KPI: Measuring Health and Safety Metrics that MatterWebinar – OKR vs KPI: Measuring Health and Safety Metrics that Matter
Webinar – OKR vs KPI: Measuring Health and Safety Metrics that Matter
 

Recently uploaded

(ANIKA) Call Girls Wadki ( 7001035870 ) HI-Fi Pune Escorts Service
(ANIKA) Call Girls Wadki ( 7001035870 ) HI-Fi Pune Escorts Service(ANIKA) Call Girls Wadki ( 7001035870 ) HI-Fi Pune Escorts Service
(ANIKA) Call Girls Wadki ( 7001035870 ) HI-Fi Pune Escorts Serviceranjana rawat
 
Regional Snapshot Atlanta Aging Trends 2024
Regional Snapshot Atlanta Aging Trends 2024Regional Snapshot Atlanta Aging Trends 2024
Regional Snapshot Atlanta Aging Trends 2024ARCResearch
 
PPT Item # 4 - 231 Encino Ave (Significance Only)
PPT Item # 4 - 231 Encino Ave (Significance Only)PPT Item # 4 - 231 Encino Ave (Significance Only)
PPT Item # 4 - 231 Encino Ave (Significance Only)ahcitycouncil
 
VIP Call Girls Service Bikaner Aishwarya 8250192130 Independent Escort Servic...
VIP Call Girls Service Bikaner Aishwarya 8250192130 Independent Escort Servic...VIP Call Girls Service Bikaner Aishwarya 8250192130 Independent Escort Servic...
VIP Call Girls Service Bikaner Aishwarya 8250192130 Independent Escort Servic...Suhani Kapoor
 
Incident Command System xxxxxxxxxxxxxxxxxxxxxxxxx
Incident Command System xxxxxxxxxxxxxxxxxxxxxxxxxIncident Command System xxxxxxxxxxxxxxxxxxxxxxxxx
Incident Command System xxxxxxxxxxxxxxxxxxxxxxxxxPeter Miles
 
Artificial Intelligence in Philippine Local Governance: Challenges and Opport...
Artificial Intelligence in Philippine Local Governance: Challenges and Opport...Artificial Intelligence in Philippine Local Governance: Challenges and Opport...
Artificial Intelligence in Philippine Local Governance: Challenges and Opport...CedZabala
 
CBO’s Recent Appeals for New Research on Health-Related Topics
CBO’s Recent Appeals for New Research on Health-Related TopicsCBO’s Recent Appeals for New Research on Health-Related Topics
CBO’s Recent Appeals for New Research on Health-Related TopicsCongressional Budget Office
 
Precarious profits? Why firms use insecure contracts, and what would change t...
Precarious profits? Why firms use insecure contracts, and what would change t...Precarious profits? Why firms use insecure contracts, and what would change t...
Precarious profits? Why firms use insecure contracts, and what would change t...ResolutionFoundation
 
VIP High Class Call Girls Amravati Anushka 8250192130 Independent Escort Serv...
VIP High Class Call Girls Amravati Anushka 8250192130 Independent Escort Serv...VIP High Class Call Girls Amravati Anushka 8250192130 Independent Escort Serv...
VIP High Class Call Girls Amravati Anushka 8250192130 Independent Escort Serv...Suhani Kapoor
 
2024: The FAR, Federal Acquisition Regulations - Part 27
2024: The FAR, Federal Acquisition Regulations - Part 272024: The FAR, Federal Acquisition Regulations - Part 27
2024: The FAR, Federal Acquisition Regulations - Part 27JSchaus & Associates
 
WIPO magazine issue -1 - 2024 World Intellectual Property organization.
WIPO magazine issue -1 - 2024 World Intellectual Property organization.WIPO magazine issue -1 - 2024 World Intellectual Property organization.
WIPO magazine issue -1 - 2024 World Intellectual Property organization.Christina Parmionova
 
VIP Call Girls Pune Vani 8617697112 Independent Escort Service Pune
VIP Call Girls Pune Vani 8617697112 Independent Escort Service PuneVIP Call Girls Pune Vani 8617697112 Independent Escort Service Pune
VIP Call Girls Pune Vani 8617697112 Independent Escort Service PuneCall girls in Ahmedabad High profile
 
Fair Trash Reduction - West Hartford, CT
Fair Trash Reduction - West Hartford, CTFair Trash Reduction - West Hartford, CT
Fair Trash Reduction - West Hartford, CTaccounts329278
 
The Most Attractive Pune Call Girls Handewadi Road 8250192130 Will You Miss T...
The Most Attractive Pune Call Girls Handewadi Road 8250192130 Will You Miss T...The Most Attractive Pune Call Girls Handewadi Road 8250192130 Will You Miss T...
The Most Attractive Pune Call Girls Handewadi Road 8250192130 Will You Miss T...ranjana rawat
 
(TARA) Call Girls Chakan ( 7001035870 ) HI-Fi Pune Escorts Service
(TARA) Call Girls Chakan ( 7001035870 ) HI-Fi Pune Escorts Service(TARA) Call Girls Chakan ( 7001035870 ) HI-Fi Pune Escorts Service
(TARA) Call Girls Chakan ( 7001035870 ) HI-Fi Pune Escorts Serviceranjana rawat
 
2024 Zoom Reinstein Legacy Asbestos Webinar
2024 Zoom Reinstein Legacy Asbestos Webinar2024 Zoom Reinstein Legacy Asbestos Webinar
2024 Zoom Reinstein Legacy Asbestos WebinarLinda Reinstein
 
VIP High Profile Call Girls Gorakhpur Aarushi 8250192130 Independent Escort S...
VIP High Profile Call Girls Gorakhpur Aarushi 8250192130 Independent Escort S...VIP High Profile Call Girls Gorakhpur Aarushi 8250192130 Independent Escort S...
VIP High Profile Call Girls Gorakhpur Aarushi 8250192130 Independent Escort S...Suhani Kapoor
 

Recently uploaded (20)

(ANIKA) Call Girls Wadki ( 7001035870 ) HI-Fi Pune Escorts Service
(ANIKA) Call Girls Wadki ( 7001035870 ) HI-Fi Pune Escorts Service(ANIKA) Call Girls Wadki ( 7001035870 ) HI-Fi Pune Escorts Service
(ANIKA) Call Girls Wadki ( 7001035870 ) HI-Fi Pune Escorts Service
 
Regional Snapshot Atlanta Aging Trends 2024
Regional Snapshot Atlanta Aging Trends 2024Regional Snapshot Atlanta Aging Trends 2024
Regional Snapshot Atlanta Aging Trends 2024
 
PPT Item # 4 - 231 Encino Ave (Significance Only)
PPT Item # 4 - 231 Encino Ave (Significance Only)PPT Item # 4 - 231 Encino Ave (Significance Only)
PPT Item # 4 - 231 Encino Ave (Significance Only)
 
VIP Call Girls Service Bikaner Aishwarya 8250192130 Independent Escort Servic...
VIP Call Girls Service Bikaner Aishwarya 8250192130 Independent Escort Servic...VIP Call Girls Service Bikaner Aishwarya 8250192130 Independent Escort Servic...
VIP Call Girls Service Bikaner Aishwarya 8250192130 Independent Escort Servic...
 
Incident Command System xxxxxxxxxxxxxxxxxxxxxxxxx
Incident Command System xxxxxxxxxxxxxxxxxxxxxxxxxIncident Command System xxxxxxxxxxxxxxxxxxxxxxxxx
Incident Command System xxxxxxxxxxxxxxxxxxxxxxxxx
 
Artificial Intelligence in Philippine Local Governance: Challenges and Opport...
Artificial Intelligence in Philippine Local Governance: Challenges and Opport...Artificial Intelligence in Philippine Local Governance: Challenges and Opport...
Artificial Intelligence in Philippine Local Governance: Challenges and Opport...
 
Russian Call Girls Service Ashiyana Colony { Lucknow Call Girls Service 95482...
Russian Call Girls Service Ashiyana Colony { Lucknow Call Girls Service 95482...Russian Call Girls Service Ashiyana Colony { Lucknow Call Girls Service 95482...
Russian Call Girls Service Ashiyana Colony { Lucknow Call Girls Service 95482...
 
CBO’s Recent Appeals for New Research on Health-Related Topics
CBO’s Recent Appeals for New Research on Health-Related TopicsCBO’s Recent Appeals for New Research on Health-Related Topics
CBO’s Recent Appeals for New Research on Health-Related Topics
 
Precarious profits? Why firms use insecure contracts, and what would change t...
Precarious profits? Why firms use insecure contracts, and what would change t...Precarious profits? Why firms use insecure contracts, and what would change t...
Precarious profits? Why firms use insecure contracts, and what would change t...
 
VIP High Class Call Girls Amravati Anushka 8250192130 Independent Escort Serv...
VIP High Class Call Girls Amravati Anushka 8250192130 Independent Escort Serv...VIP High Class Call Girls Amravati Anushka 8250192130 Independent Escort Serv...
VIP High Class Call Girls Amravati Anushka 8250192130 Independent Escort Serv...
 
2024: The FAR, Federal Acquisition Regulations - Part 27
2024: The FAR, Federal Acquisition Regulations - Part 272024: The FAR, Federal Acquisition Regulations - Part 27
2024: The FAR, Federal Acquisition Regulations - Part 27
 
WIPO magazine issue -1 - 2024 World Intellectual Property organization.
WIPO magazine issue -1 - 2024 World Intellectual Property organization.WIPO magazine issue -1 - 2024 World Intellectual Property organization.
WIPO magazine issue -1 - 2024 World Intellectual Property organization.
 
VIP Call Girls Pune Vani 8617697112 Independent Escort Service Pune
VIP Call Girls Pune Vani 8617697112 Independent Escort Service PuneVIP Call Girls Pune Vani 8617697112 Independent Escort Service Pune
VIP Call Girls Pune Vani 8617697112 Independent Escort Service Pune
 
Fair Trash Reduction - West Hartford, CT
Fair Trash Reduction - West Hartford, CTFair Trash Reduction - West Hartford, CT
Fair Trash Reduction - West Hartford, CT
 
Call Girls In Rohini ꧁❤ 🔝 9953056974🔝❤꧂ Escort ServiCe
Call Girls In  Rohini ꧁❤ 🔝 9953056974🔝❤꧂ Escort ServiCeCall Girls In  Rohini ꧁❤ 🔝 9953056974🔝❤꧂ Escort ServiCe
Call Girls In Rohini ꧁❤ 🔝 9953056974🔝❤꧂ Escort ServiCe
 
The Most Attractive Pune Call Girls Handewadi Road 8250192130 Will You Miss T...
The Most Attractive Pune Call Girls Handewadi Road 8250192130 Will You Miss T...The Most Attractive Pune Call Girls Handewadi Road 8250192130 Will You Miss T...
The Most Attractive Pune Call Girls Handewadi Road 8250192130 Will You Miss T...
 
(TARA) Call Girls Chakan ( 7001035870 ) HI-Fi Pune Escorts Service
(TARA) Call Girls Chakan ( 7001035870 ) HI-Fi Pune Escorts Service(TARA) Call Girls Chakan ( 7001035870 ) HI-Fi Pune Escorts Service
(TARA) Call Girls Chakan ( 7001035870 ) HI-Fi Pune Escorts Service
 
2024 Zoom Reinstein Legacy Asbestos Webinar
2024 Zoom Reinstein Legacy Asbestos Webinar2024 Zoom Reinstein Legacy Asbestos Webinar
2024 Zoom Reinstein Legacy Asbestos Webinar
 
VIP High Profile Call Girls Gorakhpur Aarushi 8250192130 Independent Escort S...
VIP High Profile Call Girls Gorakhpur Aarushi 8250192130 Independent Escort S...VIP High Profile Call Girls Gorakhpur Aarushi 8250192130 Independent Escort S...
VIP High Profile Call Girls Gorakhpur Aarushi 8250192130 Independent Escort S...
 
The Federal Budget and Health Care Policy
The Federal Budget and Health Care PolicyThe Federal Budget and Health Care Policy
The Federal Budget and Health Care Policy
 

Key work health and safety statistics Queensland 2021

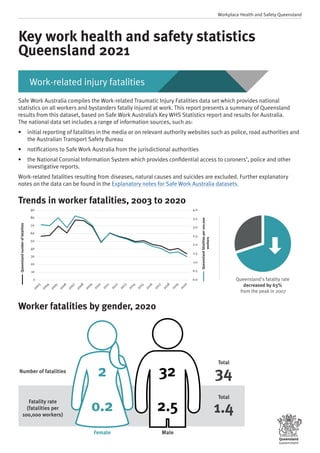
  • 1. Key work health and safety statistics Queensland 2021 Work-related injury fatalities Workplace Health and Safety Queensland Safe Work Australia compiles the Work-related Traumatic Injury Fatalities data set which provides national statistics on all workers and bystanders fatally injured at work. This report presents a summary of Queensland results from this dataset, based on Safe Work Australia’s Key WHS Statistics report and results for Australia. The national data set includes a range of information sources, such as: • initial reporting of fatalities in the media or on relevant authority websites such as police, road authorities and the Australian Transport Safety Bureau • notifications to Safe Work Australia from the jurisdictional authorities • the National Coronial Information System which provides confidential access to coroners’, police and other investigative reports. Work-related fatalities resulting from diseases, natural causes and suicides are excluded. Further explanatory notes on the data can be found in the Explanatory notes for Safe Work Australia datasets. Trends in worker fatalities, 2003 to 2020 Queensland's fatality rate decreased by 63% from the peak in 2007 0.0 0.5 1.0 1.5 2.0 2.5 3.0 3.5 4.0 0 10 20 30 40 50 60 70 80 90 2 0 1 7 2 0 1 8 2 0 1 9 2 0 2 0 2 0 1 6 2 0 1 5 2 0 1 4 2 0 1 3 2 0 1 2 2 0 1 1 2 0 1 0 2 0 0 9 2 0 0 8 2 0 0 7 2 0 0 6 2 0 0 5 2 0 0 4 2 0 0 3 Queensland number of fatalities Queensland fatalities per 100,000 workers Worker fatalities by gender, 2020 Number of fatalities Fatality rate (fatalities per 100,000 workers) 2 0.2 32 2.5 Total 34 Total 1.4 Male Female
  • 2. Work-related injury fatalities Key work health and safety statistics Queensland 2021 page 2 Worker fatalities by age group, 2020 Age group (years) Queensland number of fatalities Queensland fatality rate (fatalities per 100,000 workers) under 25 1 0.2 25–34 3 0.5 35–44 5 0.9 45–54 6 1.2 55–64 15 4.2 65 and over 4 4.7 Total 34 1.4 Worker fatality by state/territory, 2020* fatalities (4.6 per 100,000 workers) fatalities (2.1 per 100,000 workers) 11 34 53 fatalities (0.8 per 100,000 workers) 8 51 194 Australian Total 6 29 fatalities (1.3 per 100,000 workers) fatalities (1.4 per 100,000 workers) fatalities (1.3 per 100,000 workers) fatalities (1.5 per 100,000 workers) fatalities (3.2 per 100,000 workers) fatalities (1.5 per 100,000 workers) 2 * Fatalities are presented according to the state or territory where the fatality occurred, not the jurisdiction under which the fatality fell.
  • 3. Work-related injury fatalities Key work health and safety statistics Queensland 2021 page 3 Worker fatalities by mechanism of incident, 2020 Other mechanisms Contact with electricity Falls from a height Rollover of non-road vehicle Being trapped by moving machinery Being hit by moving objects Being hit by falling objects Vehicle incident* 56% 9% 6% 6% 6% 3% 3% 12% Note: Only mechanisms accounting for 5 per cent or more of national fatalities are included. The remaining mechanisms are grouped together under ‘other mechanisms’. Work-related injury fatalities by mechanism of fatal injury, 2020 Queensland number of fatalities Queensland proportion of injury fatalities Vehicle incident* 19 56% Being hit by falling objects 3 9% Being hit by moving objects 2 6% Being trapped by moving machinery 2 6% Rollover of non-road vehicle 2 6% Falls from a height 1 3% Contact with electricity 1 3% Other mechanisms 4 12% Total 34 100% *Vehicle collisions include fatalities that occurred as a direct result of a vehicle crash. Vehicles include not only road vehicles such as cars and trucks, but also machines such as aircraft, boats, loaders, tractors and quad bikes.
  • 4. Work-related injury fatalities Key work health and safety statistics Queensland 2021 page 4 Worker fatalities by occupation, 2020 Machinery operators and drivers Technicians and Trades Workers Labourers 3.7 fatalities per 100,000 workers 5.8 fatalities per 100,000 workers fatalities per 100,000 workers 1.7 Work-related injury fatalities by occupation, 2020 Queensland number of fatalities Queensland fatality rate (fatalities per 100,000 workers) Machinery operators and drivers 10 5.8 Labourers 10 3.7 Technicians and trades workers 6 1.7 Managers 5 1.6 Community and personal service workers 1 0.4 Clerical and administrative workers 1 0.3 Professionals 1 0.2 Sales workers 0 0.0 Total 34 1.4
  • 5. Work-related injury fatalities Key work health and safety statistics Queensland 2021 page 5 Worker fatalities by industry, 2020 Agriculture, forestry and fishing 12.2 Transport, postal and warehousing 7.9 Electricity, gas, water and waste services 3.5 fatalities per 100,000 workers fatalities per 100,000 workers fatalities per 100,000 workers Work-related injury fatalities by industry, 2020 Queensland number of fatalities Queensland fatality rate (fatalities per 100,000 workers) Agriculture, forestry and fishing 11 12.2 Transport, postal and warehousing 10 7.9 Electricity, gas, water and waste services 1 3.5 Administrative and support services 2 2.5 Rental, hiring and real estate services 1 2.0 Construction 4 1.7 Mining 1 1.5 Manufacturing 2 1.2 Accommodation and food services 1 0.6 Health care and social assistance 1 0.3 Public administration and safety 0 0.0 Professional, scientific and technical services 0 0.0 Other services 0 0.0 Education and training 0 0.0 Retail trade 0 0.0 Wholesale trade 0 0.0 Arts and recreation services 0 0.0 Financial and insurance services 0 0.0 Information media and telecommunications 0 0.0 Total 34 1.4
  • 6. Work-related injury and disease Key work health and safety statistics Queensland 2021 page 6 Safe Work Australia compiles the National Dataset for Compensation-based Statistics which comprises information on workers’ compensation claims provided by each of the jurisdictional workers’ compensation authorities. Data in this report refers to Queensland serious claims only. Serious claims relate to where the compensated injury or disease resulted in one week or more off work. Data for 2019–20 is preliminary (denoted by a ‘p’) and therefore is subject to revision in subsequent years as further claims are finalised. Serious claim numbers are rounded to the nearest five and as such the figures may not add to the total. Further explanatory notes on the data can be found in the Explanatory notes for Safe Work Australia datasets. Serious claims statistics, 2019-20p* Median time lost 5.6 weeks per serious claim Frequency rate of 7.6 serious claims per million hours worked Median compensation paid $9,900 per serious claim Total of 28,732 serious claims *preliminary data subject to revision in subsequent years as further claims are finalised. Serious claim rate, 2000–01 to 2019–20p* The Queensland serious claim frequency rate dropped by 19% from 2009–10 to 2018–19 0 2 4 6 8 10 12 14 16 18 20 2000-01 2001-02 2002-03 2003-04 2004-05 2005-06 2006-07 2007-08 2008-09 2009-10 2010-11 2011-12 2012-13 2013-14 2014-15 2015-16 2016-17 2017-18 2019-20p* 2018-19 Queensland incidence rate (serious claims per 1,000 employees) Queensland frequency rate (serious claims per million hours worked) *preliminary data subject to revision in subsequent years as further claims are finalised.
  • 7. Work-related injury and disease Key work health and safety statistics Queensland 2021 page 7 Serious claims by gender, 2019–20p* Frequency rate (serious claims per million hours worked) Median time lost from work (weeks) Median compensation paid per claim 5.4 $7,600 5.6 6.8 8.2 $11,400 Male Female Gender Number of serious claims Frequency rate (serious claims per million hours worked) Incidence rate (serious claims per 1000 employees) Queensland female 11,000 6.8 9.6 Queensland male 17,660 8.2 15.0 Queensland total 28,730 7.6 12.4 *preliminary data subject to revision in subsequent years as further claims are finalised.
  • 8. Work-related injury and disease Key work health and safety statistics Queensland 2021 page 8 Serious claims by age group, 2019–20p* Workers aged 60-64 years had the highest claim rate of Workers aged 35-39 years had the lowest claim rate of claims per million hours worked 6.6 claims per million hours worked 10.2 Age group (years) Number of serious claims Queensland frequency rate (serious claims per million hours worked) Queensland incidence rate (serious claims per 1,000 employees) Under 20 1,056 7.5 7.0 20-24 2,872 8.3 12.2 25-29 3,233 6.8 11.6 30-34 3,032 6.6 11.0 35-39 2,895 6.6 11.5 40-44 2,960 7.0 12.4 45-49 3,352 7.2 12.9 50-54 3,404 8.7 15.3 55-59 3,097 9.3 15.6 60-64 2,082 10.2 15.8 65 and over 749 7.0 9.4 Total 28,732 7.6 12.4 *preliminary data subject to revision in subsequent years as further claims are finalised. **The 65 and over age group had a frequency rate of 7.4 claims per million hours worked in Queensland, however rates are likely to be understated due to retirement choices.
  • 9. Work-related injury and disease Key work health and safety statistics Queensland 2021 page 9 Serious claims by mechanism of incident, 2019–20p* Body stressing 41% Falls, trips and slips of a person 23% Sound and pressure Biological factors Chemicals and other substances Heat, electricity and other environmental factors Mental stress Vehicle incidents and other Hitting objects with a part of the body Being hit by moving objects Falls, trips and slips of a person Body stressing 41% 23% 16% 7% 5% 5% 1% 1% Mechanism of incident Queensland number of serious claims Proportion of serious claims Female Male Total Female Male Total Body stressing 4,767 7,114 11,902 43% 40% 41% Falls, trips and slips of a person 2,774 3,699 6,495 25% 21% 23% Being hit by moving objects 1,346 3,184 4,546 12% 18% 16% Hitting objects with a part of the body 463 1,618 2,089 4% 9% 7% Vehicle incidents and other 530 958 1,489 5% 5% 5% Mental stress 816 574 1,390 7% 3% 5% Heat, electricity and other environmental factors 165 252 420 1% 1% 1% Chemicals and other substances 94 166 260 1% 1% 1% Biological factors 41 64 105 0% 0% 0% Sound and pressure 6 30 36 0% 0% 0% Total 11,002 17,659 28,732 100% 100% 100% *preliminary data subject to revision in subsequent years as further claims are finalised. **other mechanisms of incident include biological factors, sound and pressure, other multiple mechanisms of incident, roll over, slide or cave-in and unspecified mechanisms of incident. ***vehicle collisions include claims where the injury was the direct result of a vehicle crash. Vehicles include not only road vehicles such as cars and trucks, but also machines such as aircraft, boats, loaders, tractors and quad bikes.
  • 10. Work-related injury and disease Key work health and safety statistics Queensland 2021 page 10 Serious claims by nature of injury/disease, 2019–20p* Disease 9% Traumatic joint/ligament and muscle/tendon injury 49% Wounds, lacerations, amputations and internal organ damage 13% Injury 91% Intracranial injuries Nervous system and sense organ diseases Burn Digestive system diseases Other injuries Mental disorders Fractures Musculoskeletal and connective tissue diseases Wounds, lacerations, amputations and internal organ damage Traumatic joint/ligament and muscle/tendon injury 49% 13% 12% 11% 5% 3% 2% 2% 1% 1% Note: Order of injury is based on national results. Nature of injury/disease Queensland number of serious claims Proportion of serious claims Female Male Total Female Male Total Traumatic joint/ligament and muscle/tendon injury 5,720 8,403 14,155 53% 48% 49% Wounds, lacerations, amputations and internal organ damage 861 2,982 3,858 8% 17% 13% Musculoskeletal and connective tissue diseases 1,538 1,824 3,371 14% 11% 12% Fractures 1,034 2,038 3,082 10% 12% 11% Mental disorders 823 595 1,418 8% 3% 5% Other injuries 325 468 794 3% 3% 3% Digestive system diseases 36 480 516 0% 3% 2% Burn 172 303 478 2% 2% 2% Nervous system and sense organ diseases 189 167 356 2% 1% 1% Intracranial injuries 79 88 167 1% 1% 1% Total 10,777 17,348 28,732 100% 100% 100% *preliminary data subject to revision in subsequent years as further claims are finalised. **other injuries includes those related to poisoning, electrocution, air pressure, weather conditions, unspecified injuries and injuries not classified elsewhere. ***Injuries or diseases accounting for less than 1% of serious claims nationally are not included separately but are included in the tota
  • 11. Work-related injury and disease Key work health and safety statistics Queensland 2021 page 11 Serious claims by bodily location of injury, 2019–20p* 25% 37% 5% 3% 2% 25% 2% Trunk Arms/upper limbs Neck Head Lower limbs Other locations*** Non-physical locations Body location of injury/disease Number of serious claims Proportion of serious claims Upper limbs 10,699 37% Trunk 7,186 25% Lower limbs 7,129 25% Non-physical locations 1,418 5% Head 880 3% Multiple locations 607 2% Neck 588 2% Total 28,732 100% *Preliminary data subject to revision in subsequent years as further claims are finalised. Order of results is based on national results. **Claims where the bodily location was unknown are not included separately but are included in the total. ***Other locations include multiple locations and systemic locations.
  • 12. Work-related injury and disease Key work health and safety statistics Queensland 2021 page 12 Serious claims by occupation, 2019–20p* 24%Labourers 19% Community and personal service workers 18% Technicians and trades workers 14% Machinery operators and drivers 8% Professionals 4%Sales workers 3% Clerical and administrative workers 3% Managers 6% Not stated Labourers 20.3 serious claims per million hours worked Machinery operators and drivers 13.2 serious claims per million hours worked Community and personal service workers 15.6 serious claims per million hours worked Proportion of serious claims *preliminary data subject to revision in subsequent years as further claims are finalised. Serious claims by occupation, 2019–20p* Occupation Number of serious claims Queensland frequency rate (serious claims per million hours worked) Queensland incidence rate (serious claims per 1,000 employees) Labourers 6,889 20.3 28.9 Community and personal service workers 5,576 15.6 20.1 Technicians and trades workers 5,214 8.8 16.4 Machinery operators and drivers 4,148 13.2 25.1 Professionals 2,345 2.7 4.6 Sales workers 1,256 4.5 5.6 Clerical and administrative workers 868 1.8 2.7 Managers 837 1.5 3.2 Not stated 1,599 n/a n/a Total 28,732 7.6 12.4 *Preliminary data subject to revision in subsequent years as further claims are finalised. Order of results is based on national results. **Claims where the occupation was unknown are not included separately but are included in the total.
  • 13. Work-related injury and disease Key work health and safety statistics Queensland 2021 page 13 Serious claims by industry, 2019–20p* Health care and social assistance Manufacturing Proportion of serious claims Administrative and support services** serious claims per million hours worked 10.8 serious claims per million hours worked 11.8 serious claims per million hours worked 14.7 19% Health care and social assistance 12% Manufacturing 12% Construction 7% Retail trade 7% Administrative and support services 7% Public administration and safety 7% Transport, postal and warehousing 6% Education and training *Preliminary data subject to revision in subsequent years as further claims are finalised. **The Administrative and support services industry includes labour hire workers. For example; some construction workers. ***‘Other industries’ includes all other industries excluding the top nine industries by number of serious claims.
  • 14. Work-related injury and disease Key work health and safety statistics Queensland 2021 page 14 Serious claims by industry, 2019–20p* Industry Number of serious claims Queensland frequency rate (serious claims per million hours worked) Queensland incidence rate (serious claims per 1,000 employees) Health care and social assistance 5,474 10.8 15.9 Manufacturing 3,377 11.8 22.0 Construction 3,314 8.8 17.2 Retail trade 2,082 6.6 9.0 Administrative and support services 2,079 14.7 22.9 Public administration and safety 1,910 8.3 13.4 Transport, postal and warehousing 1,871 9.3 16.9 Education and training 1,811 5.4 8.3 Accommodation and food services 1,669 7.2 8.7 Wholesale trade 1,174 9.2 17.3 Agriculture, forestry and fishing 1,072 9.9 20.7 Other services 852 5.9 9.5 Mining 518 4.1 8.6 Arts and recreation services 375 6.5 8.2 Professional, scientific and technical services 334 1.1 2.0 Rental, hiring and real estate services 290 3.6 6.1 Electricity, gas, water and waste services 256 4.4 8.2 Financial and insurance services 99 0.9 1.7 Information media and telecommunications 55 1.2 2.1 Not stated division 120 n/a n/a Total 28,732 7.6 12.4 *preliminary data subject to revision in subsequent years as further claims are finalised. ** Claims where the industry was unknown are not included separately but are included in the total. © State of Queensland 2022. Unless otherwise noted, this document is available under a Creative Commons Attribution 4.0 International Licence (https://creativecommons. org/licenses/). You are free to copy and redistribute the work, so long as you attribute The State of Queensland. The material presented in this publication is distributed by the Queensland Government for information only and is subject to change without notice. The Queensland Government disclaims all responsibility and liability (including liability in negligence) for all expenses, losses, damages and costs incurred as a result of the information being inaccurate or incomplete in any way and for any reason. PN12783 AEU22/6336