A Mixed Model, Repeated Measure Analysis of Demographics and Dry Eye Signs and Symptoms in a Dry Eye Population - ARVO 2015 Poster - Kirk Bateman
•
1 like•485 views

Kirk Bateman (Director, Biostatistics at SDC) presented the poster "A mixed model, repeated measure analysis of demographics and dry eye signs and symptoms in a dry eye population" at the Association for Research in Vision and Ophthalmology (ARVO) 2015 Annual Meeting in Denver, CO on May 6, 2015.

Recommended
More Related Content
What's hot
What's hot (12)
Similar to A Mixed Model, Repeated Measure Analysis of Demographics and Dry Eye Signs and Symptoms in a Dry Eye Population - ARVO 2015 Poster - Kirk Bateman
Similar to A Mixed Model, Repeated Measure Analysis of Demographics and Dry Eye Signs and Symptoms in a Dry Eye Population - ARVO 2015 Poster - Kirk Bateman (20)
More from Statistics & Data Corporation
More from Statistics & Data Corporation (11)
Recently uploaded
Recently uploaded (20)
A Mixed Model, Repeated Measure Analysis of Demographics and Dry Eye Signs and Symptoms in a Dry Eye Population - ARVO 2015 Poster - Kirk Bateman
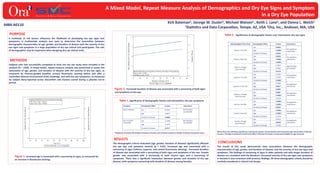
- 1. Kirk Bateman1, George W. Ousler2, Michael Watson2 , Keith J. Lane2, and Donna L. Welch2 1Statistics and Data Corporation, Tempe, AZ, USA 2Ora, Inc., Andover, MA, USA A Mixed Model, Repeat Measure Analysis of Demographics and Dry Eye Signs and Symptom in a Dry Eye Population PURPOSE A multitude of risk factors influences the likelihood of developing dry eye signs and symptoms. A multivariate analysis was used to determine the association between demographic characteristics of age, gender, and duration of disease with the severity of dry eye signs and symptoms in a large population of dry eye clinical trial participants. The role of demographics may be important when designing dry eye clinical trials. METHODS Subjects who had successfully completed at least one dry eye study were included in the analysis (N = 1343). A mixed-model, repeat-measure analysis was performed to assess the association of age, gender, and duration of disease with the severity of dry eye signs, as measured by clinician-graded baseline corneal fluorescein staining before and after a Controlled Adverse Environment (CAE) challenge, and with dry eye symptoms, as measured by subject diary-reported ocular discomfort and dryness scored during a placebo run-in period. Figure 2. Increased duration of disease was associated with a worsening of both signs and symptoms of dry eye. Figure 1. Increased age is associated with a worsening of signs, as measured by an increase in fluorescein staining. Table 1. Significance of demographic factors and interactions: dry eye symptoms RESULTS The demographic criteria evaluated (age, gender, duration of disease) significantly affected dry eye sign and symptom severity (p < 0.05). Increased age was associated with a worsening of signs (inferior, superior, and central fluorescein staining). Increased duration of disease was associated with a worsening of both signs and symptoms of dry eye. Female gender was associated with a worsening of both clinical signs and a worsening of symptoms. There was a significant interaction between gender and duration of dry eye disease, with symptoms worsening with duration of disease among females. CONCLUSIONS The results of this study demonstrate clear associations between the demographic characteristics of age, gender, and duration of disease, and the severity of dry eye signs and symptoms. The findings of worsening of signs in older patients and with longer duration of disease are consistent with the literature. Increased severity of dry eye signs and symptoms in females is also consistent with previous findings. All three demographic criteria should be carefully considered in clinical trial design. Table 2. Significance of demographic factors and interactions: dry eye signs Where there was statistical significance, staining was greater among females and increased as age and duration of disease increase. †Change in staining increased as duration of disease increased, and decreased slightly as age increased. †Symptoms increased with duration of disease in females, and remained constant as duration of disease increased in males. 4484-A0110 Staining Region/Time Point Demographic Effect P-value Interactions Inferior / Pre-CAE Sex 0.0056 No significant interactions Age < 0.0001 Duration of disease 0.0326 Inferior / Post-CAE Sex 0.0030 No significant interactionsAge < 0.0001 Duration of disease < 0.0001 Inferior / Change (Post-Pre) CAE Sex 0.3632 Age*Duration (p=0.0161)†Age 0.4045 Duration of disease 0.0110 Superior / Pre-CAE Sex 0.4163 No significant interactionsAge 0.7539 Duration of disease < 0.0001 Superior / Post-CAE Sex 0.3066 No significant interactionsAge 0.0017 Duration of disease 0.0004 Superior / Change (Post-Pre) CAE Sex 0.0007 No significant interactionsAge < 0.0001 Duration of disease 0.5214 Central / Pre-CAE Sex < 0.0001 No significant interactionsAge < 0.0001 Duration of disease 0.0265 Central / Post-CAE Sex < 0.0001 No significant interactionsAge < 0.0001 Duration of disease 0.1718 Central / Change (Post-Pre) CAE Sex 0.6214 No significant interactionsAge 0.0039 Duration of disease 0.2185 Symptom Demographic Effect p-value Interactions Run-in dryness Sex 0.0592 Sex*Duration (p=0.0149)† Age 0.0877 Duration of disease 0.0002 Run-in Ocular Discomfort Sex 0.1290 Sex*Duration (p=0.0022)† Age 0.1975 Duration of disease 0.0117