
Recommended
Recommended
More Related Content
Similar to The Maths of Moths 20230422.pptx
Similar to The Maths of Moths 20230422.pptx (8)
Recently uploaded
Recently uploaded (20)
The Maths of Moths 20230422.pptx
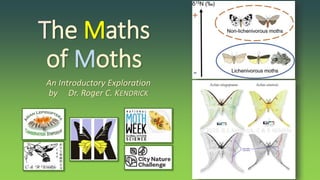
- 1. The Maths of Moths An Introductory Exploration by Dr. Roger C. KENDRICK
- 2. INTRODUCING MATHEMATICAL APPROACHES TO HELP UNDERSTAND THE ECOLOGY & CONSERVATION OF MOTHS
- 3. WHAT ? WHY ? WHEN ? WHERE ? HOW ?
- 4. WHAT ? LEPIDOPTERA . . . .
- 5. Lepidoptera: MAIN FEATURES “scale winged” insects t h e r e a r e 2 7 fe a t u r e s t h a t d e f i n e L e p i d o p t e ra 4 main features visible “in the field” ( u s i n g a h a n d - l e n s f o r s m a l l e r f e a t u r e s o r o n s m a l l e r m o t h s ) . . . .
- 10. WHY ? BECAUSE . . . .
- 11. M o t h s in the W e b o f L i f e recyclers parasites symbiotic mutualism pollinators primary producers secondary consumers
- 12. M o t h s in the W e b o f L i f e primary producers secondary consumers recyclers parasites symbiotic mutualism pollinators
- 14. WHERE ? GEOGRAPHY; ECOLOGY; SCALE DEPENDENCY: Landscapes; Habitats; Niche
- 18. Moths cryptic species Source: Chiocchio et al, 2021 https://link.springer.com/article/10.1007/s13127-020-00474-9
- 19. DESCRIPTIVE ALPHA, BETA & GAMMA D I V E R S I T Y https://ricottalab.files.wordpress.com/2015/06/ricotta-pavoine-2015-ecolind-full.pdf
- 20. DESCRIPTIVE COMMUNITY STUCTURE Similarity; Evenness; Assemblages POPULATION VIABILITY; METAPOPULATIONS
- 23. ANALYTICAL (STATISTICAL APPROACHES) MORPHOLGY; MOLECULAR (FUNCTIONAL ECOLOGY) POPULATIONS; COMMUNITIES
- 24. ANALYTICAL (STATISTICAL APPROACHES) NULL( H 0 ) & WORKING( H 1 ) HYPOTHESES EXPERIMENTAL DESIGN TEST FOR NORMALITY OF DATA SELECT APPROPRIATE DATA ANALYSIS METHOD
- 31. DESCRIPTIVE vs ANALYTICAL approaches can describe the ecological richness, diversity and functionality of and between sites (populations); experimental design key to model used
- 32. The Maths of Moths THANK YOU
Editor's Notes
- hairs on wings modified as scales
- presence of a bi-tubular, coilable, “tongue” (the haustellum)
- Presence of “vom Rath’s organ” in terminal segment of labial palp CO2 detection (flower at peak nectar production)
- Fore tibia with movable “epiphysis” (antenna comb) on inner surface
- nutrient flow through the trophic guilds, with Lepidoptera as the focus (causation agent).
- Examples. primary consumers (plants, fungi, algae, lichens); recyclers (dead flora & fauna, keratin, coprophages); predators (other Lep larvae; other small insects (Hawai’ian Eupitheciini)); parasites (ants, fulgoroids) larvae & pupae are food for – birds, mammals (e.g. bats, bears, rodents, humans), spiders, Hemiptera, Orthoptera, Coleoptera, Hymenoptera (social and parasitic spp.), Diptera, reptiles; fungi (Cordyceps) Moths as parasites – the family Epipyropidae have larvae that are external parasites on fulgoroid bugs (free pest control for Longan and Lychee farmers) Symbiotic mutualism: the story of co-evolution between Epicephala moths and Phyllanthaceae plants – the moths are the sole pollinators, and their larvae are seed / fruit predators, of Phllyanthaceae; one cannot exist without the other.
- descriptive statistics is to summarize a collection of data in a clear and understandable way. Analytical (=Inferential) statistics are used to draw inferences about a population from a sample There are two main methods used in inferential statistics: estimation and hypothesis testing. In estimation, the sample is used to estimate a parameter and a confidence interval about the estimate is constructed. In the most common use of hypothesis testing, a "straw man" null hypothesis is put forward and it is determined whether the data are strong enough to reject it. https://davidmlane.com/hyperstat/intro.html
- Example – the widespread handmaiden moth Syntomis phegea looks the same as 4 (at least) other geographically restricted (within the distribution of phegea), and genetically different, “cryptic” Syntomis species in the Mediterranean region. the presence of endemic species (previous slide) and cryptic species highlights the plight of the rest of nature - Key concept of human impact – the need for conservation of all life on the only planet around that supports life.
- local scale diversity (alpha diversity) Beta diversity, or the amount of variation in species composition among sampling units (or communities, plots, etc.) regional species pool (gamma diversity)
- why diversity? 1. diversity is a central theme in ecology 2. measures of diversity are regarded as indicators of ecological system wellbeing 3. problematic – many different ways to measure diversity, stems from there being TWO components: species richness and the abundance of each species Moths are a species rich group AND can be very abundant. They are relatively easily identified to species and thus are a good biological unit to use for diversity modelling. Fitting to a distribution model…… and the Q statistic (gives indication of community diversity without being biased by very rare or very abundant species).
- Broadly speaking, a metapopulation is a group of populations (often called **subpopulations) that occupy spatially distinct habitat patches that are close enough to support dispersal among patches. Patches in a metapopulation are connected via dispersal. If there were no connectivity (dispersal among patches), it wouldn’t really be a metapopulation, but rather a set of isolated populations that you could model independently. Including a dispersal process allows us (finally!) to think about the whole “BIDE” equation! ΔN=B+I−D−E Metapopulation ecology covers a wide range of scenarios- as long as there are distinct habitat patches (subpopulations) in a landscape, and as long as there is some dispersal among patches, then it is a type of metapopulation. When there is a very high rate of dispersal (and mating) among patches, then the metapopulation is described as “panmictic” (perfect genetic connectivity). I is the total fraction of patches that are colonized by immigrants per time period (colonization rate, or “immigration” rate). E is the total fraction of patches that are extirpated per time period (extirpation rate).
- multivariate analyses not dealt with by this chart, so examples for PCA, ANOVA and NMDS included; coming up shortly…..
- https://watermark.silverchair.com/aesame0191.pdf capital breeding strategy: organisms that use energy stores built up before reproduction to breed
- https://nl.pensoft.net/article/34390/
- https://onlinelibrary.wiley.com/doi/full/10.1111/ddi.12864
- https://www.sciencedirect.com/science/article/abs/pii/S122686151830356X
- https://besjournals.onlinelibrary.wiley.com/doi/pdf/10.1046/j.1365-2664.2000.00490.x