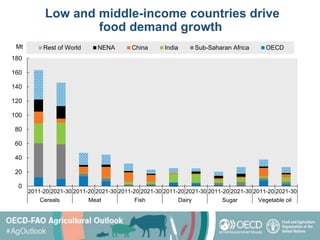
1. Low and middle-income countries drive
food demand growth
0
20
40
60
80
100
120
140
160
180
2011-20 2021-30 2011-20 2021-30 2011-20 2021-30 2011-20 2021-30 2011-20 2021-30 2011-20 2021-30
Cereals Meat Fish Dairy Sugar Vegetable oil
Rest of World NENA China India Sub-Saharan Africa OECD
Mt
2. 0
500
1000
1500
2000
2500
3000
3500
4000
2018-20 2030 2018-20 2030 2018-20 2030 2018-20 2030 2018-20 2030
World High Income Upper Middle
Income
Lower Middle
Income
Low Income
kcal/day/person Staples Animal products Fats Sweeteners Other
Limited convergence in diet composition
Per capita availability of the main food groups (in calories)
6. A few countries/regions dominate livestock
production
0
5
10
15
20
25
30
35
40
2018-20
2030
2018-20
2030
2018-20
2030
2018-20
2030
2018-20
2030
2018-20
2030
2018-20
2030
2018-20
2030
China India Asia Pacific
(excl. China
and India)
Sub-Saharan
Africa
Near East and
North Africa
Europe and
Central Asia
North America Latin America
and the
Caribbean
Mt/year Poultry Pork Beef Sheep Milk Eggs Fish
7. Limited change in agricultural land use
2018-20 to 2030
-1.2
-1
-0.8
-0.6
-0.4
-0.2
0
0.2
0.4
0.6
0.8
-12
-10
-8
-6
-4
-2
0
2
4
6
8
Asia Pacific Sub-Saharan
Africa
Near East and
North Africa
Europe and
Central Asia
North America Latin America
and Caribbean
%
Mha Cropland Pastureland Total growth (right axis)
8. -0.5
0
0.5
1
1.5
2
2.5
Asia Pacific Sub-Saharan
Africa
Near East and
North Africa
Europe and
Central Asia
North America Latin America
and Caribbean
% p.a. Growth in agricultural production Growth in GHG emissions
Declining carbon intensity of agricultural
production
Annual change in agricultural output and direct GHG emissions, 2021-30
9. -110
-60
-10
40
90
Europe and
Central Asia
North America Latin America
and the
Caribbean
Asia Pacific Near East and
North Africa
Sub-Saharan
Africa
Bln USD
2008-10 2018-20 2030
Increasing differentiation between net exporting
and net importing regions
Net trade, in constant 2014-16 USD
10. 0
10
20
30
40
50
60
70
World Asia Pacific Sub-Saharan
Africa
Near East and
North Africa
Europe and
Central Asia
North America Latin America
and Caribbean
% 2008-10 2018-20 2030
Trade is essential for global food security
Imports as a share of total calorie availability
"Note: Calculated on per-capita GDP and excludes food consumed away from home. The 38 individual countries and 11 regional aggregates in the baseline are classified into the four income groups according to their respective per-capita income in 2018. The applied thresholds are: low: < 1,550 USD, lower-middle: < 3,895 USD, upper-middle: < 13,000 USD, high: > 13,000 USD."
Note: Crushing of oilseeds is not reported as the uses of 'vegetable oil' and 'protein meal' are included in the total; Dairy refers to all dairy products in milk solid equivalent units; Sugar biofuel use refers to sugarcane and sugarbeet, converted into sugar equivalent units.
Per capita consumption of main food groups (calorie equivalent), by income group
Note: The 38 individual countries and 11 regional aggregates in the baseline are classified into the four income groups according to their respective per-capita income in 2018. The applied thresholds are: low: < USD 1 550, lower-middle: < USD 3 895, upper-middle: < USD 13 000, high: > USD 13 000. Staples includes cereals roots and pulses. Animal products include meat, dairy products (exluding butter), eggs and fish. Fats include butter and vegetable oil. The category others include fruits, vegetables etc.
Global feed energy and protein use
Global growth in crop production
Note: Figure shows the decomposition of total production growth (2010-19 and 2020-29) into growth in land use, land intensification through growth in multi-cropped land, and growth in yields. It covers the following crops: cotton, maize, other coarse grains, other oilseeds, pulses, rice, roots and tubers, soybean, sugarbeet, sugarcane, wheat and palm oil.