SlideShare a Scribd company logo
1 of 1
Download to read offline
NOS SERVICES
ANALYSIS EST LE REPRÉSENTANT REGIONAL DE
KANTAR TNS, LE LEADER MONDIAL DES RECHERCHES
MARKETING ET CONSEILS www.kantartns.io
NOS FORMATIONS
ANALYSIS INSTITUTE OF MANAGEMENT (AIM) EST
LE REPRÉSENTANT RÉGIONAL DE L'UNIVERSITÉ PARIS
DAUPHINE ET DE L'IAE SORBONNE BUSINESS SCHOOL
ÉTUDE SUR LA CONFIANCE DES CONSOMMATEURS MAURICIENS
LES CONSOMMATEURS SONT EN ATTENTE MAIS SONT PLUS OPTIMISTES QU’AU PREMIER TRIMESTRE DE 2016
3Tri
2016
INDICE DE CONFIANCE
Le moral des consommateurs mauriciens se stabilise
depuis le second trimestre 2016
71.8
77.9
76.9
2013
2014
2015
2016
LA SITUATION ÉCONOMIQUE ACTUELLE
BONNE MAUVAISE NI L’UN
NI L’AUTRE
2.71 sur 10 Mauriciens
la trouve très bonne
4 sur 10 Mauriciens
la trouve Mauvaise
3.29 sur 10 Mauriciens
la trouve ni bonne
ni mauvaise
2016
2015
2014
57%
27.9% 27.1%
34.2%
47%
50.9%
47.6%
21.3%
28.1% 28.6%
50.5%
Par trimestre
1 2 31 2 3 41 2 3 4
2016
Premier
Trimestre
Second
Trimestre
Troisième
Trimestre
NE SAIS PAS
26.2%
26.7%
BONNE DIRECTION
27.0%
24.9%
MAUVAISE DIRECTION
46.8%
21.8% 37.2%41.0%
48.4%
Note: Chiffres basés sur les trois trimestres 2016
PERCEPTION GÉNÉRALE DE L’ÉVOLUTION DE
L’ILE MAURICE
L’AVENIR ÉCONOMIQUE DE MAURICE DANS
LES 6 PROCHAINS MOIS
BONNE PERCEPTION
18.7%
MAUVAISE PERCEPTION
36.2%
NE SAIS PAS
45.1%
Indice de confiance
du premier trimestre
Indice de confiance
du second trimestre
Indice de confiance
du troisième trimestre
2Tri
2016
1Tri
2016
2Tri
2013
Tendances & Attentes Consommateurs
Étude d’usage et attitude, segmentation, étude ethnographique, étude qualitative.
LE NOMBRE D’OPTIMISTES PAR RAPPORT À LA
SITUATION ÉCONOMIQUE RÉGRESSE
INCERTITUDE ET ANTICIPATION NÉGATIVE PRIMENT

More Related Content

More from AIM Analysis Institute of Management (9)

Market intelligence kantar fr
Market intelligence kantar frMarket intelligence kantar fr
Market intelligence kantar fr
 
CCI Consumer Confidence Survey Mars Avril 2017
CCI Consumer Confidence Survey Mars Avril 2017CCI Consumer Confidence Survey Mars Avril 2017
CCI Consumer Confidence Survey Mars Avril 2017
 
Newsletter #8 club afrique - iae- paris alumni vf
Newsletter #8   club afrique - iae-  paris alumni vfNewsletter #8   club afrique - iae-  paris alumni vf
Newsletter #8 club afrique - iae- paris alumni vf
 
Decoding the Kenyan consumer
Decoding the Kenyan consumerDecoding the Kenyan consumer
Decoding the Kenyan consumer
 
Kantar tns mauritiantop brands 2017
Kantar tns mauritiantop brands 2017Kantar tns mauritiantop brands 2017
Kantar tns mauritiantop brands 2017
 
Brochure mbaip 2017
Brochure mbaip 2017 Brochure mbaip 2017
Brochure mbaip 2017
 
Conference Kenya 27 march 2017
Conference Kenya 27 march 2017Conference Kenya 27 march 2017
Conference Kenya 27 march 2017
 
Calendrier des cours de AIM
Calendrier des cours de AIMCalendrier des cours de AIM
Calendrier des cours de AIM
 
Focus RETAIL 2016
Focus RETAIL 2016 Focus RETAIL 2016
Focus RETAIL 2016
 

Infographie Indice de confiance du consommateur mauricien - 3eme trimestre 2016

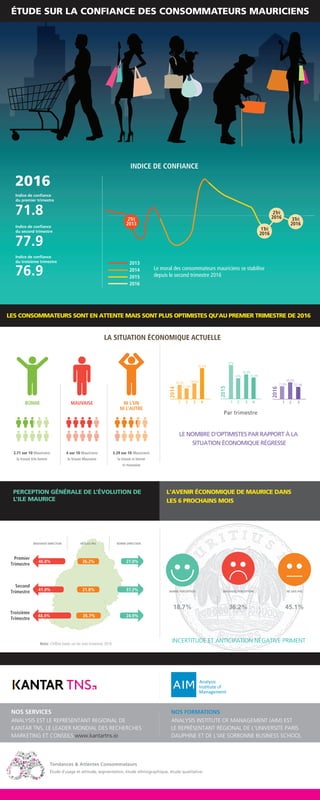
  • 1. NOS SERVICES ANALYSIS EST LE REPRÉSENTANT REGIONAL DE KANTAR TNS, LE LEADER MONDIAL DES RECHERCHES MARKETING ET CONSEILS www.kantartns.io NOS FORMATIONS ANALYSIS INSTITUTE OF MANAGEMENT (AIM) EST LE REPRÉSENTANT RÉGIONAL DE L'UNIVERSITÉ PARIS DAUPHINE ET DE L'IAE SORBONNE BUSINESS SCHOOL ÉTUDE SUR LA CONFIANCE DES CONSOMMATEURS MAURICIENS LES CONSOMMATEURS SONT EN ATTENTE MAIS SONT PLUS OPTIMISTES QU’AU PREMIER TRIMESTRE DE 2016 3Tri 2016 INDICE DE CONFIANCE Le moral des consommateurs mauriciens se stabilise depuis le second trimestre 2016 71.8 77.9 76.9 2013 2014 2015 2016 LA SITUATION ÉCONOMIQUE ACTUELLE BONNE MAUVAISE NI L’UN NI L’AUTRE 2.71 sur 10 Mauriciens la trouve très bonne 4 sur 10 Mauriciens la trouve Mauvaise 3.29 sur 10 Mauriciens la trouve ni bonne ni mauvaise 2016 2015 2014 57% 27.9% 27.1% 34.2% 47% 50.9% 47.6% 21.3% 28.1% 28.6% 50.5% Par trimestre 1 2 31 2 3 41 2 3 4 2016 Premier Trimestre Second Trimestre Troisième Trimestre NE SAIS PAS 26.2% 26.7% BONNE DIRECTION 27.0% 24.9% MAUVAISE DIRECTION 46.8% 21.8% 37.2%41.0% 48.4% Note: Chiffres basés sur les trois trimestres 2016 PERCEPTION GÉNÉRALE DE L’ÉVOLUTION DE L’ILE MAURICE L’AVENIR ÉCONOMIQUE DE MAURICE DANS LES 6 PROCHAINS MOIS BONNE PERCEPTION 18.7% MAUVAISE PERCEPTION 36.2% NE SAIS PAS 45.1% Indice de confiance du premier trimestre Indice de confiance du second trimestre Indice de confiance du troisième trimestre 2Tri 2016 1Tri 2016 2Tri 2013 Tendances & Attentes Consommateurs Étude d’usage et attitude, segmentation, étude ethnographique, étude qualitative. LE NOMBRE D’OPTIMISTES PAR RAPPORT À LA SITUATION ÉCONOMIQUE RÉGRESSE INCERTITUDE ET ANTICIPATION NÉGATIVE PRIMENT