SlideShare a Scribd company logo
1 of 40
Download to read offline
DOCUMENT RESUME
ED 422 371 TM 028 931
AUTHOR Plake, Barbara S.; Hambleton, Ronald K.
TITLE A Standard Setting Method Designed for Complex Performance
Assessments with Multiple Performance Categories:
Categorical Assignments of Student Work.
SPONS AGENCY National Science Foundation, Arlington, VA.
PUB DATE 1998-04-00
NOTE 39p.
CONTRACT NSF-955480
PUB TYPE Reports Evaluative (142) Speeches/Meeting Papers (150)
EDRS PRICE MF01/PCO2 Plus Postage.
DESCRIPTORS *Classification; *Data Analysis; Grade 8; Junior High School
Students; Junior High Schools; *Performance Based
Assessment; Standards; Tables (Data); *Teachers
IDENTIFIERS *Analytical Methods; Georgia; Michigan; National Assessment
of Educational Progress; Panel Reviews; *Standard Setting
ABSTRACT
This paper reports on a standard-setting method designed for
complex performance assessments with multiple performance categories. The
method studied, the Analytical Judgment Method, involves panelists' making
analytical classification decisions for each of the test's components
individually. It also allows for discussion and reconsideration of panelists'
initial classification decisions before moving on to the next test component.
The method was used in two sites, Georgia and Michigan, on two different
occasions using the 1996 eighth grade National Assessment of Educational
Progress Science Assessment. The Georgia administration focused on the
comparability of results from the Analytical Judgment Method when two
different classification strategies, a sorting strategy and a direct
classification strategy, were used. In Michigan, 2 versions of the rating
scale were used, 1 with 12 classification categories and 1 with 7. Different
performance descriptors were used in the two states. Sixteen teacher
panelists in Georgia divided into 2 panels evaluated 50 papers per panel. In
Michigan, 2 groups of 4 panelists each evaluated 50 papers. Results did not
vary much as a function of the analytic strategy or whether a long or short
classification scale was used. Discussion by panelists affected the results
only when a seven-point scale was used, and the result was higher performance
standards after discussion. The sorting method resulted in lower performance
standards for Basic and Proficient levels, but not for Advanced. Results
suggest that the decision regarding the method of analyzing the data and the
choice of classification scale may be made as a matter of convenience or
personal preference. (Contains nine tables, one figure, and nine references.)
(SLD)
********************************************************************************
* Reproductions supplied by EDRS are the best that can be made *
* from the original document. *
********************************************************************************
A.
A Standard SettingMethod Designed for Complex
Performance Assessments with Multiple Performance Categories:
Categorical Assignments of Student Work
U.S. DEPARTMENT OF EDUCATION
Office of Educational ResearCh and tmptevernent
EDUC TIONAL RESOURCES INFORMATION
CENTER (ERIC)
This document has been reproduced as
received from the person or organization
originating it.
Minor changes have been made to
improve reproduction quality.
Points of view or op.mions stated in this
Ronald K. Hambleton
'University of Massachusetts at Amherst
document do not necessarily represent
official OERI position or policy.
Barbara S. Plake
University of Nebraska-Lincoln
PERMISSION TO REPRODUCE AND
DISSEMINATE THIS MATERIAL HAS
BEEN GRANTED BY
2).c3ti.xc, PI Ake_
TO THE EDUCATIONAL
RESOURCES
INFORMATION CENTER (ERIC)
1
Running Head: Categorical Assignments
This material is based on work supported by theNational Science Foundation
Grant No. 955480. Any opinions, findings, and conclusions or recommendations
expressed in this material are those of the authors and do not necessarilyreflect
the views of the National Science Foundation.
Paper presented at the annual meeting of the American Educational Research
CO
Cs1 Association, San Diego, April, 1998.
a
2
2
Categorical Assignments Page 3
A Standard Setting Method Designed for Complex
Performance Assessments with Multiple Performance Categories:
Categorical Assignments of Student Work
Most judgmental standard setting methods (e.g., Angoff, 1971; Livingston
and Zieky, 1982) were designedfor use with multiple-choice assessments and are
most frequently used with assessments that use only one performance standard
in score reporting (e.g., pass/fail; master/non-master). Attempts to generalize
these methods to non-dichotomously scored assessments have been met with
mixed results (Hambleton & Plake, 1995). Further, generalizations of the Angoff
method to assessments with multiple performance standards have been criticized
(Shepard, 1995; NAE, 1995; Flake, 1996).
In 1995, our research project was funded by the National Science
Foundation to investigate new standard setting methods with applications to
state assessment programs, many of which contain performance type
assessments and produce results based on multiple performance standards (e.g.,
Basic, Proficient, and Advanced). One new method, and the one described in this
paper, is a judgmental procedure that focuses panelists on actual student work.
The panelists' task is to classify student papers into one of several performance
categories defined to capture levelsof performance as expressed by the multiple
performance categories.
Two general approaches have been investigated in this research project:
an analytical and a holistic approach. In the analytic approach, each of the
components that comprise the assessment are considered independently by the
panelists. These could be naturally occurring sections of the assessment or some
Categorical Assignments Page 4
other decomposition of the test into meaningful subparts (such as all common
content or common format).
Regardless of how these components are formulated, for each of these
sections or component parts, the panelists review each of several student papers,
sampled to present the full score continuum, and are asked to make categorical
assignments regarding the performance levels represented by the quality of the
student's work. These decisions are made for each component or part of the
assessment separately; once the panel has Completed their classification process
for the first component of the test, they consider the set of student papers for the
second component. Student ppers are not presented in the same order across
the components. The panelists do not know the author identification of the
student's work, so the panelists are not able to make a total judgment about the
overall work of an individual student; rather the panelists classify the papers for
the students independently for each of the test components.
By contrast, with the holistic method, panelists are shown an entire test
booklet for a student (Jaeger & Mills, 1998). The panelists may make multiple,
sequential classification decisions for a single student before moving on to the
next student's work. For each student's paper, the panelist may be asked to first
classify each of the individual components on the performance continuum, and
subsequently to make an overall classification judgment about the student with
regard to the students' overall performance classification.
Therefore, one feature that distinguishes the analytical method from the
holistic method is the amount of information the panelists process at any one
time. With the analytic method, panelists focus on one test component at a time
and make their classification decisions with respect to the performance
continuum relative to that test component only. For the holistic method, the
panelists consider all test components simultaneously. Further, with the holistic
4
Categorical Assignments Page 5
method, panelists see an entire student's performance and make an overall
judgment. A panelist in the analytical method, by design, does not consider the
overall performance of the students but rather considers the student's
performance as an exclusive function of the component parts.
The first application of these methods was based in a large northeastern
state using its state assessment with middle school mathematics. This state's
middle school mathematics assessment is comprised of multiple components,
some of which are performance based while others are multiple-choice. The
results from the standard setting study indicted high comparability across the
analytic and holistic approaches with the performance tasks but produced fairly
large discrepancies when used with multiple-choice questions. This was in part
an artifact of the implementation of the analytical approach with the multiple
choice test. Further, and most importantly, the performance assessment tasks,
while open ended, were fairly limited in their scope and performance
expectations (See Mills, Plake, Jaeger, & Hambleton, 1997).
The purpose of the current study was to apply these methods with an
assessment program that involved fewer multiple-choice questions and that had
varying degrees of complexity in the performance assessments. Toward that
end, the 1996 eighth grade NAEP Science Assessment was identified as the
assessment program for consideration. Moreover, further refinements of the
holistic and analytic methods were compared. The purpose this paper is to
report on one of these approaches: the Analytical Judgment Method. Much as
described earlier with the recent study in the northeastern state, this approach
involved panelists making analytical classification decisions for each of the test's
components individually and allowed for discussion and reconsideration of
panelists' initial classification decisions prior to moving on to the next test
component.
5
Categorical Assignments Page 6
The Analytic Judgment Method was used in two sites at two different
occasions using the 1996 eighth grade NAEP Science Assessment, Georgia and
Michigan. The Georgia administration focused on the comparability of results
from the Analytical Judgment Method when two different classification
strategies were used: a sorting strategy and a direct classification strategy. For
the Michigan administration, two versions of the rating scale were used, one with
12 classification categories and one with 7 categories. One goal of theMichigan
study was to investigate the degree of comparability of results across these two
classification scales, including the amount of time required by panelists to
complete the classification tasks using the 12 and 7 point scales. In addition, two
different sets of performance descriptors were employed: one set was based on
the NAEP Science Frameworks (Georgia) and another set was based on a
translation of these Science Frameworks to reflect the actual questions in the
NAEP booklet selected for use with this standard setting project (Michigan).
Method
Instrument. One booklet consisting of three sections or blocks of test items
from the 1996 eighth grade NAEP Science Assessment (Booklet 226F) was
selected for this study. Sections 1 and 2 contain several multiple-choice and short
answer questions while Section 3 presents many open-ended questions based on
a hands-on experiment. There are 22 points available in Section 1; 22 in Section 2
and 18 in Section 3. Therefore, student scores for the booklet could range from a
low of 0 to a high of 64.
Performance Descriptors. Performance on NAEP assessments are
currently reported on a performance scale with three performance standards
(Basic, Proficient, and Advanced), resulting in four possible achievement
categories: Below Basic, Basic, Proficient, and Advanced.
Categorical Assignments Page 7
Performance descriptors varied across administration site. For the
Georgia administration, the performance descriptorspublished by NAEP to
conform with the eighth grade NAEP Science Frameworks were used. In a
companion study, a panel of secondary science teachers who were familiar with
the assessment and the NAEP Science Frameworks, developed a set of
performance descriptors that were aligned with the specific content on the test
booklet used in the Georgia and Michigan studies. See Mills and Jaeger (1998)
for more details on this process. These test-aligned performance descriptors
were used in the Michigan standard setting study.
Georgia Study
Panelists. Secondary science teachers or administrators from a large
southeastern city were recruited for participation in this study. A total of 16
teachers participated in this study, subdivided into two groups, A and B, in such
a way that they were nearly equal in years of teaching secondary science or other
relevant educational experience.
Classification Strategies. Two strategies for making classification
decisions based on student work were considered. Group A performed the sort
task and Group B used a direct classification approach. To aid in the
classification of student work into the achievement categories, 12 ordered
categories were created as follows:
7
cr Performance Categories
Below Basic Low:
Below Basic Medium:
Below Basic High:
Basic Low:
Basic Medium:
Basic High:
Proficient Low:
Categorical Assignments Page 8
Performance Description
Far Below Basic
Clearly Below Basic
Just Below Basic
Just Barely Basic
Clearly Basic
Almost Proficient
Just Barely Proficient
Proficient Medium: Clearly Proficient
Proficient High:
Advanced Low:
Advanced Medium:
Advanced High:
Almost Advanced
Just Barely Advanced
Clearly Advanced
Highly Advanced
For the sort strategy (Group A), panelists were instructed to first sort the
nt papers into one of the four major categories (Below Basic, Basic,
lent, Advanced). Subsequent to this initial categorical assignment,
ists were to focus only on those papers assigned to one of the major
Dries (say Below Basic) and separate these papers into finer categories, such
tow Basic Low, Below Basic Medium, and Below Basic High. The
lation was that this strategy would minimize within category differences, in
melists perception, of the papers belonging to any one category, and
ise maximize the distinction, in the panelists' perception, of the papers
Jrized in different categories.
The direct classification strategy instructed panelists to make a single
fication decision for a student's paper into one of the 12 categories. The
BEST COPY AVAILABLE
:e 9
?.d
I. a
Categorical Assignments Page 10
this only occurred for Section 1 when both subpanels within the conditions
evaluated the same 50 student papers.
Procedures. The teachers met in a large southeastern city for two days as
part of the larger comprehensive comparative study. During the first day,
panelists were kept together in one large group. The panelists were trained in
the assessment design and scoring rubrics. They engaged in a discussion of the
performance descriptors for the categories used by NAEP: Below Basic, Basic,
Proficient, and Advanced. The panelists were given a chart that translated these
performance categories using the descriptors provided NAEP eighth grade
NAEP Science Frameworks. The purpose of the ensuing discussion was to
articulate performance expectations for Below Basic, Basic, Proficient, and
Advanced levels of performance in terms of the 1996 eighth grade NAEP Science
Assessment.
At the conclusion of this discussion, the panelists were assigned to their
respective groups. The 8 panelists assigned to the direct classification method
and 9 were assigned to the sort classification approach. Each group was
convened in a small room and trained to use their specific classification strategy.
Each of these panels were further subdivided into two subpanels (Al, A2. B1,
B2)1.
Panelists were given several forms to aid in recording their classification
decisions, including a coding form that provided a precoded listing of the
paper's identification number and two columns, one for their initial classification
decision and one to use to record their reconsidered value following their panel's
discussion.
Panelists then convened in their small groups; both panels began by
considering the 50 papers assigned to their subpanel for Section 1. Following
their conclusion of initial ratings, subpanel discussion, and final classification
9
Categorical Assignments Page 11
ratings, subpanels Al and B1 worked with the 50 students papers from Section 2
and subpanels A2 and B2 made classification decisions for the 50 papers from
Section 3. It was originally planned that all subpanels would rate papers from all
three sections. However due to lack of time, it was decided to allocate the
Section 2 papers to one of the subpanels and the Section 3 papers to the other.
This was done so that an estimate of performance standards could be determined
for each of the three sections therefore allowing for total standards for the full
booklet to be determined. However, this decision sacrificed some of the
comparative information that would have been gained by running parallel
subpanels for all three sections. Also the comparability of common papers was
only possible, using this design, for the 10 common papers across the subpanels
for Section 1.
Michigan
Instrument. This study used the same eighth grade NAEP science
assessment booklet that was used in the Georgia study.
Panelists. A total of 8 panelists participated in the study, divided in two
groups of 4 each, making the groups as equal as possible of years of teaching
science and science subject/grades taught.
Student papers. For this administration, a total of 50 papers were selected
to be used by both subgroups.
Classification scale: Group A used the same classification scale that was
used in the Georgia administration. Group B used an abbreviated 7-point
version of that scale, as follows:
1 0
Rating Performance Category
1 Below Basic
2 Borderline Basic
3 Basic
4 Borderline Proficient
5 Proficient
6 Borderline Advanced
7 Advanced
Categorical Assignments Page 12
Performance Description
Clearly Below Basic
Between Below Basic and Basic
Clearly Basic
Between Basic and Proficient
Clearly Proficient
Between Proficient & Advanced
Clearly Advanced
Performance descriptors. Performance descriptors that were developed
for application with this specific test booklet were used in the Michigan study.
Procedure. The procedures used in Michigan mirrored those used in the
Georgia study.
Results
The design of the study afforded the opportunity to consider four research
questions:
1. How are the performance standards affected by the choice of
analytic strategy?
2. Are the classification decisions affected by the classification
strategy (sorting versus direct classification)?
3. Do the performance standards differ as a function of number of
classification categories (7 vs. 12)?
4. Are performance standards affected by panel discussion?
These research questions will be addressed sequentially, using data from either
the Georgia or Michigan study (or both).
1 1
Categorical Assignments Page 13
How are the performance standards affected by the choice of analytic strategy?
With the Boundary Paper Method, scores for papers that were assigned to the
"boundary categories" were used in deriving a performance standard. With the
7-point rating scale, for example, the scores of papers assigned a performance
classification of "2" (Borderline Basic) by the panelists were averaged to obtain
an estimate of the Basic performance standard. The process was repeated for
scores assigned performance classifications of "4" (Borderline Proficient) and "6"
(Borderline Advanced) to obtain estimates of the Proficient and Advanced
performance standards.
With the 2-point rating scale, the papers classified by panelists as "3" and
"4" (Below Basic High and Basic Low) were considered "Borderline Basic" and
the scores of these papers were averaged to obtain an estimate of the Basic
performance standard. The process was repeated to obtain Proficient and
Advanced performance standards using papers classified as "6" and "7" and "9"
and "10", respectively.
Also, a non-linear regression line (cubic polynomial) was obtained to
describe the relationship between paper scores and panelists' paper
classifications. With the regression line, the expected scores of borderline Basic,
Proficient, and Advanced can be obtained and used as the performance
standards.
Prior to fitting the regression lines, minor adjustments were made to the
values assigned to the performance categories to approximate an equal-interval
scale. These revised performance category values are as follows:
12
Categorical Assignments Page 14
Performance Category Revised Value
Below Basic Low: 0.5
Below Basic Medium: 2.0
Below Basic High: 3.5
Basic Low: 4.5
Basic Medium: 6.0
Basic High: 7.5
Proficient Low: 8.5
Proficient Medium: 10.0
Proficient High: 11.5
Advanced Low: 12.5
Advanced Medium: 14.0
Advanced High: 15.5
No adjustments were made to the scale values for the performance
categories for the 7-point scale. Cubic polynomial regression models were fit to
these data to predict scores by students whose papers were assigned to these
categorical designations. For the 12 point scale, for example, predicted scores for
the scale points of Basic (X = 4), Proficient (X=8), and Advanced (X=12) were
used with these regression models to ascertain the performance standards for
Section 1, 2, and 3 using the regression approach. Figure 1 provides an
illustration of the cubic polynomial approach using the data from Section I. Then
the section performance categories were summed to arrive at the total booklet
performance standards.
These two analytic strategies have different strengths and weaknesses.
The Boundary Paper method has the strengths that it focuses exclusivelyon the
scores of student papers that have been assigned to the most relevant categories
13
Categorical Assignments Page 15
on the classification scale. Only student papers that the panelists feel are
"borderline" are used in calculating performance standards. In addition, this
approach is fairly straightforward, being both easy to calculate (simple averages
are all that is needed) and to explain to policy makers and the public. The
polynomial model fitting approach has appeal in that is uses all the available
data, not sacrificing information that is present in the paper classification
decisions for non-boundary categories. Further, especially when there are few
papers assigned to relevant categories, it provides an approach that yields
performance standards with less random error. However, the sophistication of
the method most likely requires access to complex statistical software and a level
of statistical training that might challenge some practitioners. It is definitely
more difficult to explain cubic polynomial curve fitting to policy makers, parents,
print media representatives, and the public than would be simple averages.
Also, this procedure requires choices to be made in fitting mathematical
expressions to the data. In this application, for example, based on visual
inspection of the scatterplot of the relationship between panelists' classification
decisions and student paper scores, a cubic polynomial model was adopted
throughout. However, another strategy could be to fit increasingly higher level
polynomials to the data from the sections comprising the assessment, choosing
the one that shows the best fit to the data. This might mean endorsing a linear fit
for data from one section, a quadratic for another, and a cubic fit for yet another
section. Researchers might make different choices and hence arrive at different
performance standards..
Data from the Georgia and Michigan studieswere used to address this
question. The results of this comparison between the Boundary Paper Method
and the Cubic Regression approach are presented in Table 1. For the Georgia
study, Group A (sort student papers) and Group B (classify student papers) show
14
Categorical Assignments Page 16
minimal differences in final performance standards for Basic, Proficient, and
Advanced performance standards regardless of whether the data were analyzed
using the Boundary Paper Method or using cubic polynomials. For Group A, the
Boundary Paper Method resulting in performance standards of 20.85, 36.29, and
45.72 using the Boundary Paper approach and 20.58, 35.44, and 45.66 using the
cubic polynomial method. For Group B, performance standards for Basic,
Proficient, and Advanced were 27.54, 41.99, and 46.66 using the Boundary Paper
Method and 27.72, 43.22, and 45.62 with the cubic polynomial approach.
Similar results occurred with the data from the Michigan study. Group
A's (12-point classification scale) Total performance standards for Basic,
Proficient, and Advanced are as follows: 26.58, 42.14, 51.33. For Group B (7-
point scale) these results are 26.95, 42.57, and 51.44 for Basic, Proficient, and
Advanced, respectively. When using the model fitting approach, the
performance standards for Group A were 26.20, 42.16, and 51.38 for Basic,
Proficient, and Advanced. For Group B comparable results were 27.46, 42.74,
and 51.39
As can be seen readily by comparison of the Boundary Paper results and
the cubic polynomial regression analyses, there is very little difference in the final
total performance standards regardless of which analytic method is used.
Therefore the decision about whether to use the Boundary Paper approach or
cubic polynomial models becomes one of convenience, sophistication, and degree
of comfort with the underlying principles supporting each method. There may
have been features of the study that minimized the differences observed between
these two analytic strategies. Additional research is needed in comparing results
using these two analytic approaches before a firmer conclusion about the
comparability of results from these two approaches can be made. For example,
15
Categorical Assignments Page 17
with a modest number of papers around two boundary categories, will the
regression approach outperform the boundary paper method?
Are classification decisions affected by the classification strategy (sorting
versus direct classification)?
Data to address this question was collected in the Georgia study. The two
groups classified a total of 50 student papers, 10 of which were common across
groups. The analysis will focus on the overall performance standards derived
from the sort and the classify strategies and also on the ratings provided by the
two groups on the common papers.
Across the 12 classification categories, papers assigned by panelists in
Group A showed a very strong trend as expected for higher scored papers to be
classified into higher level categories. These results are summarized in Table 2.
Boundary performance standards for the three sections were calculated to be
20.85 for Basic, 36.29 for Proficient, and 45.72 for Advanced. Nearly identical
results were found using the polynomial model analytic method.
Table 3 shows the assignments by panelists in Group B of the 50 papers to
the 12 performance categories and the average of the scores of the student papers
that were assigned to those categories. Again, there is a very strong trend shown
for papers that were classified into higher performance categories to have earned
higher scores. At the same time, very few papers were assigned by these
panelists into the highest performance categories. PerforMance standards,
calculated using the Boundary Paper method, for Basic, Proficient, and
Advanced performance categories are as follows: 27.18, 41.47, and 46.62,
respectively. Nearly equivalent results were obtained from the model fitting
approach.
16
Categorical Assignments Page 18
There appears to be a meaningful difference in the performance standards
for Basic and Proficient depending on whether the sort or direct classification
approach is used. In both cases, the classification approach resulted in
substantially higher performance standards, and therefore more rigorous
standards, for Basic and Proficient. Hardly any difference in performance
standards were found for the Advanced performance category. These differences
were present whether the analysis was completed using the Boundary Paper or
model fitting approaches. It is interesting to note, however, that these
differences appears to be smaller when looking at the results only for Section 1.
Student papers from Section 1 were evaluated by 16 panelists, unlike the papers
from Sections 2 or 3. These differences therefore may be due to the instability of
results from using such small panel sizes for Sections 2 and 3. A comparison of
performance standards across the two classification strategies is shown in Table
42.
Common papers
Panelists in Groups A and B each classified a total of 50 student papers, 10
of which were common across groups. One way to investigate the impact of the
two classification strategies is to consider the classification decisions for these 10
papers across the two groups. These results are presented in Table 5. Altogether,
9 panelists in Group A and 8 panelists in Group B classified the same 10 papers.
One panelists in Group B (panelists B6) appears to be an outlier, in that this
panelist's classification decisions were often 1 standard deviation about the
group's mean (and frequently as large as 2 standard deviations from the group's
mean) on these common papers. This panelist's data was eliminated for the
common group comparison. When panelist B22's data is discarded, the results
from Group A and B across the common papers shows no discernible pattern.
17
Categorical Assignments Page 19
Neither is one group's average classification, or the variability of their
classification decisions, systematically larger or smaller across the 10 common
papers. It is interesting to note that the classification decisions appear to align
with actual paper scores as lower scoring papers were routinely classified by
both groups in lower categories than were higher scored papers.
Evaluation
Panelists filled out an evaluation form that gathered their perception of
the quality and adequacy of the training and preliminary activities in addition to
their comfort and confidence in the standards derived from their classification
ratings. Open ended questions solicited responses to questions about their
classification strategies and special problems or concerns.
Regardless of Group, all of the procedural components of the standard
setting workshop (Orientation, Training, adequacy of the definitions of the
performance categories) received ratings of "Successful" or "Adequate". When
asked their level of confidence in the standard determined by the sorting
method, 5 of the 8 of the panelists in Group A indicated high or very high levels
of confidence for the Advanced and Proficient performance standards and 6 out
of 8 indicated high or very high confidence for the Basic performance standard.
Overall, the confidence of panelists in Group A that their method would produce
a suitable set of standards for the performance level was indicated as mostly very
confident or confident (6 of the 8 panelists). When posed these same questions, 3
out of the 7 panelists in Group B indicated high or very high levels of confidence
for the Advanced performance standard, 6 of the 7 panelists rated their
confidence in the Proficient performance standard as high or very high for the
Proficient and Basic performance standards. Only 2 of the panelists expressed
Confidence or High Confidence that the method would produce a suitable set of
18
Categorical Assignments Page 20
standards for the performance levels. Therefore, based on panelists' perceptions
alone, the panelists in Group A showed higher levels of confidence and
endorsement in the results from the sorting approach than did the panelists in
Group B who used the direct classification procedure for classifying the student
papers.
Do the performance standards differ as a function of number of classification
categories (7 vs. 12)?
Data from the Michigan study could be used to answer this question. As
stated in the Methods section, panelists were divided into 2 groups of 4 panelists
each. Group A used the same 12-point categorization system as was employed in
the Georgia study while Group B used a 7-point version. The panelists
considered the same 50 student papers, making classification decisions on the
student papers for each of the 3 sections sequentially.
Performance standards were derived using the Round 2 results both the
boundary paper method and by the fit of a cubic regression to the data points.
For each group, a total of 12 performance standards were calculated: Section 1,
Section 2, Section 3, and Total for Basic, Proficient, and Advanced. The results
are summarized in Table 6. Based on the boundary paper method (but
comparable results were found also with the model fitting approach), Group A's
(which used the 12-point classification scale) Total performance standards for
Basic, Proficient, and Advanced are as follows: 26.58, 42.14, 51.33. For Group B
(using the 7-point scale) these results are 26.95, 42.57, and 51.44 for Basic,
Proficient, and Advanced, respectively. Clearly, the performance standards
differed very little as a function of number of classification points on the rating
scale. Had these results been rounded to the nearest integer, the performance
19
Categorical Assignments Page 21
standard for Basic would have been 27 using both rating scales, 42 for Proficient
using the 12 point scale and 43 using the 7 point scale, and 51 for Advanced by
both.
Both groups were administered an evaluation at the end of their
classification tasks. Both groups reported being satisfied with the Orientation
and Training aspects of the study. When asked if they had sufficient time to
complete their Round 1 ratings, panelists in Group A, on average, felt there was
less than adequate time whereas panelists in Group B reported the time was
adequate for them to complete their ratings comfortably. Panelists were also
asked to rate their level of confidence that the methods they used would results
in appropriate performance standards. Again, Group A's results were slightly
less positive than those of Group B (an average in Group A of 2.75 compared to
an average of 3.0 on a 4 point scale).
It took the group using the 12 point scale about an hour longer to
complete their classification decisions for the three sections than it took the
panelists using the 7-point scale. Using the 7 point scale, therefore, appears to be
easier for the panelists to use in that it resulted in fewer papers to discuss and
less time for the panelists to complete their classification decisions. The savings
of an hour from the standard setting process could be important when budgeting
for a standard setting workshop. Further, the savings wouldmost likely be even
greater if the assessment consisted of many sections, rather than merelythree as
was the case with the eighth grade NAEP science assessment used in this study.
Also, there is the possibility of continuing with the same time frame and
increasing the number of papers classified by panelists. The effect of having
more papers classified would be to increase the stability of the resulting
performance standards.
2 0
Categorical Assignments Page 22
Are performance standards affected by panel discussion?
Data from the Michigan study will be used to answer this question.
Although the panelists were divided into 2 groups and these groups used
different rating scales (that differed in the number of scale points, 7 and 12), both
groups used discussion between their first and second ratings. Therefore, data
from both groups can be used to address the question about the effect of
discussion on the performance standards.
Results from Groups A and B for Sections 1, 2, and 3, for Rounds 1 and 2
are presented in Table 7. Performance standards were derived for each group
using their Round 1 data and their Round 2 data. These performance standards
were set for each of the Sections separately and sequentially and then aggregated
to yield the total performance standards for Basic, Proficient, and Advanced.
These performance standards are reported for the boundary paper method only
as the results are consistent when fitting a cubic polynomial to the data.
When looking only at the Round 1 results from Group A (12 point rating
scale), on the total scale, the performance standards for Basic, Proficient, and
Advanced were calculated using the Boundary Paper method as follows: 26.78,
41.09, and 51.11 for Basic, Proficient, and Advanced performance standards.
After discussion, these performance standards were 26.58, 42.14, and 51.33. For
Group B (7 point rating scale), performance standards after Round 1 for Basic,
Proficient, and Advanced were 28.13, 39.73, and 47.94 as compared to 26.95,
42.57, and 51.44 after discussion. Therefore, even though there did not appear to
be a meaningful difference in the final performance standards for Basic,
Proficient, and Advanced for Group A as a results of discussion, the performance
standards that resulted from Group B changed a minimum of 2 score points as a
21
Categorical Assignments Page 23
result of the discussion. In two instances, these performance standards increased
from before to after discussion in Group B.
Tables 8 and 9 provide a more in-depth look at the effect of discussion
across these two groups by reporting the performance standards and standard
deviations before and after discussion by section of the test. As expected the
standard deviations are systematically lower (in 17 of the 18 comparisons) after
discussion, but not markedly so. The magnitude of the reduction is almost
always less the one scale point, regardless of whether the scale had 12 or 7
values. In looking at the individual panelists' changes in paper classifications
before and after discussion, for-Group A (12-point scale) panelists maintained
their round 1 assignment after discussion over 75% of the time; and made nearly
the same percentage of higher as lower changes in paper classification. For
Group B (7-point scale), the percentage of change were 20% to higher
classifications, 12% to lower, and 68% no change.
Therefore, these results indicate that the performance standards are
affected by group discussion. Although, using Group A's results, it appears that
little substantive differences were obtained through the discussion, the results
from Group B showed a change in performance standards subsequentto
discussion. Also of note is the fact that, for bothgroups, discussion resulted in
consistently less variability in panelists' classification decisions and resultant
performance standards. Reduced variability (and therefore increased stability)
that resulted from group discussion is highly desirable. Therefore from the
perspective of improved precision, discussion had a desirable impact on the
stability of the final performance standards. We do not know if panelists'
confidence in the performance standards were affected by discussion as we did
not gather their confidence levels prior to discussion. However, in the open
22
Categorical Assignments Page 24
ended comments provided by the panelists, several specifically mentioned the
discussion as an important feature of the standard setting process.
Discussion
The purpose of this study was to investigate several aspects of the
Analytic Judgment Method. Over two occasions in two different states, panelists
used this method to establish performance standards for Basic, Proficient, and
Advanced levels of performance on the 1996 eighth grade NAEP Science
Assessment. These data allowed for an investigation of a) the comparability of
the results across two analytical approaches (Boundary Paper and cubic
polynomial regression), b) the effects of two different classification strategies
(sorting and direct classification), c) the effects of a shortened classification
system (12-point vs. 7-point), and d) the effects of discussion between rounds.
All of these analyses were designed to provide information for further
refinements of the Analytic Judgment Method.
The results from the Analytdc Judgment Method did not vary much as a
function of analytic strategy or whether a long or short classification scale was
used. Discussion appeared to effect the results only when the 7-point scale was
used and the effect was to obtain higher performance standards following
discussion. The sorting method resulted in lower performance standards for
Basic and Proficient levels, but not for Advanced. However, the new
performance descriptors, coupled with a change in location, resulted in higher
performance standards at the Advanced level only.
Therefore, it appears that the decision regarding the method for analyzing
the data and the choice of classification scale may be made as a matter of
convenience or personal preference, rather than based on any empirical evidence
supporting one choice over another.
23
Categorical Assignments Page 25
Discussion appeared to have the desired effect of reducing variability in
panelists' paper classification decisions, although we do not have direct evidence
on whether their confidence in the final performance standards were necessarily
increased due to discussion. The evidence on the effect of discussion on the
magnitude of the final performance standards is mixed: in one case the
performance standards were basically unchanged after discussion whereas there
was a shift in performance standards (primarily toward higher standards for the
Proficient and Advanced levels) in the other. Some have argued that the demand
characteristics of setting "high and rigorous standards" may impel some
panelists be more inclined, particularly in group settings, to promote higher
levels of achievement for performance standards than they may have set
individually. Group discussion may amplify these tendencies. This is an area
where additional research would be particularly useful.
There was some evidence of lower performance standards at the lower
performance levels from using the sorting method. The task presented some
administrative challenges for the panelists that made its continued use not
desirable. When the panelists used the 12-point scale for the sorting task, the
sheer volume of papers to sort, and the space requirements for being able to form
and manipulate a total of 12 piles of papers for each panelists became fairly
unworkable. It is yet to be seen whether this strategy would be more reasonable
to achieve with the 7-point scale. Likewise, a variation on the sort strategy,
using smaller numbers of papers to be considered at any time in the process,
might yield a more feasible strategy. The ability for panelists to reconsider their
classification decisions, to achieve more homogeneous paper classification
decisions with category has appeal. Perhaps this individual reconsideration of
classification decisions could replace discussion or enhance the utility of
24
Categorical Assignments Page 26
discussion between rounds. More research is needed to investigate these
possibilities.
The results of the analyses need to be considered with caution as the
sample sizes upon which they are based are small. Some of the differences noted
may not be the results of the variables studied but instead the result of random
error due to small sample sizes. Hopefully additional research will be conducted
using more traditional sized panels for standard setting purposes (15 - 20). If that
were the case, more confidence could be placed in the results. Also, replications
showing similar results, even with small panels, would add credence to the
results reported here.
25
Categorical Assignments Page 27
References
Angoff, W. H. (1971). Scales, norms, and equivalent scores. In R.L.
Thorndike (Ed.), Educational measurement (2nd ed.). Washington, DC:
American Council on Education.
Hambleton, R.K., & Plake, B.S. (1995). Using an extended Angoff
procedure to set standards on complex performance assessments. Applied
Measurement in Education, 8(1), 41-55.
Jaeger, R.M. & Mills, C.N. (1998, April). A performance-grounded
procedure for setting performance standards on complex large-scale assessments.
Paper presented at the annual meeting of the American Educational Research
Association, San Diego.
Livingston, S.A., & Zieky, M. J. (1982). Passing scores: A manual for
setting standards for performance on educational and occupational tests.
Princeton, NJ: Educational Testing Service.
Mills, C.N., & Jaeger, R.M. (1998). Creating descriptions of desired
student achievement when setting performance standards. In L. Hansche (Ed.),
Handbook of standard setting. Washington, DC: Council of Chief State School
Officers.
Mills, C.N., Plake, B.S., Jaeger, R.M., & Hambleton, R.K. (1997, April).
Comparison of two new standard setting approaches: Lessons learned. Paper
presented at the meeting of AERA, Chicago.
National Academy of Education. (1993). Setting performance standards
for student achievement. Stanford, CA: Author.
2 6
Categorical Assignments Page 28
Plake, B.S. (1996, December). Setting performance standards for
professional licensure and certification. Commissioned paper presented at the
National Academy of Sciences Invitational Conference on Standard Setting and
NAEP, Washington, DC.
Shepard, L.A. (1995, October). Implications for standard setting of the
NAE evaluation of NAEP. Paper presented at the Joint Conference on Standard
Setting for Large Scale Assessments, National Assessment Governing Board,
National Center for Educational Statistics, Washington, DC.
27
Categorical Assignments Page 29
Footnotes
1. Initially 9 panelists were assigned to Group B, 5 to subpanel B1 and 4 to
subpanel B2. However, during the ratings of Section 1, one member of subpanel
B2 became ill and had to leave without completing the ratings for Section 1. The
panelists results were discarded. For Sections 2 and 3, one member of subpanel
B1 was selected to become a member of subpanel B2, resulting in two subpanels
of size 4 for ratings of Sections 2 and 3.
2. The results for the direct classification method differ in Tables 1 and 4 because
the values in Table 1 are based on a total of 7 panelists due to the disqualification
of an aberrant panelist's results.
28
Categorical Assignments Page 30
Acknowledgments
The authors would like to thank Linda Hansche, Georgia State University, for her
help in recruiting the panelists for the Georgia study and for coordinating the
logistics for that administration. Likewise, Diane Garavaglia from the Michigan
Department of Education is thanked for her help with the Michigan
administration.
29
Categorical Assignments Page 31
Table 1. Comparison of Performance Standards using Boundary
Paper and Cubic Polynomial Analytical Approaches
Perf
Standard
Group
Boundary
Paper
A1
Cubic
Polynomial
Group
Boundary
Paper
B
Cubic
Polynomial
Georgia
Basic 20.85 20.58 27.54 27.72
Prof 36.29 35.44 41.99 43.22
Advanced 45.72 45.66 46.66 45.62
Michigan
Basic 26.58 26.20 26.95 27.46
Prof 42.14 42.16 42.57 42.74
Advanced 51.33 51.38 51.44 51.39
1 In Georgia, Group A used the sorting strategy and Group B
used the classification strategy. In Michigan, Group A used
a 12-point rating scale and Group B used a 7-point rating
scale; both groups used the classification strategy.
30
Categorical Assignments Page 33
le 3. Assianment of student papers to performance
crories by panelists, Group B (classifyina papers);
raia study
Section
A2-1
1
A2-2
Section 2 Section 3
formance
eaorv
50 9 10 55
Mean 4.56 3.00 3.60 4.33
45 7 22 33
Mean 7.40 6.29 4.32 6.17
18 11 11 28
Mean 7.50 6.27 5.27 8.93
16 23 34 27
Mean 11.11 8.35 10.38 10.10
29 16 45 21
Mean 12.10 11.06 11.51 12.80
38 6 34 15
,Mean 15.10 12.00 12.50 14.10
30 8 12 8
Mean 17.30 12.75 13.50 14.80
16 7 11 8
Mean 17.20 13.29 13.73 16.40
6 9 14 5
Mean 18.30 12.22 13.64 16.60
1 27 5 0
Mean 21.00 12.96 14.00
0 26 2 0
Mean 15.23 16.50
0 1 0 0
Mean 9.00
31
Categorical Assignments Page 34
Table 4, Performance standards for Basic, Proficient,
Advanced by classification strategies; 2 panels for Section
1, 1 panel for Sections 2 & 3; Georgia study.
Advanced
Group A
Section
(sorting papers)
Panel n Basic Proficient
1 5 8.05 12.77 17.00
1 3 8.79 13.62 17.92
SECT 1 (combined) 8.42 13.19 17.46
2 4 5.89 12.16 14.08
3 4 6.54 10.94 14.18
TOTAL 20..85 36.29 45.72
Group B
Section
(classifying papers)
Panel n Basic Proficient Advanced
1 5 9.18 16.17 18.38
1 3 7.68 12.00 12.78
SECT 1 (combined) 8.62 14.61 16.28
2 4 9.04 12.76 13.74
3 4 9.52 14.30 16.60
TOTAL 27.18 41.67 46.62
3 2
Categorical Assignments Page 35
Table 5. Groups A & B classifications of the 10 common
Section 1 papers;_ Georgia study.
Student paper
1 2 3 4 4 6 7 8 9 10
Group A
A111-1 1 4 8 2 9 8 9 9 8
Al2 1 1 4 8 1 7 4 8 9 8
A13 1 1 5 7 4 7 7 8 7 7
A14 1 1 2 7 3 6 6 7 10 8
A15 1 1 4 7 4 5 6 6 9 9
A21 1 1 2 7 3 6 6 5 7 8
A22 4 1 5 7 4 6 6 8 9 10
A23 1 1 1 7 6 2 2 7 8 8
A24 1 1 1 7 2 4 4 6 8 6
MEAN
SD
GROUP B
1.33
1.00
1.00
0.00
3.11
1.62
7.22
0.44
3.22
1.48
5.78
1.99
5.44
1.81
7.11
1.27
8.44
1.01
8.00
1.12
B11 1 1 2 6 2 5 5 6 6 6
B12 2 1 2 5 2 6 2 6 7 6
B13 1 1 3 6 2 5 6 7 8 6
B14 1 1 2 7 3 5 5 6 6 7
B21 1 1 6 2 2 2 4 5 6
322 2 4 8 10 10 10 10 11 11 11
B23 1 2 4 8 5 5 7 10 10 8
324 1 1 1 5 3 5 4 7 9 6
MEAN
SD
1.63 1.50 2.88 6.63 3.63 5.00 5.13 7.13 7.75 7.00
1.06 1.07 2.30 1.69 2.77 2.33 2.64 2.30 2.12 1.77
Results without panelist B22
MEAN
SD
1.57 1.14 2.14 6.14 2.71 4.29 4.43 6.57 7.29 6.42
1.13 0.38 1.07 1.07 1.11 1.25 1.90 1.81 1.80 0.79
PAPER SCORE2.2 2 5 12 7 12 12 15 17 16
1. Group, subpanel, panelist #
2. Maximum possible score = 24
33
Categorical Assignments Page 36
Table 6, Comparability of total performance standards for
the 12-point and 7-point rating scale usina_ the Boundary
Paper Methods Michiaan study
Performance
Standard
Rating scale
12 point 7 point
Basic 26.58 26.95
Proficient 42.14 42.57
Advanced 51.33 51.44
3 4
Categorical Assignments Page 37
Table 7. Comparability of performance standards from Rounds
1 and 2: Effect of discussion
Group A Group B
Round 1 Round 2 Round 1 Round 2
Basic 26.78 26.58 28.13 26.95
Prof 41.09 42.14 39.73 42.57
Advanced 51.11 51.33 47.94 51.44
35
Categorical Assignments Page 38
Table 8. Effect of discussion on panelists' variability on
performance standards by test section for Group A usina the
12-point scale
Basic
Round 1 (Before Discussion)
Performance Standards
Proficient Advanced
Mean SD Mean SD Mean SD
Section
1 10.68 3.30 15.33 2.87 18.67 1.03
2 9.49 2.22 12.88 2.17 15.50 0.97
3 6.61 2.50 12.88 3.45 16.94 1.30
Basic
Round 2 (After Discussion)
Performance Standards
Proficient Advanced
Mean SD Mean SD Mean SD
Section
1 10.27 2.62 15.63 2.34 19.00 0.63
2 9.48 2.04 12.76 2.05 15.33 0.89
3 6.83 2.32 13.53 2.14 17.00 1.20
Categorical Assignments Page 39
Table 9. Effect of discussion on panelists' variability on
performance standards by test section for Group B usina the
7-point scale
Basic
Round 1 (Before Discussion)
Performance Standards
Proficient Advanced
Mean SD Mean SD Mean SD
Section
1 9.73 3.87 15.06 3.08 17.43 1.74
2 10.19 2.48 12.82 2.39 14.80 1.69
3 7.72 2.62 12.19 3.66 16.14 1.62
Basic
Round 2 (After Discussion)
Performance Standards
Proficient Advanced
Mean SD Mean SD Mean SD
Section
1 9.36 3.76 15.62 2.86 20.00 0.00
2 9.83 2.37 13.59 2.10 15.00 2.00
3 7.59 2.21 13.36 1.65 16.44 1.39
3 7
4.
22 -
20 -
18 -
16 -
14 -
12 -
10 -
8
-*
6 -
4 - 0
2 - R
0
0
0
11
0
-o
0
0
0
0
0 0
0
cr
0
0
0
0
0
0
0
0
0
0
0.5 2 3.5 4.5 6 7.5 8.5 10 11.5 12.5 14 15.5
Paper Classification Category
Figure 1. Example of cubic polynominal regression approach using data from Section I.
3 3
3 9
U.S. Department of Education
Office of Educational Research and Improvement (0ERI)
National Library of Education (NLE)
Educational Resources Information Center (ERIC)
REPRODUCTION RELEASE
(Specific Document)
I. DOCUMENT IDENTIFICATION:
ERIC
TM028931
Title: A 54A01-aird. P1-44-1-n=c_
Mit -rk.kr
"I=Lesiv144- Cm+b-icj'ar-P-frr rivut-ut_ lifsess
fas i Qt. lks)ptev2u-b U4L 100-144,.
Author(s): Pak, Rtniut.L.C, r .
Corporate Source: Publication Date:
II. REPRODUCTION RELEASE:
In order to disseminate as widely as possible timely and significant materials of interest to the educational community, documents announced in the
monthly abstract journal of the ERIC system, Resources in Education (RIE), are usually made available to users in microfiche, reproduced paper copy,
and electronic media, and sold through the ERIC Document Reproduction Service (EDRS). Credit is given to the source of each document, and, if
reproduction release is granted, one of the following notices is affixed to the document.
If permission is granted to reproduce and disseminate the identified document, please CHECK ONE of the following three options and sign at the bottom
of the page.
The sample sticker shown below will be
affixed to all Level 1 documents
1
PERMISSION TO REPRODUCE AND
DISSEMINATE THIS MATERIAL HAS
BEEN GRANTED BY
0e
TO THE EDUCATIONAL RESOURCES
INFORMATION CENTER (ERIC)
Check here for Level 1 release, permitting reproduction
and dissemination in microfiche or other ERIC archival
media (e.g., electronic) and paper copy.
The sample sticker shown below will be
affixed to all Level 2A documents
PERMISSION TO'REPRODUCE AND
DISSEMINATE THIS MATERIAL IN
MICROFICHE, AND IN ELECTRONIC MEDIA
FOR ERIC COLLECTION SUBSCRIBERS ONLY,
HAS BEEN GRANTED BY
2A
fe'0
TO THE EDUCATIONAL RESOURCES
INFORMATION CENTER (ERIC)
Level 2A
Check here for Level 2A release, permitting reproduction
and dissemination In microfiche and In electronic media
for ERIC archival collection subscribers only
The sample sticker shown below will be
affixed to ell Level 28 documents
PERMISSION TO REPRODUCE AND
DISSEMINATE THIS MATERIAL IN
MICROFICHE ONLy HAS BEEN GRANTED BY
2B
TO THE EDUCATIONAL RESOURCES
INFORMATION CENTER (ERIC)
Level 2B
Check here for Level 28 release, permitting
reproduction and disseminefion in microfiche only
Documents will be processed as indicated provided reproduction quality permits.
If permission to reproduce is granted, but no box is checked, documents will be processed at Level 1.
I hereby grant to the Educational Resources Information Center (ERIC) nonexclusive permission to reprpduce and disseminate this document
as indicated above. Reproductidn from the ERIC microfiche or electronic media by persons other than ERIC employees and its system
contractors requires permission tram the copyright holder. Exception is made for non-profit reproduction by libraries and other service agencies
to satisfy information needs of educators in response to discrete inquiries.
Sign
here,-)
please
Signature: Printed Name/Position/Title:
rganization/Address:
yukfac_ae_el-
Iteirr:q., 2.fo nt0A4/72-- 6207
Etaildr: Date:
L
(over)
Buros Institute
135 Bancroft Hall I:
University of Nebraska
Lincoln, NE 6858840*A
III. DOCUMENT AVAILABILITY INFORMATION (FROM NON-ERIC SOURCE):
If permission to reproduce is not granted to ERIC, or, if you wish ERIC to cite the availability of the document from another source, please
provide the following information regarding the availability of the document. (ERIC will not announce a document unless it is publicly
available, and a dependable source can be specified. Contributors should also be aware that ERIC selection criteria are significantly more
stringent for documents that cannot be made available through EDRS.)
Publisher/Distributor:
Address:
Price:
IV. REFERRAL OF ERIC TO COPYRIGHT/REPRODUCTION RIGHTS HOLDER:
If the right to grant this reproduction release is held by someone other than the addressee, please provide the appropriate name and
address:
Name:
Address:
V. WHERE TO SEND THIS FORM:
Send this form to the following ERIC Clearinghouse:
THE UNIVERSITY OF MARYLAND
ERIC CLEARINGHOUSE ON ASSESSMENT AND EVALUATION
1129 SHRIVER LAB, CAMPUS DRIVE
COLLEGE PARK, MD 20742-5701
Attn: Acquisitions
However, if solicited by the ERIC Facility, or if making an unsolicited contribution to ERIC, return this form (and the document being
contributed) to:
ERIC Processing and Reference Facility
1100 West Street, 2nd Floor
Laurel, Maryland 20707-3598
Telephone: 301-497-4080
Toll Free: 800-799-3742
FAX: 301-953-0263
e-mail: ericfac@inet.ed.gov
WWW: http://ericfac.piccard.csc.com
EFF-088 (Rev. 9/97)
PREVIOUS VERSIONS OF THIS FORM ARE OBSOLETE.

More Related Content

Similar to A Standard Setting Method Designed for Complex Performance Assessments with Multiple Performance Categories

Johnston, pattie enhancing validity of critical tasks
Johnston, pattie enhancing validity of critical tasksJohnston, pattie enhancing validity of critical tasks
Johnston, pattie enhancing validity of critical tasksWilliam Kritsonis
 
Group4 present3 3-15
Group4 present3 3-15Group4 present3 3-15
Group4 present3 3-15gsu3eagle
 
Learning_activity1_Tirado.Correa_Geovanna.Elizabeth.pptx
Learning_activity1_Tirado.Correa_Geovanna.Elizabeth.pptxLearning_activity1_Tirado.Correa_Geovanna.Elizabeth.pptx
Learning_activity1_Tirado.Correa_Geovanna.Elizabeth.pptxgetirado
 
PROF ED 7 PPT.pptx
PROF ED 7 PPT.pptxPROF ED 7 PPT.pptx
PROF ED 7 PPT.pptxDessAlla
 
Enhancing-Teaching-Learning-Through-Action-Research.pptx
Enhancing-Teaching-Learning-Through-Action-Research.pptxEnhancing-Teaching-Learning-Through-Action-Research.pptx
Enhancing-Teaching-Learning-Through-Action-Research.pptxJULIEANNETASIC3
 
Automated Trait Scores For GRE Writing Tasks
Automated Trait Scores For GRE   Writing TasksAutomated Trait Scores For GRE   Writing Tasks
Automated Trait Scores For GRE Writing TasksKate Campbell
 
A review on evaluation metrics for
A review on evaluation metrics forA review on evaluation metrics for
A review on evaluation metrics forIJDKP
 
Evaluation research-resty-samosa
Evaluation research-resty-samosaEvaluation research-resty-samosa
Evaluation research-resty-samosaResty Samosa
 
The role of item analysis in detecting and improving faulty physics objective...
The role of item analysis in detecting and improving faulty physics objective...The role of item analysis in detecting and improving faulty physics objective...
The role of item analysis in detecting and improving faulty physics objective...Alexander Decker
 
Educational Assessment and Evaluation
Educational Assessment and Evaluation Educational Assessment and Evaluation
Educational Assessment and Evaluation HennaAnsari
 
Adaptive Testing, Learning Progressions, and Students with Disabilities - May...
Adaptive Testing, Learning Progressions, and Students with Disabilities - May...Adaptive Testing, Learning Progressions, and Students with Disabilities - May...
Adaptive Testing, Learning Progressions, and Students with Disabilities - May...Peter Hofman
 
Assessment Practices And Students Approaches To Learning A Systematic Review
Assessment Practices And Students  Approaches To Learning  A Systematic ReviewAssessment Practices And Students  Approaches To Learning  A Systematic Review
Assessment Practices And Students Approaches To Learning A Systematic ReviewSheila Sinclair
 
Quality Standards ERS 2017
Quality Standards ERS 2017Quality Standards ERS 2017
Quality Standards ERS 2017Kathryn Brown
 
Levels evaluation models
Levels evaluation modelsLevels evaluation models
Levels evaluation modelsTULASI08
 
A COMPARATIVE ANALYSIS OF SELECTED STUDIES IN STUDENT PERFORMANCE PREDICTION
A COMPARATIVE ANALYSIS OF SELECTED STUDIES IN STUDENT PERFORMANCE PREDICTIONA COMPARATIVE ANALYSIS OF SELECTED STUDIES IN STUDENT PERFORMANCE PREDICTION
A COMPARATIVE ANALYSIS OF SELECTED STUDIES IN STUDENT PERFORMANCE PREDICTIONIJDKP
 
Journal raganit santos
Journal raganit santosJournal raganit santos
Journal raganit santosessayumiyuri
 

Similar to A Standard Setting Method Designed for Complex Performance Assessments with Multiple Performance Categories (20)

Johnston, pattie enhancing validity of critical tasks
Johnston, pattie enhancing validity of critical tasksJohnston, pattie enhancing validity of critical tasks
Johnston, pattie enhancing validity of critical tasks
 
EDR8205-3
EDR8205-3EDR8205-3
EDR8205-3
 
Chapter11
Chapter11Chapter11
Chapter11
 
Group4 present3 3-15
Group4 present3 3-15Group4 present3 3-15
Group4 present3 3-15
 
Learning_activity1_Tirado.Correa_Geovanna.Elizabeth.pptx
Learning_activity1_Tirado.Correa_Geovanna.Elizabeth.pptxLearning_activity1_Tirado.Correa_Geovanna.Elizabeth.pptx
Learning_activity1_Tirado.Correa_Geovanna.Elizabeth.pptx
 
PROF ED 7 PPT.pptx
PROF ED 7 PPT.pptxPROF ED 7 PPT.pptx
PROF ED 7 PPT.pptx
 
Enhancing-Teaching-Learning-Through-Action-Research.pptx
Enhancing-Teaching-Learning-Through-Action-Research.pptxEnhancing-Teaching-Learning-Through-Action-Research.pptx
Enhancing-Teaching-Learning-Through-Action-Research.pptx
 
Automated Trait Scores For GRE Writing Tasks
Automated Trait Scores For GRE   Writing TasksAutomated Trait Scores For GRE   Writing Tasks
Automated Trait Scores For GRE Writing Tasks
 
A review on evaluation metrics for
A review on evaluation metrics forA review on evaluation metrics for
A review on evaluation metrics for
 
Evaluation research-resty-samosa
Evaluation research-resty-samosaEvaluation research-resty-samosa
Evaluation research-resty-samosa
 
The role of item analysis in detecting and improving faulty physics objective...
The role of item analysis in detecting and improving faulty physics objective...The role of item analysis in detecting and improving faulty physics objective...
The role of item analysis in detecting and improving faulty physics objective...
 
Educational Assessment and Evaluation
Educational Assessment and Evaluation Educational Assessment and Evaluation
Educational Assessment and Evaluation
 
Adaptive Testing, Learning Progressions, and Students with Disabilities - May...
Adaptive Testing, Learning Progressions, and Students with Disabilities - May...Adaptive Testing, Learning Progressions, and Students with Disabilities - May...
Adaptive Testing, Learning Progressions, and Students with Disabilities - May...
 
Assessment Practices And Students Approaches To Learning A Systematic Review
Assessment Practices And Students  Approaches To Learning  A Systematic ReviewAssessment Practices And Students  Approaches To Learning  A Systematic Review
Assessment Practices And Students Approaches To Learning A Systematic Review
 
Quality Standards ERS 2017
Quality Standards ERS 2017Quality Standards ERS 2017
Quality Standards ERS 2017
 
Levels evaluation models
Levels evaluation modelsLevels evaluation models
Levels evaluation models
 
A COMPARATIVE ANALYSIS OF SELECTED STUDIES IN STUDENT PERFORMANCE PREDICTION
A COMPARATIVE ANALYSIS OF SELECTED STUDIES IN STUDENT PERFORMANCE PREDICTIONA COMPARATIVE ANALYSIS OF SELECTED STUDIES IN STUDENT PERFORMANCE PREDICTION
A COMPARATIVE ANALYSIS OF SELECTED STUDIES IN STUDENT PERFORMANCE PREDICTION
 
Principles of student_assessment_satya_
Principles of student_assessment_satya_Principles of student_assessment_satya_
Principles of student_assessment_satya_
 
Brown Myford NCME presentation
Brown Myford NCME presentationBrown Myford NCME presentation
Brown Myford NCME presentation
 
Journal raganit santos
Journal raganit santosJournal raganit santos
Journal raganit santos
 

More from Monica Franklin

Essay Computers For And Against – Tele
Essay Computers For And Against – TeleEssay Computers For And Against – Tele
Essay Computers For And Against – TeleMonica Franklin
 
Essay Websites Buy Essay Online
Essay Websites Buy Essay OnlineEssay Websites Buy Essay Online
Essay Websites Buy Essay OnlineMonica Franklin
 
How To Write An Expository Essay RGetStudying
How To Write An Expository Essay RGetStudyingHow To Write An Expository Essay RGetStudying
How To Write An Expository Essay RGetStudyingMonica Franklin
 
Professional Custom Essays Writing Service! Profession
Professional Custom Essays Writing Service! ProfessionProfessional Custom Essays Writing Service! Profession
Professional Custom Essays Writing Service! ProfessionMonica Franklin
 
Cosa Rende Un Ottimo Paragrafo Introduttivo
Cosa Rende Un Ottimo Paragrafo IntroduttivoCosa Rende Un Ottimo Paragrafo Introduttivo
Cosa Rende Un Ottimo Paragrafo IntroduttivoMonica Franklin
 
Dotted Straight Lines For Writing Practice - Free Tra
Dotted Straight Lines For Writing Practice - Free TraDotted Straight Lines For Writing Practice - Free Tra
Dotted Straight Lines For Writing Practice - Free TraMonica Franklin
 
Definitive Guide To Essay Writing Step-By-Step Process - Paper Per Hour
Definitive Guide To Essay Writing Step-By-Step Process - Paper Per HourDefinitive Guide To Essay Writing Step-By-Step Process - Paper Per Hour
Definitive Guide To Essay Writing Step-By-Step Process - Paper Per HourMonica Franklin
 
Roald Dahl MATILDA Writing
Roald Dahl MATILDA WritingRoald Dahl MATILDA Writing
Roald Dahl MATILDA WritingMonica Franklin
 
How To Write Essay Proposal Examples - South Florida P
How To Write Essay Proposal Examples - South Florida PHow To Write Essay Proposal Examples - South Florida P
How To Write Essay Proposal Examples - South Florida PMonica Franklin
 
Buy College Application Essays 2013 Buy College
Buy College Application Essays 2013 Buy CollegeBuy College Application Essays 2013 Buy College
Buy College Application Essays 2013 Buy CollegeMonica Franklin
 
005 Essay Example Best Photos Of Examples Litera
005 Essay Example Best Photos Of Examples Litera005 Essay Example Best Photos Of Examples Litera
005 Essay Example Best Photos Of Examples LiteraMonica Franklin
 
Crawford, Marcia RCTCM SENIOR PROJECT
Crawford, Marcia RCTCM SENIOR PROJECTCrawford, Marcia RCTCM SENIOR PROJECT
Crawford, Marcia RCTCM SENIOR PROJECTMonica Franklin
 
How To Write An About Me Page For A Blog (Free Tem
How To Write An About Me Page For A Blog (Free TemHow To Write An About Me Page For A Blog (Free Tem
How To Write An About Me Page For A Blog (Free TemMonica Franklin
 
Thme Sociologie De Lducation
Thme Sociologie De LducationThme Sociologie De Lducation
Thme Sociologie De LducationMonica Franklin
 
Cause And Effect Essay About Happiness Free Ess
Cause And Effect Essay About Happiness Free EssCause And Effect Essay About Happiness Free Ess
Cause And Effect Essay About Happiness Free EssMonica Franklin
 
Policy Brief Template Word Free
Policy Brief Template Word FreePolicy Brief Template Word Free
Policy Brief Template Word FreeMonica Franklin
 
Conclusion Paragraph Research Paper. Conclusion Paragraph Examp
Conclusion Paragraph Research Paper. Conclusion Paragraph ExampConclusion Paragraph Research Paper. Conclusion Paragraph Examp
Conclusion Paragraph Research Paper. Conclusion Paragraph ExampMonica Franklin
 
Free Printable Decorative Lined Paper - Printable Te
Free Printable Decorative Lined Paper - Printable TeFree Printable Decorative Lined Paper - Printable Te
Free Printable Decorative Lined Paper - Printable TeMonica Franklin
 
016 Scholarship Essay Examples About Yourself Printables Corner Wh
016 Scholarship Essay Examples About Yourself Printables Corner Wh016 Scholarship Essay Examples About Yourself Printables Corner Wh
016 Scholarship Essay Examples About Yourself Printables Corner WhMonica Franklin
 
The Importance Of Homework
The Importance Of HomeworkThe Importance Of Homework
The Importance Of HomeworkMonica Franklin
 

More from Monica Franklin (20)

Essay Computers For And Against – Tele
Essay Computers For And Against – TeleEssay Computers For And Against – Tele
Essay Computers For And Against – Tele
 
Essay Websites Buy Essay Online
Essay Websites Buy Essay OnlineEssay Websites Buy Essay Online
Essay Websites Buy Essay Online
 
How To Write An Expository Essay RGetStudying
How To Write An Expository Essay RGetStudyingHow To Write An Expository Essay RGetStudying
How To Write An Expository Essay RGetStudying
 
Professional Custom Essays Writing Service! Profession
Professional Custom Essays Writing Service! ProfessionProfessional Custom Essays Writing Service! Profession
Professional Custom Essays Writing Service! Profession
 
Cosa Rende Un Ottimo Paragrafo Introduttivo
Cosa Rende Un Ottimo Paragrafo IntroduttivoCosa Rende Un Ottimo Paragrafo Introduttivo
Cosa Rende Un Ottimo Paragrafo Introduttivo
 
Dotted Straight Lines For Writing Practice - Free Tra
Dotted Straight Lines For Writing Practice - Free TraDotted Straight Lines For Writing Practice - Free Tra
Dotted Straight Lines For Writing Practice - Free Tra
 
Definitive Guide To Essay Writing Step-By-Step Process - Paper Per Hour
Definitive Guide To Essay Writing Step-By-Step Process - Paper Per HourDefinitive Guide To Essay Writing Step-By-Step Process - Paper Per Hour
Definitive Guide To Essay Writing Step-By-Step Process - Paper Per Hour
 
Roald Dahl MATILDA Writing
Roald Dahl MATILDA WritingRoald Dahl MATILDA Writing
Roald Dahl MATILDA Writing
 
How To Write Essay Proposal Examples - South Florida P
How To Write Essay Proposal Examples - South Florida PHow To Write Essay Proposal Examples - South Florida P
How To Write Essay Proposal Examples - South Florida P
 
Buy College Application Essays 2013 Buy College
Buy College Application Essays 2013 Buy CollegeBuy College Application Essays 2013 Buy College
Buy College Application Essays 2013 Buy College
 
005 Essay Example Best Photos Of Examples Litera
005 Essay Example Best Photos Of Examples Litera005 Essay Example Best Photos Of Examples Litera
005 Essay Example Best Photos Of Examples Litera
 
Crawford, Marcia RCTCM SENIOR PROJECT
Crawford, Marcia RCTCM SENIOR PROJECTCrawford, Marcia RCTCM SENIOR PROJECT
Crawford, Marcia RCTCM SENIOR PROJECT
 
How To Write An About Me Page For A Blog (Free Tem
How To Write An About Me Page For A Blog (Free TemHow To Write An About Me Page For A Blog (Free Tem
How To Write An About Me Page For A Blog (Free Tem
 
Thme Sociologie De Lducation
Thme Sociologie De LducationThme Sociologie De Lducation
Thme Sociologie De Lducation
 
Cause And Effect Essay About Happiness Free Ess
Cause And Effect Essay About Happiness Free EssCause And Effect Essay About Happiness Free Ess
Cause And Effect Essay About Happiness Free Ess
 
Policy Brief Template Word Free
Policy Brief Template Word FreePolicy Brief Template Word Free
Policy Brief Template Word Free
 
Conclusion Paragraph Research Paper. Conclusion Paragraph Examp
Conclusion Paragraph Research Paper. Conclusion Paragraph ExampConclusion Paragraph Research Paper. Conclusion Paragraph Examp
Conclusion Paragraph Research Paper. Conclusion Paragraph Examp
 
Free Printable Decorative Lined Paper - Printable Te
Free Printable Decorative Lined Paper - Printable TeFree Printable Decorative Lined Paper - Printable Te
Free Printable Decorative Lined Paper - Printable Te
 
016 Scholarship Essay Examples About Yourself Printables Corner Wh
016 Scholarship Essay Examples About Yourself Printables Corner Wh016 Scholarship Essay Examples About Yourself Printables Corner Wh
016 Scholarship Essay Examples About Yourself Printables Corner Wh
 
The Importance Of Homework
The Importance Of HomeworkThe Importance Of Homework
The Importance Of Homework
 

Recently uploaded

Incoming and Outgoing Shipments in 1 STEP Using Odoo 17
Incoming and Outgoing Shipments in 1 STEP Using Odoo 17Incoming and Outgoing Shipments in 1 STEP Using Odoo 17
Incoming and Outgoing Shipments in 1 STEP Using Odoo 17Celine George
 
Alper Gobel In Media Res Media Component
Alper Gobel In Media Res Media ComponentAlper Gobel In Media Res Media Component
Alper Gobel In Media Res Media ComponentInMediaRes1
 
call girls in Kamla Market (DELHI) 🔝 >༒9953330565🔝 genuine Escort Service 🔝✔️✔️
call girls in Kamla Market (DELHI) 🔝 >༒9953330565🔝 genuine Escort Service 🔝✔️✔️call girls in Kamla Market (DELHI) 🔝 >༒9953330565🔝 genuine Escort Service 🔝✔️✔️
call girls in Kamla Market (DELHI) 🔝 >༒9953330565🔝 genuine Escort Service 🔝✔️✔️9953056974 Low Rate Call Girls In Saket, Delhi NCR
 
Presentation by Andreas Schleicher Tackling the School Absenteeism Crisis 30 ...
Presentation by Andreas Schleicher Tackling the School Absenteeism Crisis 30 ...Presentation by Andreas Schleicher Tackling the School Absenteeism Crisis 30 ...
Presentation by Andreas Schleicher Tackling the School Absenteeism Crisis 30 ...EduSkills OECD
 
The Most Excellent Way | 1 Corinthians 13
The Most Excellent Way | 1 Corinthians 13The Most Excellent Way | 1 Corinthians 13
The Most Excellent Way | 1 Corinthians 13Steve Thomason
 
Separation of Lanthanides/ Lanthanides and Actinides
Separation of Lanthanides/ Lanthanides and ActinidesSeparation of Lanthanides/ Lanthanides and Actinides
Separation of Lanthanides/ Lanthanides and ActinidesFatimaKhan178732
 
Accessible design: Minimum effort, maximum impact
Accessible design: Minimum effort, maximum impactAccessible design: Minimum effort, maximum impact
Accessible design: Minimum effort, maximum impactdawncurless
 
KSHARA STURA .pptx---KSHARA KARMA THERAPY (CAUSTIC THERAPY)————IMP.OF KSHARA ...
KSHARA STURA .pptx---KSHARA KARMA THERAPY (CAUSTIC THERAPY)————IMP.OF KSHARA ...KSHARA STURA .pptx---KSHARA KARMA THERAPY (CAUSTIC THERAPY)————IMP.OF KSHARA ...
KSHARA STURA .pptx---KSHARA KARMA THERAPY (CAUSTIC THERAPY)————IMP.OF KSHARA ...M56BOOKSTORE PRODUCT/SERVICE
 
_Math 4-Q4 Week 5.pptx Steps in Collecting Data
_Math 4-Q4 Week 5.pptx Steps in Collecting Data_Math 4-Q4 Week 5.pptx Steps in Collecting Data
_Math 4-Q4 Week 5.pptx Steps in Collecting DataJhengPantaleon
 
Software Engineering Methodologies (overview)
Software Engineering Methodologies (overview)Software Engineering Methodologies (overview)
Software Engineering Methodologies (overview)eniolaolutunde
 
Employee wellbeing at the workplace.pptx
Employee wellbeing at the workplace.pptxEmployee wellbeing at the workplace.pptx
Employee wellbeing at the workplace.pptxNirmalaLoungPoorunde1
 
Paris 2024 Olympic Geographies - an activity
Paris 2024 Olympic Geographies - an activityParis 2024 Olympic Geographies - an activity
Paris 2024 Olympic Geographies - an activityGeoBlogs
 
A Critique of the Proposed National Education Policy Reform
A Critique of the Proposed National Education Policy ReformA Critique of the Proposed National Education Policy Reform
A Critique of the Proposed National Education Policy ReformChameera Dedduwage
 
Presiding Officer Training module 2024 lok sabha elections
Presiding Officer Training module 2024 lok sabha electionsPresiding Officer Training module 2024 lok sabha elections
Presiding Officer Training module 2024 lok sabha electionsanshu789521
 
CARE OF CHILD IN INCUBATOR..........pptx
CARE OF CHILD IN INCUBATOR..........pptxCARE OF CHILD IN INCUBATOR..........pptx
CARE OF CHILD IN INCUBATOR..........pptxGaneshChakor2
 
Kisan Call Centre - To harness potential of ICT in Agriculture by answer farm...
Kisan Call Centre - To harness potential of ICT in Agriculture by answer farm...Kisan Call Centre - To harness potential of ICT in Agriculture by answer farm...
Kisan Call Centre - To harness potential of ICT in Agriculture by answer farm...Krashi Coaching
 
How to Make a Pirate ship Primary Education.pptx
How to Make a Pirate ship Primary Education.pptxHow to Make a Pirate ship Primary Education.pptx
How to Make a Pirate ship Primary Education.pptxmanuelaromero2013
 

Recently uploaded (20)

Incoming and Outgoing Shipments in 1 STEP Using Odoo 17
Incoming and Outgoing Shipments in 1 STEP Using Odoo 17Incoming and Outgoing Shipments in 1 STEP Using Odoo 17
Incoming and Outgoing Shipments in 1 STEP Using Odoo 17
 
Alper Gobel In Media Res Media Component
Alper Gobel In Media Res Media ComponentAlper Gobel In Media Res Media Component
Alper Gobel In Media Res Media Component
 
call girls in Kamla Market (DELHI) 🔝 >༒9953330565🔝 genuine Escort Service 🔝✔️✔️
call girls in Kamla Market (DELHI) 🔝 >༒9953330565🔝 genuine Escort Service 🔝✔️✔️call girls in Kamla Market (DELHI) 🔝 >༒9953330565🔝 genuine Escort Service 🔝✔️✔️
call girls in Kamla Market (DELHI) 🔝 >༒9953330565🔝 genuine Escort Service 🔝✔️✔️
 
Presentation by Andreas Schleicher Tackling the School Absenteeism Crisis 30 ...
Presentation by Andreas Schleicher Tackling the School Absenteeism Crisis 30 ...Presentation by Andreas Schleicher Tackling the School Absenteeism Crisis 30 ...
Presentation by Andreas Schleicher Tackling the School Absenteeism Crisis 30 ...
 
The Most Excellent Way | 1 Corinthians 13
The Most Excellent Way | 1 Corinthians 13The Most Excellent Way | 1 Corinthians 13
The Most Excellent Way | 1 Corinthians 13
 
Separation of Lanthanides/ Lanthanides and Actinides
Separation of Lanthanides/ Lanthanides and ActinidesSeparation of Lanthanides/ Lanthanides and Actinides
Separation of Lanthanides/ Lanthanides and Actinides
 
Accessible design: Minimum effort, maximum impact
Accessible design: Minimum effort, maximum impactAccessible design: Minimum effort, maximum impact
Accessible design: Minimum effort, maximum impact
 
KSHARA STURA .pptx---KSHARA KARMA THERAPY (CAUSTIC THERAPY)————IMP.OF KSHARA ...
KSHARA STURA .pptx---KSHARA KARMA THERAPY (CAUSTIC THERAPY)————IMP.OF KSHARA ...KSHARA STURA .pptx---KSHARA KARMA THERAPY (CAUSTIC THERAPY)————IMP.OF KSHARA ...
KSHARA STURA .pptx---KSHARA KARMA THERAPY (CAUSTIC THERAPY)————IMP.OF KSHARA ...
 
_Math 4-Q4 Week 5.pptx Steps in Collecting Data
_Math 4-Q4 Week 5.pptx Steps in Collecting Data_Math 4-Q4 Week 5.pptx Steps in Collecting Data
_Math 4-Q4 Week 5.pptx Steps in Collecting Data
 
Software Engineering Methodologies (overview)
Software Engineering Methodologies (overview)Software Engineering Methodologies (overview)
Software Engineering Methodologies (overview)
 
Employee wellbeing at the workplace.pptx
Employee wellbeing at the workplace.pptxEmployee wellbeing at the workplace.pptx
Employee wellbeing at the workplace.pptx
 
Paris 2024 Olympic Geographies - an activity
Paris 2024 Olympic Geographies - an activityParis 2024 Olympic Geographies - an activity
Paris 2024 Olympic Geographies - an activity
 
9953330565 Low Rate Call Girls In Rohini Delhi NCR
9953330565 Low Rate Call Girls In Rohini  Delhi NCR9953330565 Low Rate Call Girls In Rohini  Delhi NCR
9953330565 Low Rate Call Girls In Rohini Delhi NCR
 
Staff of Color (SOC) Retention Efforts DDSD
Staff of Color (SOC) Retention Efforts DDSDStaff of Color (SOC) Retention Efforts DDSD
Staff of Color (SOC) Retention Efforts DDSD
 
A Critique of the Proposed National Education Policy Reform
A Critique of the Proposed National Education Policy ReformA Critique of the Proposed National Education Policy Reform
A Critique of the Proposed National Education Policy Reform
 
Presiding Officer Training module 2024 lok sabha elections
Presiding Officer Training module 2024 lok sabha electionsPresiding Officer Training module 2024 lok sabha elections
Presiding Officer Training module 2024 lok sabha elections
 
CARE OF CHILD IN INCUBATOR..........pptx
CARE OF CHILD IN INCUBATOR..........pptxCARE OF CHILD IN INCUBATOR..........pptx
CARE OF CHILD IN INCUBATOR..........pptx
 
Kisan Call Centre - To harness potential of ICT in Agriculture by answer farm...
Kisan Call Centre - To harness potential of ICT in Agriculture by answer farm...Kisan Call Centre - To harness potential of ICT in Agriculture by answer farm...
Kisan Call Centre - To harness potential of ICT in Agriculture by answer farm...
 
Model Call Girl in Tilak Nagar Delhi reach out to us at 🔝9953056974🔝
Model Call Girl in Tilak Nagar Delhi reach out to us at 🔝9953056974🔝Model Call Girl in Tilak Nagar Delhi reach out to us at 🔝9953056974🔝
Model Call Girl in Tilak Nagar Delhi reach out to us at 🔝9953056974🔝
 
How to Make a Pirate ship Primary Education.pptx
How to Make a Pirate ship Primary Education.pptxHow to Make a Pirate ship Primary Education.pptx
How to Make a Pirate ship Primary Education.pptx
 

A Standard Setting Method Designed for Complex Performance Assessments with Multiple Performance Categories

  • 1. DOCUMENT RESUME ED 422 371 TM 028 931 AUTHOR Plake, Barbara S.; Hambleton, Ronald K. TITLE A Standard Setting Method Designed for Complex Performance Assessments with Multiple Performance Categories: Categorical Assignments of Student Work. SPONS AGENCY National Science Foundation, Arlington, VA. PUB DATE 1998-04-00 NOTE 39p. CONTRACT NSF-955480 PUB TYPE Reports Evaluative (142) Speeches/Meeting Papers (150) EDRS PRICE MF01/PCO2 Plus Postage. DESCRIPTORS *Classification; *Data Analysis; Grade 8; Junior High School Students; Junior High Schools; *Performance Based Assessment; Standards; Tables (Data); *Teachers IDENTIFIERS *Analytical Methods; Georgia; Michigan; National Assessment of Educational Progress; Panel Reviews; *Standard Setting ABSTRACT This paper reports on a standard-setting method designed for complex performance assessments with multiple performance categories. The method studied, the Analytical Judgment Method, involves panelists' making analytical classification decisions for each of the test's components individually. It also allows for discussion and reconsideration of panelists' initial classification decisions before moving on to the next test component. The method was used in two sites, Georgia and Michigan, on two different occasions using the 1996 eighth grade National Assessment of Educational Progress Science Assessment. The Georgia administration focused on the comparability of results from the Analytical Judgment Method when two different classification strategies, a sorting strategy and a direct classification strategy, were used. In Michigan, 2 versions of the rating scale were used, 1 with 12 classification categories and 1 with 7. Different performance descriptors were used in the two states. Sixteen teacher panelists in Georgia divided into 2 panels evaluated 50 papers per panel. In Michigan, 2 groups of 4 panelists each evaluated 50 papers. Results did not vary much as a function of the analytic strategy or whether a long or short classification scale was used. Discussion by panelists affected the results only when a seven-point scale was used, and the result was higher performance standards after discussion. The sorting method resulted in lower performance standards for Basic and Proficient levels, but not for Advanced. Results suggest that the decision regarding the method of analyzing the data and the choice of classification scale may be made as a matter of convenience or personal preference. (Contains nine tables, one figure, and nine references.) (SLD) ******************************************************************************** * Reproductions supplied by EDRS are the best that can be made * * from the original document. * ********************************************************************************
  • 2. A. A Standard SettingMethod Designed for Complex Performance Assessments with Multiple Performance Categories: Categorical Assignments of Student Work U.S. DEPARTMENT OF EDUCATION Office of Educational ResearCh and tmptevernent EDUC TIONAL RESOURCES INFORMATION CENTER (ERIC) This document has been reproduced as received from the person or organization originating it. Minor changes have been made to improve reproduction quality. Points of view or op.mions stated in this Ronald K. Hambleton 'University of Massachusetts at Amherst document do not necessarily represent official OERI position or policy. Barbara S. Plake University of Nebraska-Lincoln PERMISSION TO REPRODUCE AND DISSEMINATE THIS MATERIAL HAS BEEN GRANTED BY 2).c3ti.xc, PI Ake_ TO THE EDUCATIONAL RESOURCES INFORMATION CENTER (ERIC) 1 Running Head: Categorical Assignments This material is based on work supported by theNational Science Foundation Grant No. 955480. Any opinions, findings, and conclusions or recommendations expressed in this material are those of the authors and do not necessarilyreflect the views of the National Science Foundation. Paper presented at the annual meeting of the American Educational Research CO Cs1 Association, San Diego, April, 1998. a 2 2
  • 3. Categorical Assignments Page 3 A Standard Setting Method Designed for Complex Performance Assessments with Multiple Performance Categories: Categorical Assignments of Student Work Most judgmental standard setting methods (e.g., Angoff, 1971; Livingston and Zieky, 1982) were designedfor use with multiple-choice assessments and are most frequently used with assessments that use only one performance standard in score reporting (e.g., pass/fail; master/non-master). Attempts to generalize these methods to non-dichotomously scored assessments have been met with mixed results (Hambleton & Plake, 1995). Further, generalizations of the Angoff method to assessments with multiple performance standards have been criticized (Shepard, 1995; NAE, 1995; Flake, 1996). In 1995, our research project was funded by the National Science Foundation to investigate new standard setting methods with applications to state assessment programs, many of which contain performance type assessments and produce results based on multiple performance standards (e.g., Basic, Proficient, and Advanced). One new method, and the one described in this paper, is a judgmental procedure that focuses panelists on actual student work. The panelists' task is to classify student papers into one of several performance categories defined to capture levelsof performance as expressed by the multiple performance categories. Two general approaches have been investigated in this research project: an analytical and a holistic approach. In the analytic approach, each of the components that comprise the assessment are considered independently by the panelists. These could be naturally occurring sections of the assessment or some
  • 4. Categorical Assignments Page 4 other decomposition of the test into meaningful subparts (such as all common content or common format). Regardless of how these components are formulated, for each of these sections or component parts, the panelists review each of several student papers, sampled to present the full score continuum, and are asked to make categorical assignments regarding the performance levels represented by the quality of the student's work. These decisions are made for each component or part of the assessment separately; once the panel has Completed their classification process for the first component of the test, they consider the set of student papers for the second component. Student ppers are not presented in the same order across the components. The panelists do not know the author identification of the student's work, so the panelists are not able to make a total judgment about the overall work of an individual student; rather the panelists classify the papers for the students independently for each of the test components. By contrast, with the holistic method, panelists are shown an entire test booklet for a student (Jaeger & Mills, 1998). The panelists may make multiple, sequential classification decisions for a single student before moving on to the next student's work. For each student's paper, the panelist may be asked to first classify each of the individual components on the performance continuum, and subsequently to make an overall classification judgment about the student with regard to the students' overall performance classification. Therefore, one feature that distinguishes the analytical method from the holistic method is the amount of information the panelists process at any one time. With the analytic method, panelists focus on one test component at a time and make their classification decisions with respect to the performance continuum relative to that test component only. For the holistic method, the panelists consider all test components simultaneously. Further, with the holistic 4
  • 5. Categorical Assignments Page 5 method, panelists see an entire student's performance and make an overall judgment. A panelist in the analytical method, by design, does not consider the overall performance of the students but rather considers the student's performance as an exclusive function of the component parts. The first application of these methods was based in a large northeastern state using its state assessment with middle school mathematics. This state's middle school mathematics assessment is comprised of multiple components, some of which are performance based while others are multiple-choice. The results from the standard setting study indicted high comparability across the analytic and holistic approaches with the performance tasks but produced fairly large discrepancies when used with multiple-choice questions. This was in part an artifact of the implementation of the analytical approach with the multiple choice test. Further, and most importantly, the performance assessment tasks, while open ended, were fairly limited in their scope and performance expectations (See Mills, Plake, Jaeger, & Hambleton, 1997). The purpose of the current study was to apply these methods with an assessment program that involved fewer multiple-choice questions and that had varying degrees of complexity in the performance assessments. Toward that end, the 1996 eighth grade NAEP Science Assessment was identified as the assessment program for consideration. Moreover, further refinements of the holistic and analytic methods were compared. The purpose this paper is to report on one of these approaches: the Analytical Judgment Method. Much as described earlier with the recent study in the northeastern state, this approach involved panelists making analytical classification decisions for each of the test's components individually and allowed for discussion and reconsideration of panelists' initial classification decisions prior to moving on to the next test component. 5
  • 6. Categorical Assignments Page 6 The Analytic Judgment Method was used in two sites at two different occasions using the 1996 eighth grade NAEP Science Assessment, Georgia and Michigan. The Georgia administration focused on the comparability of results from the Analytical Judgment Method when two different classification strategies were used: a sorting strategy and a direct classification strategy. For the Michigan administration, two versions of the rating scale were used, one with 12 classification categories and one with 7 categories. One goal of theMichigan study was to investigate the degree of comparability of results across these two classification scales, including the amount of time required by panelists to complete the classification tasks using the 12 and 7 point scales. In addition, two different sets of performance descriptors were employed: one set was based on the NAEP Science Frameworks (Georgia) and another set was based on a translation of these Science Frameworks to reflect the actual questions in the NAEP booklet selected for use with this standard setting project (Michigan). Method Instrument. One booklet consisting of three sections or blocks of test items from the 1996 eighth grade NAEP Science Assessment (Booklet 226F) was selected for this study. Sections 1 and 2 contain several multiple-choice and short answer questions while Section 3 presents many open-ended questions based on a hands-on experiment. There are 22 points available in Section 1; 22 in Section 2 and 18 in Section 3. Therefore, student scores for the booklet could range from a low of 0 to a high of 64. Performance Descriptors. Performance on NAEP assessments are currently reported on a performance scale with three performance standards (Basic, Proficient, and Advanced), resulting in four possible achievement categories: Below Basic, Basic, Proficient, and Advanced.
  • 7. Categorical Assignments Page 7 Performance descriptors varied across administration site. For the Georgia administration, the performance descriptorspublished by NAEP to conform with the eighth grade NAEP Science Frameworks were used. In a companion study, a panel of secondary science teachers who were familiar with the assessment and the NAEP Science Frameworks, developed a set of performance descriptors that were aligned with the specific content on the test booklet used in the Georgia and Michigan studies. See Mills and Jaeger (1998) for more details on this process. These test-aligned performance descriptors were used in the Michigan standard setting study. Georgia Study Panelists. Secondary science teachers or administrators from a large southeastern city were recruited for participation in this study. A total of 16 teachers participated in this study, subdivided into two groups, A and B, in such a way that they were nearly equal in years of teaching secondary science or other relevant educational experience. Classification Strategies. Two strategies for making classification decisions based on student work were considered. Group A performed the sort task and Group B used a direct classification approach. To aid in the classification of student work into the achievement categories, 12 ordered categories were created as follows: 7
  • 8. cr Performance Categories Below Basic Low: Below Basic Medium: Below Basic High: Basic Low: Basic Medium: Basic High: Proficient Low: Categorical Assignments Page 8 Performance Description Far Below Basic Clearly Below Basic Just Below Basic Just Barely Basic Clearly Basic Almost Proficient Just Barely Proficient Proficient Medium: Clearly Proficient Proficient High: Advanced Low: Advanced Medium: Advanced High: Almost Advanced Just Barely Advanced Clearly Advanced Highly Advanced For the sort strategy (Group A), panelists were instructed to first sort the nt papers into one of the four major categories (Below Basic, Basic, lent, Advanced). Subsequent to this initial categorical assignment, ists were to focus only on those papers assigned to one of the major Dries (say Below Basic) and separate these papers into finer categories, such tow Basic Low, Below Basic Medium, and Below Basic High. The lation was that this strategy would minimize within category differences, in melists perception, of the papers belonging to any one category, and ise maximize the distinction, in the panelists' perception, of the papers Jrized in different categories. The direct classification strategy instructed panelists to make a single fication decision for a student's paper into one of the 12 categories. The BEST COPY AVAILABLE :e 9 ?.d I. a
  • 9. Categorical Assignments Page 10 this only occurred for Section 1 when both subpanels within the conditions evaluated the same 50 student papers. Procedures. The teachers met in a large southeastern city for two days as part of the larger comprehensive comparative study. During the first day, panelists were kept together in one large group. The panelists were trained in the assessment design and scoring rubrics. They engaged in a discussion of the performance descriptors for the categories used by NAEP: Below Basic, Basic, Proficient, and Advanced. The panelists were given a chart that translated these performance categories using the descriptors provided NAEP eighth grade NAEP Science Frameworks. The purpose of the ensuing discussion was to articulate performance expectations for Below Basic, Basic, Proficient, and Advanced levels of performance in terms of the 1996 eighth grade NAEP Science Assessment. At the conclusion of this discussion, the panelists were assigned to their respective groups. The 8 panelists assigned to the direct classification method and 9 were assigned to the sort classification approach. Each group was convened in a small room and trained to use their specific classification strategy. Each of these panels were further subdivided into two subpanels (Al, A2. B1, B2)1. Panelists were given several forms to aid in recording their classification decisions, including a coding form that provided a precoded listing of the paper's identification number and two columns, one for their initial classification decision and one to use to record their reconsidered value following their panel's discussion. Panelists then convened in their small groups; both panels began by considering the 50 papers assigned to their subpanel for Section 1. Following their conclusion of initial ratings, subpanel discussion, and final classification 9
  • 10. Categorical Assignments Page 11 ratings, subpanels Al and B1 worked with the 50 students papers from Section 2 and subpanels A2 and B2 made classification decisions for the 50 papers from Section 3. It was originally planned that all subpanels would rate papers from all three sections. However due to lack of time, it was decided to allocate the Section 2 papers to one of the subpanels and the Section 3 papers to the other. This was done so that an estimate of performance standards could be determined for each of the three sections therefore allowing for total standards for the full booklet to be determined. However, this decision sacrificed some of the comparative information that would have been gained by running parallel subpanels for all three sections. Also the comparability of common papers was only possible, using this design, for the 10 common papers across the subpanels for Section 1. Michigan Instrument. This study used the same eighth grade NAEP science assessment booklet that was used in the Georgia study. Panelists. A total of 8 panelists participated in the study, divided in two groups of 4 each, making the groups as equal as possible of years of teaching science and science subject/grades taught. Student papers. For this administration, a total of 50 papers were selected to be used by both subgroups. Classification scale: Group A used the same classification scale that was used in the Georgia administration. Group B used an abbreviated 7-point version of that scale, as follows: 1 0
  • 11. Rating Performance Category 1 Below Basic 2 Borderline Basic 3 Basic 4 Borderline Proficient 5 Proficient 6 Borderline Advanced 7 Advanced Categorical Assignments Page 12 Performance Description Clearly Below Basic Between Below Basic and Basic Clearly Basic Between Basic and Proficient Clearly Proficient Between Proficient & Advanced Clearly Advanced Performance descriptors. Performance descriptors that were developed for application with this specific test booklet were used in the Michigan study. Procedure. The procedures used in Michigan mirrored those used in the Georgia study. Results The design of the study afforded the opportunity to consider four research questions: 1. How are the performance standards affected by the choice of analytic strategy? 2. Are the classification decisions affected by the classification strategy (sorting versus direct classification)? 3. Do the performance standards differ as a function of number of classification categories (7 vs. 12)? 4. Are performance standards affected by panel discussion? These research questions will be addressed sequentially, using data from either the Georgia or Michigan study (or both). 1 1
  • 12. Categorical Assignments Page 13 How are the performance standards affected by the choice of analytic strategy? With the Boundary Paper Method, scores for papers that were assigned to the "boundary categories" were used in deriving a performance standard. With the 7-point rating scale, for example, the scores of papers assigned a performance classification of "2" (Borderline Basic) by the panelists were averaged to obtain an estimate of the Basic performance standard. The process was repeated for scores assigned performance classifications of "4" (Borderline Proficient) and "6" (Borderline Advanced) to obtain estimates of the Proficient and Advanced performance standards. With the 2-point rating scale, the papers classified by panelists as "3" and "4" (Below Basic High and Basic Low) were considered "Borderline Basic" and the scores of these papers were averaged to obtain an estimate of the Basic performance standard. The process was repeated to obtain Proficient and Advanced performance standards using papers classified as "6" and "7" and "9" and "10", respectively. Also, a non-linear regression line (cubic polynomial) was obtained to describe the relationship between paper scores and panelists' paper classifications. With the regression line, the expected scores of borderline Basic, Proficient, and Advanced can be obtained and used as the performance standards. Prior to fitting the regression lines, minor adjustments were made to the values assigned to the performance categories to approximate an equal-interval scale. These revised performance category values are as follows: 12
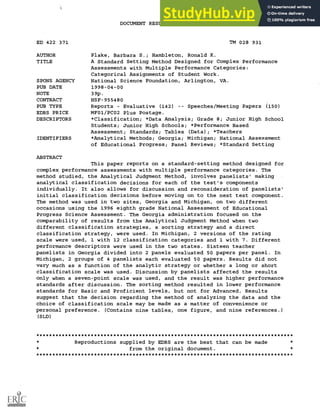
  • 13. Categorical Assignments Page 14 Performance Category Revised Value Below Basic Low: 0.5 Below Basic Medium: 2.0 Below Basic High: 3.5 Basic Low: 4.5 Basic Medium: 6.0 Basic High: 7.5 Proficient Low: 8.5 Proficient Medium: 10.0 Proficient High: 11.5 Advanced Low: 12.5 Advanced Medium: 14.0 Advanced High: 15.5 No adjustments were made to the scale values for the performance categories for the 7-point scale. Cubic polynomial regression models were fit to these data to predict scores by students whose papers were assigned to these categorical designations. For the 12 point scale, for example, predicted scores for the scale points of Basic (X = 4), Proficient (X=8), and Advanced (X=12) were used with these regression models to ascertain the performance standards for Section 1, 2, and 3 using the regression approach. Figure 1 provides an illustration of the cubic polynomial approach using the data from Section I. Then the section performance categories were summed to arrive at the total booklet performance standards. These two analytic strategies have different strengths and weaknesses. The Boundary Paper method has the strengths that it focuses exclusivelyon the scores of student papers that have been assigned to the most relevant categories 13
  • 14. Categorical Assignments Page 15 on the classification scale. Only student papers that the panelists feel are "borderline" are used in calculating performance standards. In addition, this approach is fairly straightforward, being both easy to calculate (simple averages are all that is needed) and to explain to policy makers and the public. The polynomial model fitting approach has appeal in that is uses all the available data, not sacrificing information that is present in the paper classification decisions for non-boundary categories. Further, especially when there are few papers assigned to relevant categories, it provides an approach that yields performance standards with less random error. However, the sophistication of the method most likely requires access to complex statistical software and a level of statistical training that might challenge some practitioners. It is definitely more difficult to explain cubic polynomial curve fitting to policy makers, parents, print media representatives, and the public than would be simple averages. Also, this procedure requires choices to be made in fitting mathematical expressions to the data. In this application, for example, based on visual inspection of the scatterplot of the relationship between panelists' classification decisions and student paper scores, a cubic polynomial model was adopted throughout. However, another strategy could be to fit increasingly higher level polynomials to the data from the sections comprising the assessment, choosing the one that shows the best fit to the data. This might mean endorsing a linear fit for data from one section, a quadratic for another, and a cubic fit for yet another section. Researchers might make different choices and hence arrive at different performance standards.. Data from the Georgia and Michigan studieswere used to address this question. The results of this comparison between the Boundary Paper Method and the Cubic Regression approach are presented in Table 1. For the Georgia study, Group A (sort student papers) and Group B (classify student papers) show 14
  • 15. Categorical Assignments Page 16 minimal differences in final performance standards for Basic, Proficient, and Advanced performance standards regardless of whether the data were analyzed using the Boundary Paper Method or using cubic polynomials. For Group A, the Boundary Paper Method resulting in performance standards of 20.85, 36.29, and 45.72 using the Boundary Paper approach and 20.58, 35.44, and 45.66 using the cubic polynomial method. For Group B, performance standards for Basic, Proficient, and Advanced were 27.54, 41.99, and 46.66 using the Boundary Paper Method and 27.72, 43.22, and 45.62 with the cubic polynomial approach. Similar results occurred with the data from the Michigan study. Group A's (12-point classification scale) Total performance standards for Basic, Proficient, and Advanced are as follows: 26.58, 42.14, 51.33. For Group B (7- point scale) these results are 26.95, 42.57, and 51.44 for Basic, Proficient, and Advanced, respectively. When using the model fitting approach, the performance standards for Group A were 26.20, 42.16, and 51.38 for Basic, Proficient, and Advanced. For Group B comparable results were 27.46, 42.74, and 51.39 As can be seen readily by comparison of the Boundary Paper results and the cubic polynomial regression analyses, there is very little difference in the final total performance standards regardless of which analytic method is used. Therefore the decision about whether to use the Boundary Paper approach or cubic polynomial models becomes one of convenience, sophistication, and degree of comfort with the underlying principles supporting each method. There may have been features of the study that minimized the differences observed between these two analytic strategies. Additional research is needed in comparing results using these two analytic approaches before a firmer conclusion about the comparability of results from these two approaches can be made. For example, 15
  • 16. Categorical Assignments Page 17 with a modest number of papers around two boundary categories, will the regression approach outperform the boundary paper method? Are classification decisions affected by the classification strategy (sorting versus direct classification)? Data to address this question was collected in the Georgia study. The two groups classified a total of 50 student papers, 10 of which were common across groups. The analysis will focus on the overall performance standards derived from the sort and the classify strategies and also on the ratings provided by the two groups on the common papers. Across the 12 classification categories, papers assigned by panelists in Group A showed a very strong trend as expected for higher scored papers to be classified into higher level categories. These results are summarized in Table 2. Boundary performance standards for the three sections were calculated to be 20.85 for Basic, 36.29 for Proficient, and 45.72 for Advanced. Nearly identical results were found using the polynomial model analytic method. Table 3 shows the assignments by panelists in Group B of the 50 papers to the 12 performance categories and the average of the scores of the student papers that were assigned to those categories. Again, there is a very strong trend shown for papers that were classified into higher performance categories to have earned higher scores. At the same time, very few papers were assigned by these panelists into the highest performance categories. PerforMance standards, calculated using the Boundary Paper method, for Basic, Proficient, and Advanced performance categories are as follows: 27.18, 41.47, and 46.62, respectively. Nearly equivalent results were obtained from the model fitting approach. 16
  • 17. Categorical Assignments Page 18 There appears to be a meaningful difference in the performance standards for Basic and Proficient depending on whether the sort or direct classification approach is used. In both cases, the classification approach resulted in substantially higher performance standards, and therefore more rigorous standards, for Basic and Proficient. Hardly any difference in performance standards were found for the Advanced performance category. These differences were present whether the analysis was completed using the Boundary Paper or model fitting approaches. It is interesting to note, however, that these differences appears to be smaller when looking at the results only for Section 1. Student papers from Section 1 were evaluated by 16 panelists, unlike the papers from Sections 2 or 3. These differences therefore may be due to the instability of results from using such small panel sizes for Sections 2 and 3. A comparison of performance standards across the two classification strategies is shown in Table 42. Common papers Panelists in Groups A and B each classified a total of 50 student papers, 10 of which were common across groups. One way to investigate the impact of the two classification strategies is to consider the classification decisions for these 10 papers across the two groups. These results are presented in Table 5. Altogether, 9 panelists in Group A and 8 panelists in Group B classified the same 10 papers. One panelists in Group B (panelists B6) appears to be an outlier, in that this panelist's classification decisions were often 1 standard deviation about the group's mean (and frequently as large as 2 standard deviations from the group's mean) on these common papers. This panelist's data was eliminated for the common group comparison. When panelist B22's data is discarded, the results from Group A and B across the common papers shows no discernible pattern. 17
  • 18. Categorical Assignments Page 19 Neither is one group's average classification, or the variability of their classification decisions, systematically larger or smaller across the 10 common papers. It is interesting to note that the classification decisions appear to align with actual paper scores as lower scoring papers were routinely classified by both groups in lower categories than were higher scored papers. Evaluation Panelists filled out an evaluation form that gathered their perception of the quality and adequacy of the training and preliminary activities in addition to their comfort and confidence in the standards derived from their classification ratings. Open ended questions solicited responses to questions about their classification strategies and special problems or concerns. Regardless of Group, all of the procedural components of the standard setting workshop (Orientation, Training, adequacy of the definitions of the performance categories) received ratings of "Successful" or "Adequate". When asked their level of confidence in the standard determined by the sorting method, 5 of the 8 of the panelists in Group A indicated high or very high levels of confidence for the Advanced and Proficient performance standards and 6 out of 8 indicated high or very high confidence for the Basic performance standard. Overall, the confidence of panelists in Group A that their method would produce a suitable set of standards for the performance level was indicated as mostly very confident or confident (6 of the 8 panelists). When posed these same questions, 3 out of the 7 panelists in Group B indicated high or very high levels of confidence for the Advanced performance standard, 6 of the 7 panelists rated their confidence in the Proficient performance standard as high or very high for the Proficient and Basic performance standards. Only 2 of the panelists expressed Confidence or High Confidence that the method would produce a suitable set of 18
  • 19. Categorical Assignments Page 20 standards for the performance levels. Therefore, based on panelists' perceptions alone, the panelists in Group A showed higher levels of confidence and endorsement in the results from the sorting approach than did the panelists in Group B who used the direct classification procedure for classifying the student papers. Do the performance standards differ as a function of number of classification categories (7 vs. 12)? Data from the Michigan study could be used to answer this question. As stated in the Methods section, panelists were divided into 2 groups of 4 panelists each. Group A used the same 12-point categorization system as was employed in the Georgia study while Group B used a 7-point version. The panelists considered the same 50 student papers, making classification decisions on the student papers for each of the 3 sections sequentially. Performance standards were derived using the Round 2 results both the boundary paper method and by the fit of a cubic regression to the data points. For each group, a total of 12 performance standards were calculated: Section 1, Section 2, Section 3, and Total for Basic, Proficient, and Advanced. The results are summarized in Table 6. Based on the boundary paper method (but comparable results were found also with the model fitting approach), Group A's (which used the 12-point classification scale) Total performance standards for Basic, Proficient, and Advanced are as follows: 26.58, 42.14, 51.33. For Group B (using the 7-point scale) these results are 26.95, 42.57, and 51.44 for Basic, Proficient, and Advanced, respectively. Clearly, the performance standards differed very little as a function of number of classification points on the rating scale. Had these results been rounded to the nearest integer, the performance 19
  • 20. Categorical Assignments Page 21 standard for Basic would have been 27 using both rating scales, 42 for Proficient using the 12 point scale and 43 using the 7 point scale, and 51 for Advanced by both. Both groups were administered an evaluation at the end of their classification tasks. Both groups reported being satisfied with the Orientation and Training aspects of the study. When asked if they had sufficient time to complete their Round 1 ratings, panelists in Group A, on average, felt there was less than adequate time whereas panelists in Group B reported the time was adequate for them to complete their ratings comfortably. Panelists were also asked to rate their level of confidence that the methods they used would results in appropriate performance standards. Again, Group A's results were slightly less positive than those of Group B (an average in Group A of 2.75 compared to an average of 3.0 on a 4 point scale). It took the group using the 12 point scale about an hour longer to complete their classification decisions for the three sections than it took the panelists using the 7-point scale. Using the 7 point scale, therefore, appears to be easier for the panelists to use in that it resulted in fewer papers to discuss and less time for the panelists to complete their classification decisions. The savings of an hour from the standard setting process could be important when budgeting for a standard setting workshop. Further, the savings wouldmost likely be even greater if the assessment consisted of many sections, rather than merelythree as was the case with the eighth grade NAEP science assessment used in this study. Also, there is the possibility of continuing with the same time frame and increasing the number of papers classified by panelists. The effect of having more papers classified would be to increase the stability of the resulting performance standards. 2 0
  • 21. Categorical Assignments Page 22 Are performance standards affected by panel discussion? Data from the Michigan study will be used to answer this question. Although the panelists were divided into 2 groups and these groups used different rating scales (that differed in the number of scale points, 7 and 12), both groups used discussion between their first and second ratings. Therefore, data from both groups can be used to address the question about the effect of discussion on the performance standards. Results from Groups A and B for Sections 1, 2, and 3, for Rounds 1 and 2 are presented in Table 7. Performance standards were derived for each group using their Round 1 data and their Round 2 data. These performance standards were set for each of the Sections separately and sequentially and then aggregated to yield the total performance standards for Basic, Proficient, and Advanced. These performance standards are reported for the boundary paper method only as the results are consistent when fitting a cubic polynomial to the data. When looking only at the Round 1 results from Group A (12 point rating scale), on the total scale, the performance standards for Basic, Proficient, and Advanced were calculated using the Boundary Paper method as follows: 26.78, 41.09, and 51.11 for Basic, Proficient, and Advanced performance standards. After discussion, these performance standards were 26.58, 42.14, and 51.33. For Group B (7 point rating scale), performance standards after Round 1 for Basic, Proficient, and Advanced were 28.13, 39.73, and 47.94 as compared to 26.95, 42.57, and 51.44 after discussion. Therefore, even though there did not appear to be a meaningful difference in the final performance standards for Basic, Proficient, and Advanced for Group A as a results of discussion, the performance standards that resulted from Group B changed a minimum of 2 score points as a 21
  • 22. Categorical Assignments Page 23 result of the discussion. In two instances, these performance standards increased from before to after discussion in Group B. Tables 8 and 9 provide a more in-depth look at the effect of discussion across these two groups by reporting the performance standards and standard deviations before and after discussion by section of the test. As expected the standard deviations are systematically lower (in 17 of the 18 comparisons) after discussion, but not markedly so. The magnitude of the reduction is almost always less the one scale point, regardless of whether the scale had 12 or 7 values. In looking at the individual panelists' changes in paper classifications before and after discussion, for-Group A (12-point scale) panelists maintained their round 1 assignment after discussion over 75% of the time; and made nearly the same percentage of higher as lower changes in paper classification. For Group B (7-point scale), the percentage of change were 20% to higher classifications, 12% to lower, and 68% no change. Therefore, these results indicate that the performance standards are affected by group discussion. Although, using Group A's results, it appears that little substantive differences were obtained through the discussion, the results from Group B showed a change in performance standards subsequentto discussion. Also of note is the fact that, for bothgroups, discussion resulted in consistently less variability in panelists' classification decisions and resultant performance standards. Reduced variability (and therefore increased stability) that resulted from group discussion is highly desirable. Therefore from the perspective of improved precision, discussion had a desirable impact on the stability of the final performance standards. We do not know if panelists' confidence in the performance standards were affected by discussion as we did not gather their confidence levels prior to discussion. However, in the open 22
  • 23. Categorical Assignments Page 24 ended comments provided by the panelists, several specifically mentioned the discussion as an important feature of the standard setting process. Discussion The purpose of this study was to investigate several aspects of the Analytic Judgment Method. Over two occasions in two different states, panelists used this method to establish performance standards for Basic, Proficient, and Advanced levels of performance on the 1996 eighth grade NAEP Science Assessment. These data allowed for an investigation of a) the comparability of the results across two analytical approaches (Boundary Paper and cubic polynomial regression), b) the effects of two different classification strategies (sorting and direct classification), c) the effects of a shortened classification system (12-point vs. 7-point), and d) the effects of discussion between rounds. All of these analyses were designed to provide information for further refinements of the Analytic Judgment Method. The results from the Analytdc Judgment Method did not vary much as a function of analytic strategy or whether a long or short classification scale was used. Discussion appeared to effect the results only when the 7-point scale was used and the effect was to obtain higher performance standards following discussion. The sorting method resulted in lower performance standards for Basic and Proficient levels, but not for Advanced. However, the new performance descriptors, coupled with a change in location, resulted in higher performance standards at the Advanced level only. Therefore, it appears that the decision regarding the method for analyzing the data and the choice of classification scale may be made as a matter of convenience or personal preference, rather than based on any empirical evidence supporting one choice over another. 23
  • 24. Categorical Assignments Page 25 Discussion appeared to have the desired effect of reducing variability in panelists' paper classification decisions, although we do not have direct evidence on whether their confidence in the final performance standards were necessarily increased due to discussion. The evidence on the effect of discussion on the magnitude of the final performance standards is mixed: in one case the performance standards were basically unchanged after discussion whereas there was a shift in performance standards (primarily toward higher standards for the Proficient and Advanced levels) in the other. Some have argued that the demand characteristics of setting "high and rigorous standards" may impel some panelists be more inclined, particularly in group settings, to promote higher levels of achievement for performance standards than they may have set individually. Group discussion may amplify these tendencies. This is an area where additional research would be particularly useful. There was some evidence of lower performance standards at the lower performance levels from using the sorting method. The task presented some administrative challenges for the panelists that made its continued use not desirable. When the panelists used the 12-point scale for the sorting task, the sheer volume of papers to sort, and the space requirements for being able to form and manipulate a total of 12 piles of papers for each panelists became fairly unworkable. It is yet to be seen whether this strategy would be more reasonable to achieve with the 7-point scale. Likewise, a variation on the sort strategy, using smaller numbers of papers to be considered at any time in the process, might yield a more feasible strategy. The ability for panelists to reconsider their classification decisions, to achieve more homogeneous paper classification decisions with category has appeal. Perhaps this individual reconsideration of classification decisions could replace discussion or enhance the utility of 24
  • 25. Categorical Assignments Page 26 discussion between rounds. More research is needed to investigate these possibilities. The results of the analyses need to be considered with caution as the sample sizes upon which they are based are small. Some of the differences noted may not be the results of the variables studied but instead the result of random error due to small sample sizes. Hopefully additional research will be conducted using more traditional sized panels for standard setting purposes (15 - 20). If that were the case, more confidence could be placed in the results. Also, replications showing similar results, even with small panels, would add credence to the results reported here. 25
  • 26. Categorical Assignments Page 27 References Angoff, W. H. (1971). Scales, norms, and equivalent scores. In R.L. Thorndike (Ed.), Educational measurement (2nd ed.). Washington, DC: American Council on Education. Hambleton, R.K., & Plake, B.S. (1995). Using an extended Angoff procedure to set standards on complex performance assessments. Applied Measurement in Education, 8(1), 41-55. Jaeger, R.M. & Mills, C.N. (1998, April). A performance-grounded procedure for setting performance standards on complex large-scale assessments. Paper presented at the annual meeting of the American Educational Research Association, San Diego. Livingston, S.A., & Zieky, M. J. (1982). Passing scores: A manual for setting standards for performance on educational and occupational tests. Princeton, NJ: Educational Testing Service. Mills, C.N., & Jaeger, R.M. (1998). Creating descriptions of desired student achievement when setting performance standards. In L. Hansche (Ed.), Handbook of standard setting. Washington, DC: Council of Chief State School Officers. Mills, C.N., Plake, B.S., Jaeger, R.M., & Hambleton, R.K. (1997, April). Comparison of two new standard setting approaches: Lessons learned. Paper presented at the meeting of AERA, Chicago. National Academy of Education. (1993). Setting performance standards for student achievement. Stanford, CA: Author. 2 6
  • 27. Categorical Assignments Page 28 Plake, B.S. (1996, December). Setting performance standards for professional licensure and certification. Commissioned paper presented at the National Academy of Sciences Invitational Conference on Standard Setting and NAEP, Washington, DC. Shepard, L.A. (1995, October). Implications for standard setting of the NAE evaluation of NAEP. Paper presented at the Joint Conference on Standard Setting for Large Scale Assessments, National Assessment Governing Board, National Center for Educational Statistics, Washington, DC. 27
  • 28. Categorical Assignments Page 29 Footnotes 1. Initially 9 panelists were assigned to Group B, 5 to subpanel B1 and 4 to subpanel B2. However, during the ratings of Section 1, one member of subpanel B2 became ill and had to leave without completing the ratings for Section 1. The panelists results were discarded. For Sections 2 and 3, one member of subpanel B1 was selected to become a member of subpanel B2, resulting in two subpanels of size 4 for ratings of Sections 2 and 3. 2. The results for the direct classification method differ in Tables 1 and 4 because the values in Table 1 are based on a total of 7 panelists due to the disqualification of an aberrant panelist's results. 28
  • 29. Categorical Assignments Page 30 Acknowledgments The authors would like to thank Linda Hansche, Georgia State University, for her help in recruiting the panelists for the Georgia study and for coordinating the logistics for that administration. Likewise, Diane Garavaglia from the Michigan Department of Education is thanked for her help with the Michigan administration. 29
  • 30. Categorical Assignments Page 31 Table 1. Comparison of Performance Standards using Boundary Paper and Cubic Polynomial Analytical Approaches Perf Standard Group Boundary Paper A1 Cubic Polynomial Group Boundary Paper B Cubic Polynomial Georgia Basic 20.85 20.58 27.54 27.72 Prof 36.29 35.44 41.99 43.22 Advanced 45.72 45.66 46.66 45.62 Michigan Basic 26.58 26.20 26.95 27.46 Prof 42.14 42.16 42.57 42.74 Advanced 51.33 51.38 51.44 51.39 1 In Georgia, Group A used the sorting strategy and Group B used the classification strategy. In Michigan, Group A used a 12-point rating scale and Group B used a 7-point rating scale; both groups used the classification strategy. 30
  • 31. Categorical Assignments Page 33 le 3. Assianment of student papers to performance crories by panelists, Group B (classifyina papers); raia study Section A2-1 1 A2-2 Section 2 Section 3 formance eaorv 50 9 10 55 Mean 4.56 3.00 3.60 4.33 45 7 22 33 Mean 7.40 6.29 4.32 6.17 18 11 11 28 Mean 7.50 6.27 5.27 8.93 16 23 34 27 Mean 11.11 8.35 10.38 10.10 29 16 45 21 Mean 12.10 11.06 11.51 12.80 38 6 34 15 ,Mean 15.10 12.00 12.50 14.10 30 8 12 8 Mean 17.30 12.75 13.50 14.80 16 7 11 8 Mean 17.20 13.29 13.73 16.40 6 9 14 5 Mean 18.30 12.22 13.64 16.60 1 27 5 0 Mean 21.00 12.96 14.00 0 26 2 0 Mean 15.23 16.50 0 1 0 0 Mean 9.00 31
  • 32. Categorical Assignments Page 34 Table 4, Performance standards for Basic, Proficient, Advanced by classification strategies; 2 panels for Section 1, 1 panel for Sections 2 & 3; Georgia study. Advanced Group A Section (sorting papers) Panel n Basic Proficient 1 5 8.05 12.77 17.00 1 3 8.79 13.62 17.92 SECT 1 (combined) 8.42 13.19 17.46 2 4 5.89 12.16 14.08 3 4 6.54 10.94 14.18 TOTAL 20..85 36.29 45.72 Group B Section (classifying papers) Panel n Basic Proficient Advanced 1 5 9.18 16.17 18.38 1 3 7.68 12.00 12.78 SECT 1 (combined) 8.62 14.61 16.28 2 4 9.04 12.76 13.74 3 4 9.52 14.30 16.60 TOTAL 27.18 41.67 46.62 3 2
  • 33. Categorical Assignments Page 35 Table 5. Groups A & B classifications of the 10 common Section 1 papers;_ Georgia study. Student paper 1 2 3 4 4 6 7 8 9 10 Group A A111-1 1 4 8 2 9 8 9 9 8 Al2 1 1 4 8 1 7 4 8 9 8 A13 1 1 5 7 4 7 7 8 7 7 A14 1 1 2 7 3 6 6 7 10 8 A15 1 1 4 7 4 5 6 6 9 9 A21 1 1 2 7 3 6 6 5 7 8 A22 4 1 5 7 4 6 6 8 9 10 A23 1 1 1 7 6 2 2 7 8 8 A24 1 1 1 7 2 4 4 6 8 6 MEAN SD GROUP B 1.33 1.00 1.00 0.00 3.11 1.62 7.22 0.44 3.22 1.48 5.78 1.99 5.44 1.81 7.11 1.27 8.44 1.01 8.00 1.12 B11 1 1 2 6 2 5 5 6 6 6 B12 2 1 2 5 2 6 2 6 7 6 B13 1 1 3 6 2 5 6 7 8 6 B14 1 1 2 7 3 5 5 6 6 7 B21 1 1 6 2 2 2 4 5 6 322 2 4 8 10 10 10 10 11 11 11 B23 1 2 4 8 5 5 7 10 10 8 324 1 1 1 5 3 5 4 7 9 6 MEAN SD 1.63 1.50 2.88 6.63 3.63 5.00 5.13 7.13 7.75 7.00 1.06 1.07 2.30 1.69 2.77 2.33 2.64 2.30 2.12 1.77 Results without panelist B22 MEAN SD 1.57 1.14 2.14 6.14 2.71 4.29 4.43 6.57 7.29 6.42 1.13 0.38 1.07 1.07 1.11 1.25 1.90 1.81 1.80 0.79 PAPER SCORE2.2 2 5 12 7 12 12 15 17 16 1. Group, subpanel, panelist # 2. Maximum possible score = 24 33
  • 34. Categorical Assignments Page 36 Table 6, Comparability of total performance standards for the 12-point and 7-point rating scale usina_ the Boundary Paper Methods Michiaan study Performance Standard Rating scale 12 point 7 point Basic 26.58 26.95 Proficient 42.14 42.57 Advanced 51.33 51.44 3 4
  • 35. Categorical Assignments Page 37 Table 7. Comparability of performance standards from Rounds 1 and 2: Effect of discussion Group A Group B Round 1 Round 2 Round 1 Round 2 Basic 26.78 26.58 28.13 26.95 Prof 41.09 42.14 39.73 42.57 Advanced 51.11 51.33 47.94 51.44 35
  • 36. Categorical Assignments Page 38 Table 8. Effect of discussion on panelists' variability on performance standards by test section for Group A usina the 12-point scale Basic Round 1 (Before Discussion) Performance Standards Proficient Advanced Mean SD Mean SD Mean SD Section 1 10.68 3.30 15.33 2.87 18.67 1.03 2 9.49 2.22 12.88 2.17 15.50 0.97 3 6.61 2.50 12.88 3.45 16.94 1.30 Basic Round 2 (After Discussion) Performance Standards Proficient Advanced Mean SD Mean SD Mean SD Section 1 10.27 2.62 15.63 2.34 19.00 0.63 2 9.48 2.04 12.76 2.05 15.33 0.89 3 6.83 2.32 13.53 2.14 17.00 1.20
  • 37. Categorical Assignments Page 39 Table 9. Effect of discussion on panelists' variability on performance standards by test section for Group B usina the 7-point scale Basic Round 1 (Before Discussion) Performance Standards Proficient Advanced Mean SD Mean SD Mean SD Section 1 9.73 3.87 15.06 3.08 17.43 1.74 2 10.19 2.48 12.82 2.39 14.80 1.69 3 7.72 2.62 12.19 3.66 16.14 1.62 Basic Round 2 (After Discussion) Performance Standards Proficient Advanced Mean SD Mean SD Mean SD Section 1 9.36 3.76 15.62 2.86 20.00 0.00 2 9.83 2.37 13.59 2.10 15.00 2.00 3 7.59 2.21 13.36 1.65 16.44 1.39 3 7
  • 38. 4. 22 - 20 - 18 - 16 - 14 - 12 - 10 - 8 -* 6 - 4 - 0 2 - R 0 0 0 11 0 -o 0 0 0 0 0 0 0 cr 0 0 0 0 0 0 0 0 0 0 0.5 2 3.5 4.5 6 7.5 8.5 10 11.5 12.5 14 15.5 Paper Classification Category Figure 1. Example of cubic polynominal regression approach using data from Section I. 3 3 3 9
  • 39. U.S. Department of Education Office of Educational Research and Improvement (0ERI) National Library of Education (NLE) Educational Resources Information Center (ERIC) REPRODUCTION RELEASE (Specific Document) I. DOCUMENT IDENTIFICATION: ERIC TM028931 Title: A 54A01-aird. P1-44-1-n=c_ Mit -rk.kr "I=Lesiv144- Cm+b-icj'ar-P-frr rivut-ut_ lifsess fas i Qt. lks)ptev2u-b U4L 100-144,. Author(s): Pak, Rtniut.L.C, r . Corporate Source: Publication Date: II. REPRODUCTION RELEASE: In order to disseminate as widely as possible timely and significant materials of interest to the educational community, documents announced in the monthly abstract journal of the ERIC system, Resources in Education (RIE), are usually made available to users in microfiche, reproduced paper copy, and electronic media, and sold through the ERIC Document Reproduction Service (EDRS). Credit is given to the source of each document, and, if reproduction release is granted, one of the following notices is affixed to the document. If permission is granted to reproduce and disseminate the identified document, please CHECK ONE of the following three options and sign at the bottom of the page. The sample sticker shown below will be affixed to all Level 1 documents 1 PERMISSION TO REPRODUCE AND DISSEMINATE THIS MATERIAL HAS BEEN GRANTED BY 0e TO THE EDUCATIONAL RESOURCES INFORMATION CENTER (ERIC) Check here for Level 1 release, permitting reproduction and dissemination in microfiche or other ERIC archival media (e.g., electronic) and paper copy. The sample sticker shown below will be affixed to all Level 2A documents PERMISSION TO'REPRODUCE AND DISSEMINATE THIS MATERIAL IN MICROFICHE, AND IN ELECTRONIC MEDIA FOR ERIC COLLECTION SUBSCRIBERS ONLY, HAS BEEN GRANTED BY 2A fe'0 TO THE EDUCATIONAL RESOURCES INFORMATION CENTER (ERIC) Level 2A Check here for Level 2A release, permitting reproduction and dissemination In microfiche and In electronic media for ERIC archival collection subscribers only The sample sticker shown below will be affixed to ell Level 28 documents PERMISSION TO REPRODUCE AND DISSEMINATE THIS MATERIAL IN MICROFICHE ONLy HAS BEEN GRANTED BY 2B TO THE EDUCATIONAL RESOURCES INFORMATION CENTER (ERIC) Level 2B Check here for Level 28 release, permitting reproduction and disseminefion in microfiche only Documents will be processed as indicated provided reproduction quality permits. If permission to reproduce is granted, but no box is checked, documents will be processed at Level 1. I hereby grant to the Educational Resources Information Center (ERIC) nonexclusive permission to reprpduce and disseminate this document as indicated above. Reproductidn from the ERIC microfiche or electronic media by persons other than ERIC employees and its system contractors requires permission tram the copyright holder. Exception is made for non-profit reproduction by libraries and other service agencies to satisfy information needs of educators in response to discrete inquiries. Sign here,-) please Signature: Printed Name/Position/Title: rganization/Address: yukfac_ae_el- Iteirr:q., 2.fo nt0A4/72-- 6207 Etaildr: Date: L (over) Buros Institute 135 Bancroft Hall I: University of Nebraska Lincoln, NE 6858840*A
  • 40. III. DOCUMENT AVAILABILITY INFORMATION (FROM NON-ERIC SOURCE): If permission to reproduce is not granted to ERIC, or, if you wish ERIC to cite the availability of the document from another source, please provide the following information regarding the availability of the document. (ERIC will not announce a document unless it is publicly available, and a dependable source can be specified. Contributors should also be aware that ERIC selection criteria are significantly more stringent for documents that cannot be made available through EDRS.) Publisher/Distributor: Address: Price: IV. REFERRAL OF ERIC TO COPYRIGHT/REPRODUCTION RIGHTS HOLDER: If the right to grant this reproduction release is held by someone other than the addressee, please provide the appropriate name and address: Name: Address: V. WHERE TO SEND THIS FORM: Send this form to the following ERIC Clearinghouse: THE UNIVERSITY OF MARYLAND ERIC CLEARINGHOUSE ON ASSESSMENT AND EVALUATION 1129 SHRIVER LAB, CAMPUS DRIVE COLLEGE PARK, MD 20742-5701 Attn: Acquisitions However, if solicited by the ERIC Facility, or if making an unsolicited contribution to ERIC, return this form (and the document being contributed) to: ERIC Processing and Reference Facility 1100 West Street, 2nd Floor Laurel, Maryland 20707-3598 Telephone: 301-497-4080 Toll Free: 800-799-3742 FAX: 301-953-0263 e-mail: ericfac@inet.ed.gov WWW: http://ericfac.piccard.csc.com EFF-088 (Rev. 9/97) PREVIOUS VERSIONS OF THIS FORM ARE OBSOLETE.