March 2023 Market Watch
•
0 likes•14 views

Check out the latest TRREB Market Watch for March 2023.

Recommended
Recommended
More Related Content
Similar to March 2023 Market Watch
Similar to March 2023 Market Watch (20)
More from Michelle Makos
More from Michelle Makos (20)
Recently uploaded
Recently uploaded (20)
March 2023 Market Watch
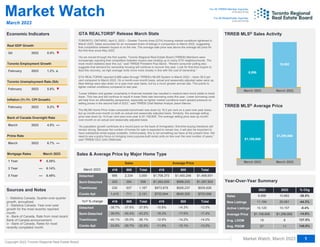
- 1. Sources and Notes i - Statistics Canada, Quarter-over-quarter growth, annualized. ii - Statistics Canada, Year-over-year growth for the most recently reported month. iii - Bank of Canada, Rate from most recent Bank of Canada announcement. iv - Bank of Canada, Rates for most recently completed month. % Chg Inflation (Yr./Yr. CPI Growth) Toronto Employment Growth 1 Year 3 Year 5 Year ½ 6.29% 6.14% 6.49% Real GDP Growth 416 905 Total Detached Semi-Detached Townhouse Condo Apt -33.8% -40.1% -39.0% -38.7% -29.7% -35.0% -45.4% -37.6% Market Watch, March 2023 TRREB MLS Sales Activity March 2023 March 2022 $1,298,666 $1,108,606 TRREB MLS Average Price 2023 2022 Sales New Listings Active Listings Average Price Avg. LDOM Avg. PDOM 11 8 $1,298,666 0 0 10,862 27 19 $1,108,606 1 3,722 6,896 Market Watch For All TRREB Member Inquiries: 416-443-8152 nk For All Media/Public Inquiries: 416-443-8158 Copyright 2023 Toronto Regional Real Estate Board March 2023 Economic Indicators ® 145.5% 137.5% -14.6% -36.5% -36.5% -36.5% Year-Over-Year Summary March 2023 March 2022 10,862 6,896 20,061 11,184 -44.3% 10,157 10,120 GTA REALTORS Release March Stats TORONTO, ONTARIO, April 5, 2023 – Greater Toronto Area (GTA) housing market conditions tightened in March 2023. Sales accounted for an increased share of listings in comparison to March 2022, suggesting that competition between buyers is on the rise. The average sale price was above the average list price for the first time since May 2022. “As we moved through the first quarter, Toronto Regional Real Estate Board (TRREB) Members were increasingly reporting that competition between buyers was heating up in many GTA neighbourhoods. The most recent statistics bear this out,” said TRREB President Paul Baron. “Recent consumer polling also suggests that demand for ownership housing will continue to recover this year. Look for first-time buyers to lead this recovery, as high average rents move more closely in line with the cost of ownership.” GTA REALTORS® reported 6,896 sales through TRREB’s MLS® System in March 2023 – down 36.5 per cent compared to March 2022. On a month-over-month basis, actual and seasonally adjusted sales were up. New listings were also down on a year-over-year basis, but by a much greater annual rate. This points to tighter market conditions compared to last year. “Lower inflation and greater uncertainty in financial markets has resulted in medium-term bond yields to trend lower. This has and will continue to result in lower fixed rate borrowing costs this year. Lower borrowing costs will help from an affordability perspective, especially as tighter market conditions exert upward pressure on selling prices in the second half of 2023,” said TRREB Chief Market Analyst Jason Mercer. The MLS® Home Price Index composite benchmark was down by 16.2 per cent on a year-over-year basis, but up month-over-month on both an actual and seasonally adjusted basis. Similarly, the average selling price was down by 14.6 per cent year-over-year to $1,108,606. The average selling price was up month- over-month on an actual and seasonally adjusted basis. “As population growth continues at a record pace on the back of immigration, first-time buying intentions will remain strong. Because the number of homes for sale is expected to remain low, it will also be important to have substantial rental supply available. Unfortunately, this is not something we have at the present time. We need to see a policy focus on bringing more purpose-built rental units on line over the next number of years,” said TRREB CEO John DiMichele. ® Sales & Average Price by Major Home Type 416 905 Total Detached Semi-Detached Townhouse Condo Apt 2,121 1,167 556 3,000 711 937 354 2,334 1,410 230 202 666 416 905 Total $703,566 $935,626 $1,087,924 $1,468,651 $645,305 $926,237 $988,233 $1,400,246 $732,944 $973,878 $1,262,629 $1,708,373 Sales Average Price YoY % change March 2023 416 905 Total -11.9% -12.9% -18.3% -10.8% -15.1% -14.2% -17.6% -14.3% Q4 2022 0.0% ½ February 2023 1.2% · February 2023 5.8% ½ Toronto Unemployment Rate (SA) February 2023 5.2% ½ March 2023 4.5% Bank of Canada Overnight Rate March 2023 6.7% Prime Rate Mortgage Rates March 2023 -0.4% ® 1 -32.5% -36.1% -43.2% -37.8% -13.0% -14.0% -17.4% -13.5%
- 2. Market Watch, March 2023 Toronto Regional Real Estate Board SALES BY PRICE RANGE AND HOUSE TYPE March 2023 Copyright 2023 Toronto Regional Real Estate Board 2 Year-to-Date 2023 Detached Semi-Detached Att/Row/Townhouse Condo Townhouse Condo Apartment Link Co-Op Apartment Detached Condo Co-Ownership Apt Total $0 to $99,999 $100,000 to $199,999 $200,000 to $299,999 $300,000 to $399,999 $400,000 to $499,999 $500,000 to $599,999 $600,000 to $699,999 $700,000 to $799,999 $800,000 to $899,999 $900,000 to $999,999 $1,000,000 to $1,249,999 $1,250,000 to $1,499,999 $1,500,000 to $1,749,999 $1,750,000 to $1,999,999 $2,000,000+ 931 488 925 1,732 2,401 1,584 1,434 1,532 1,661 1,530 440 69 22 0 1 0 0 0 0 0 0 0 0 0 3 3 3 1 0 0 0 0 0 3 4 0 1 5 2 0 0 0 0 0 0 0 0 0 0 0 0 0 2 2 1 1 8 1 0 0 0 1 3 19 21 9 8 6 3 2 0 0 0 0 0 44 20 35 63 162 204 344 642 1,196 1,359 387 46 16 0 1 1 6 10 31 69 110 190 351 223 92 23 0 0 0 0 15 11 36 170 343 350 241 156 46 4 1 1 0 0 0 22 20 50 126 365 289 178 89 48 5 1 0 0 0 0 849 430 791 1,320 1,437 622 472 281 141 64 24 11 4 0 0 Total Sales Share of Total Sales (%) Average Price $1,089,819 100.0% 14,750 $422,351 0.1% 10 $959,697 0.1% 15 $462,526 0.1% 15 $1,090,309 0.5% 72 $700,566 30.6% 4,519 $796,556 7.5% 1,106 $1,029,843 9.3% 1,374 $1,068,201 8.1% 1,193 $1,432,601 43.7% 6,446 Detached Semi-Detached Att/Row/Townhouse Condo Townhouse Condo Apartment Link Co-Op Apartment Detached Condo Co-Ownership Apt Total $0 to $99,999 $100,000 to $199,999 $200,000 to $299,999 $300,000 to $399,999 $400,000 to $499,999 $500,000 to $599,999 $600,000 to $699,999 $700,000 to $799,999 $800,000 to $899,999 $900,000 to $999,999 $1,000,000 to $1,249,999 $1,250,000 to $1,499,999 $1,500,000 to $1,749,999 $1,750,000 to $1,999,999 $2,000,000+ 447 248 460 879 1,160 705 643 716 732 679 187 31 9 0 0 0 0 0 0 0 0 0 0 0 1 0 1 0 0 0 0 0 0 1 3 0 1 1 2 0 0 0 0 0 0 0 0 0 0 0 0 0 1 1 0 1 4 1 0 0 0 1 3 8 9 5 4 2 2 0 0 0 0 0 0 19 6 15 31 84 98 180 329 554 613 165 21 6 0 0 1 4 5 15 32 66 100 167 86 40 11 0 0 0 0 4 6 16 88 181 149 109 63 22 1 0 1 0 0 0 9 7 27 71 190 135 66 37 12 1 1 0 0 0 0 414 224 394 665 661 252 183 116 53 23 9 4 2 0 0 Total Sales Share of Total Sales (%) Average Price $1,108,606 100.0% 6,896 $411,000 0.0% 2 $951,431 0.1% 8 $428,813 0.1% 8 $1,120,760 0.5% 34 $703,566 30.8% 2,121 $813,036 7.6% 527 $1,036,571 9.3% 640 $1,087,924 8.1% 556 $1,468,651 43.5% 3,000 SALES BY PRICE RANGE AND HOUSE TYPE
- 3. Sales Dollar Volume Average Price Median Price New Listings SNLR Trend Active Listings Mos Inv (Trend) Avg. SP/LP Avg. LDOM Avg. PDOM Abc Abc Abc Abc Abc Abc Abc Abc Abc Abc Abc Abc Abc Abc Abc Abc Abc Abc Abc Abc Abc Abc Abc Abc Abc Abc Abc Abc Abc Abc Abc Abc Abc Abc Abc Abc Abc Abc Abc Abc Abc All TRREB Areas Halton Region Burlington Halton Hills Milton Oakville Peel Region Brampton Caledon Mississauga City of Toronto Toronto West Toronto Central Toronto East York Region Aurora East Gwillimbury Georgina King Markham Newmarket Richmond Hill Vaughan Stouffville Durham Region Ajax Brock Clarington Oshawa Pickering Scugog Uxbridge Whitby Dufferin County Orangeville Simcoe County Adjala-Tosorontio Bradford Essa Innisfil New Tecumseth 6,896 731 731 239 68 146 146 278 1,281 604 604 89 588 2,521 2,521 655 1,266 600 600 1,248 91 49 49 62 21 311 311 118 200 200 327 327 69 864 864 134 134 19 137 137 250 250 118 18 18 25 25 163 30 30 30 30 221 11 11 52 52 23 67 67 68 $7,644,945,803 $926,641,693 $926,641,693 $248,640,284 $75,744,299 $165,448,632 $165,448,632 $436,808,478 $1,349,838,793 $622,504,928 $622,504,928 $117,840,461 $609,493,404 $2,658,553,448 $2,658,553,448 $644,550,045 $1,414,607,490 $599,395,913 $599,395,913 $1,677,949,469 $132,158,876 $67,896,100 $67,896,100 $65,075,400 $40,433,388 $410,380,632 $410,380,632 $141,621,048 $289,830,829 $289,830,829 $438,492,265 $438,492,265 $92,060,931 $800,186,267 $800,186,267 $133,464,171 $133,464,171 $14,026,150 $114,857,053 $114,857,053 $203,436,809 $203,436,809 $118,020,469 $15,973,250 $15,973,250 $33,244,500 $33,244,500 $167,163,865 $23,292,500 $23,292,500 $23,292,500 $23,292,500 $208,483,633 $11,224,788 $11,224,788 $57,524,068 $57,524,068 $18,021,077 $63,719,200 $63,719,200 $57,994,500 $1,108,606 $1,267,636 $1,267,636 $1,040,336 $1,113,887 $1,133,210 $1,133,210 $1,571,254 $1,053,738 $1,030,637 $1,030,637 $1,324,050 $1,036,553 $1,054,563 $1,054,563 $984,046 $1,117,383 $998,993 $998,993 $1,344,511 $1,452,295 $1,385,635 $1,385,635 $1,049,603 $1,925,399 $1,319,552 $1,319,552 $1,200,178 $1,449,154 $1,449,154 $1,340,955 $1,340,955 $1,334,216 $926,142 $926,142 $996,001 $996,001 $738,218 $838,373 $838,373 $813,747 $813,747 $1,000,173 $887,403 $887,403 $1,329,780 $1,329,780 $1,025,545 $776,417 $776,417 $776,417 $776,417 $943,365 $1,020,435 $1,020,435 $1,106,232 $1,106,232 $783,525 $951,033 $951,033 $852,860 $965,000 $1,101,000 $1,101,000 $945,000 $1,000,000 $1,060,500 $1,060,500 $1,391,500 $971,000 $974,750 $974,750 $1,280,000 $916,000 $850,000 $850,000 $900,000 $785,188 $975,000 $975,000 $1,260,000 $1,425,000 $1,410,000 $1,410,000 $877,500 $1,625,000 $1,280,000 $1,280,000 $1,145,000 $1,320,400 $1,320,400 $1,238,880 $1,238,880 $1,256,000 $875,000 $875,000 $937,750 $937,750 $680,000 $810,000 $810,000 $775,000 $775,000 $972,500 $922,625 $922,625 $1,320,000 $1,320,000 $975,000 $752,500 $752,500 $752,500 $752,500 $890,000 $995,900 $995,900 $1,125,000 $1,125,000 $740,000 $875,000 $875,000 $809,500 11,184 1,089 1,089 338 112 213 213 426 1,960 817 817 157 986 4,318 4,318 1,089 2,279 950 950 2,026 128 93 93 116 69 462 462 151 353 353 528 528 126 1,299 1,299 186 186 30 225 225 374 374 160 28 28 43 43 253 65 65 65 65 427 19 19 75 75 59 161 161 113 46.7% 48.7% 48.7% 51.6% 44.6% 50.2% 50.2% 46.4% 44.5% 45.1% 45.1% 36.3% 45.1% 46.0% 46.0% 47.0% 43.2% 51.1% 51.1% 46.8% 51.3% 42.1% 42.1% 42.7% 31.6% 53.2% 53.2% 55.9% 45.2% 45.2% 42.8% 42.8% 45.9% 53.0% 53.0% 54.1% 54.1% 39.8% 55.2% 55.2% 53.1% 53.1% 51.4% 51.8% 51.8% 50.3% 50.3% 53.5% 51.2% 51.2% 51.2% 51.2% 37.7% 34.2% 34.2% 42.4% 42.4% 42.9% 31.7% 31.7% 40.8% 10,120 997 997 332 111 147 147 407 1,621 594 594 169 858 4,292 4,292 1,087 2,498 707 707 1,790 92 90 90 114 103 341 341 93 348 348 493 493 116 852 852 92 92 33 155 155 234 234 106 34 34 41 41 157 63 63 63 63 505 34 34 71 71 65 218 218 117 2.3 2.2 2.2 2.1 2.4 1.8 1.8 2.5 2.3 2.1 2.1 3.7 2.4 2.5 2.5 2.5 2.9 1.8 1.8 2.4 2.1 2.9 2.9 2.7 5.3 1.9 1.9 1.6 2.7 2.7 2.7 2.7 2.7 1.5 1.5 1.3 1.3 3.5 1.4 1.4 1.4 1.4 1.7 2.2 2.2 2.1 2.1 1.3 2.2 2.2 2.2 2.2 3.4 5.0 5.0 2.5 2.5 2.7 4.3 4.3 3.1 101% 99% 99% 99% 98% 100% 100% 100% 100% 100% 100% 97% 100% 101% 101% 100% 100% 107% 107% 103% 101% 102% 102% 99% 96% 108% 108% 103% 105% 105% 100% 100% 101% 103% 103% 105% 105% 95% 104% 104% 105% 105% 102% 98% 98% 99% 99% 103% 98% 98% 98% 98% 98% 96% 96% 101% 101% 98% 98% 98% 98% 19 19 19 24 20 17 17 17 19 18 18 28 17 20 20 23 21 15 15 18 12 26 26 23 30 16 16 16 18 18 21 21 17 14 14 10 10 27 16 16 14 14 13 38 38 18 18 10 17 17 17 17 24 38 38 16 16 25 30 30 22 27 29 29 33 34 24 24 26 28 28 28 43 26 29 29 33 31 21 21 25 19 33 33 30 42 20 20 23 26 26 30 30 24 20 20 15 15 47 21 21 22 22 18 56 56 29 29 15 32 32 32 32 34 38 38 27 27 34 44 44 28 Toronto Regional Real Estate Board SUMMARY OF EXISTING HOME TRANSACTIONS All Home Types, March 2023 Market Watch, March 2023 Copyright 2023 Toronto Regional Real Estate Board 3 ALL TRREB AREAS
- 4. Sales Dollar Volume Average Price Median Price New Listings SNLR Trend Active Listings Mos Inv (Trend) Avg. SP/LP Avg. LDOM Avg. PDOM Abc Abc Abc Abc Abc Abc Abc Abc Abc Abc Abc Abc Abc Abc Abc Abc Abc Abc Abc Abc Abc Abc Abc Abc Abc Abc Abc Abc Abc Abc Abc Abc Abc Abc Abc Abc Abc Abc Abc Abc All TRREB Areas All TRREB Areas City of Toronto City of Toronto Toronto West Toronto W01 Toronto W02 Toronto W02 Toronto W03 Toronto W03 Toronto W04 Toronto W05 Toronto W06 Toronto W06 Toronto W07 Toronto W07 Toronto W08 Toronto W09 Toronto W10 Toronto W10 Toronto Central Toronto Central Toronto C01 Toronto C02 Toronto C03 Toronto C03 Toronto C04 Toronto C04 Toronto C06 Toronto C07 Toronto C08 Toronto C08 Toronto C09 Toronto C09 Toronto C10 Toronto C11 Toronto C12 Toronto C12 Toronto C13 Toronto C13 Toronto C14 Toronto C15 Toronto East Toronto East Toronto E01 Toronto E01 Toronto E02 Toronto E03 Toronto E04 Toronto E04 Toronto E05 Toronto E05 Toronto E06 Toronto E07 Toronto E08 Toronto E08 Toronto E09 Toronto E09 Toronto E10 Toronto E11 6,896 6,896 2,521 2,521 655 38 60 60 38 38 60 104 121 121 24 24 131 31 48 48 1,266 1,266 379 58 40 40 59 59 25 83 193 193 19 19 75 25 23 23 56 56 112 119 600 600 58 58 47 75 65 65 64 64 31 63 40 40 74 74 40 43 $7,644,945,803 $7,644,945,803 $2,658,553,448 $2,658,553,448 $644,550,045 $45,873,400 $70,269,996 $70,269,996 $41,557,816 $41,557,816 $52,210,318 $85,467,913 $110,163,711 $110,163,711 $38,002,499 $38,002,499 $127,066,012 $35,475,600 $38,462,780 $38,462,780 $1,414,607,490 $1,414,607,490 $316,021,869 $87,489,871 $51,970,730 $51,970,730 $136,343,220 $136,343,220 $29,098,918 $93,635,238 $161,803,528 $161,803,528 $32,797,000 $32,797,000 $81,628,398 $29,590,100 $83,636,000 $83,636,000 $60,708,557 $60,708,557 $122,087,954 $127,796,107 $599,395,913 $599,395,913 $68,700,432 $68,700,432 $63,471,541 $89,501,448 $54,596,500 $54,596,500 $56,373,188 $56,373,188 $31,583,387 $56,017,864 $40,843,110 $40,843,110 $60,862,981 $60,862,981 $40,079,400 $37,366,062 $1,108,606 $1,108,606 $1,054,563 $1,054,563 $984,046 $1,207,195 $1,171,167 $1,171,167 $1,093,627 $1,093,627 $870,172 $821,807 $910,444 $910,444 $1,583,437 $1,583,437 $969,970 $1,144,374 $801,308 $801,308 $1,117,383 $1,117,383 $833,831 $1,508,446 $1,299,268 $1,299,268 $2,310,902 $2,310,902 $1,163,957 $1,128,135 $838,360 $838,360 $1,726,158 $1,726,158 $1,088,379 $1,183,604 $3,636,348 $3,636,348 $1,084,081 $1,084,081 $1,090,071 $1,073,917 $998,993 $998,993 $1,184,490 $1,184,490 $1,350,458 $1,193,353 $839,946 $839,946 $880,831 $880,831 $1,018,819 $889,172 $1,021,078 $1,021,078 $822,473 $822,473 $1,001,985 $868,978 $965,000 $965,000 $850,000 $850,000 $900,000 $1,142,950 $1,103,500 $1,103,500 $1,076,750 $1,076,750 $860,259 $879,500 $808,000 $808,000 $1,422,000 $1,422,000 $720,000 $1,105,000 $850,000 $850,000 $785,188 $785,188 $728,000 $1,230,000 $1,132,750 $1,132,750 $2,040,000 $2,040,000 $729,000 $769,000 $706,000 $706,000 $1,117,000 $1,117,000 $821,000 $620,000 $2,150,000 $2,150,000 $805,504 $805,504 $787,500 $778,500 $975,000 $975,000 $1,089,250 $1,089,250 $1,250,000 $1,110,000 $763,000 $763,000 $755,000 $755,000 $999,999 $847,000 $840,000 $840,000 $702,500 $702,500 $1,052,500 $865,000 11,184 11,184 4,318 4,318 1,089 70 94 94 85 85 110 157 188 188 43 43 216 41 85 85 2,279 2,279 661 146 83 83 116 116 57 134 389 389 33 33 126 49 57 57 90 90 156 182 950 950 90 90 73 114 92 92 109 109 56 88 76 76 87 87 85 80 46.7% 46.7% 46.0% 46.0% 47.0% 49.0% 50.8% 50.8% 46.0% 46.0% 46.6% 48.0% 44.2% 44.2% 53.3% 53.3% 47.6% 48.6% 42.5% 42.5% 43.2% 43.2% 42.9% 39.4% 42.0% 42.0% 47.0% 47.0% 40.4% 44.9% 38.7% 38.7% 51.9% 51.9% 44.6% 45.6% 34.3% 34.3% 48.0% 48.0% 45.7% 48.5% 51.1% 51.1% 53.3% 53.3% 52.0% 51.0% 52.8% 52.8% 52.6% 52.6% 47.3% 50.8% 47.5% 47.5% 51.6% 51.6% 48.7% 51.1% 10,120 10,120 4,292 4,292 1,087 81 86 86 66 66 131 153 185 185 36 36 218 44 87 87 2,498 2,498 751 192 84 84 122 122 65 143 442 442 38 38 129 49 88 88 81 81 150 164 707 707 55 55 64 75 75 75 82 82 44 70 72 72 48 48 66 56 2.3 2.3 2.5 2.5 2.5 2.1 1.8 1.8 2.4 2.4 2.6 2.7 2.7 2.7 1.8 1.8 2.4 2.4 3.0 3.0 2.9 2.9 3.0 3.6 2.9 2.9 2.3 2.3 3.0 2.8 3.3 3.3 2.3 2.3 2.6 2.4 6.0 6.0 2.4 2.4 2.9 2.4 1.8 1.8 1.4 1.4 1.5 1.6 1.7 1.7 1.8 1.8 2.0 2.1 2.3 2.3 1.8 1.8 1.9 1.9 101% 101% 101% 101% 100% 102% 101% 101% 102% 102% 100% 99% 101% 101% 102% 102% 99% 98% 100% 100% 100% 100% 100% 98% 100% 100% 99% 99% 99% 99% 100% 100% 100% 100% 101% 101% 97% 97% 102% 102% 101% 102% 107% 107% 107% 107% 108% 109% 105% 105% 110% 110% 105% 109% 99% 99% 109% 109% 104% 104% 19 19 20 20 23 20 24 24 21 21 23 26 24 24 17 17 22 31 21 21 21 21 20 28 22 22 21 21 16 23 21 21 30 30 15 18 15 15 17 17 23 19 15 15 18 18 11 12 13 13 15 15 12 17 21 21 14 14 12 17 27 27 29 29 33 22 32 32 29 29 35 38 32 32 24 24 33 42 29 29 31 31 29 44 32 32 24 24 33 32 32 32 34 34 22 30 27 27 28 28 36 27 21 21 25 25 15 18 22 22 20 20 20 19 27 27 20 20 26 31 Toronto Regional Real Estate Board SUMMARY OF EXISTING HOME TRANSACTIONS All Home Types, March 2023 Market Watch, March 2023 Copyright 2023 Toronto Regional Real Estate Board 4 City of Toronto Municipal Breakdown
- 5. Sales Dollar Volume Average Price Median Price New Listings Avg. SP/LP Avg. LDOM Avg. PDOM All TRREB Areas Halton Region Halton Region Burlington Halton Hills Milton Milton Oakville Peel Region Brampton Brampton Caledon Mississauga City of Toronto City of Toronto Toronto West Toronto Central Toronto East Toronto East York Region Aurora East Gwillimbury East Gwillimbury Georgina King Markham Markham Newmarket Richmond Hill Richmond Hill Vaughan Vaughan Stouffville Durham Region Durham Region Ajax Ajax Brock Clarington Clarington Oshawa Oshawa Pickering Scugog Scugog Uxbridge Uxbridge Whitby Dufferin County Dufferin County Orangeville Orangeville Simcoe County Adjala-Tosorontio Adjala-Tosorontio Bradford Bradford Essa Innisfil Innisfil New Tecumseth 14,750 1,600 1,600 542 151 331 331 576 2,681 1,266 1,266 184 1,231 5,366 5,366 1,435 2,681 1,250 1,250 2,700 178 99 99 144 53 673 673 232 477 477 713 713 131 1,855 1,855 267 267 39 309 309 528 528 264 47 47 54 54 347 77 77 77 77 471 26 26 106 106 55 140 140 144 $16,074,825,214 $1,953,943,422 $1,953,943,422 $551,899,538 $160,830,356 $361,156,629 $361,156,629 $880,056,899 $2,771,608,982 $1,294,585,193 $1,294,585,193 $241,463,260 $1,235,560,529 $5,616,357,464 $5,616,357,464 $1,403,435,061 $2,969,084,724 $1,243,837,679 $1,243,837,679 $3,559,892,359 $247,395,832 $132,077,788 $132,077,788 $137,084,400 $108,104,664 $863,337,051 $863,337,051 $275,352,104 $663,965,193 $663,965,193 $957,368,320 $957,368,320 $175,207,007 $1,679,099,704 $1,679,099,704 $263,152,678 $263,152,678 $27,879,650 $263,167,287 $263,167,287 $417,634,866 $417,634,866 $247,745,727 $43,112,300 $43,112,300 $67,504,095 $67,504,095 $348,903,101 $61,867,609 $61,867,609 $61,867,609 $61,867,609 $432,055,674 $27,542,788 $27,542,788 $114,576,368 $114,576,368 $44,392,752 $124,048,200 $124,048,200 $121,495,566 $1,089,819 $1,221,215 $1,221,215 $1,018,265 $1,065,102 $1,091,108 $1,091,108 $1,527,877 $1,033,797 $1,022,579 $1,022,579 $1,312,300 $1,003,705 $1,046,656 $1,046,656 $978,004 $1,107,454 $995,070 $995,070 $1,318,479 $1,389,864 $1,334,119 $1,334,119 $951,975 $2,039,711 $1,282,819 $1,282,819 $1,186,863 $1,391,961 $1,391,961 $1,342,733 $1,342,733 $1,337,458 $905,175 $905,175 $985,591 $985,591 $714,863 $851,674 $851,674 $790,975 $790,975 $938,431 $917,283 $917,283 $1,250,076 $1,250,076 $1,005,484 $803,475 $803,475 $803,475 $803,475 $917,316 $1,059,338 $1,059,338 $1,080,909 $1,080,909 $807,141 $886,059 $886,059 $843,719 $940,000 $1,065,000 $1,065,000 $910,000 $977,000 $1,000,000 $1,000,000 $1,335,900 $950,000 $955,000 $955,000 $1,200,000 $880,000 $838,888 $838,888 $862,500 $780,000 $950,000 $950,000 $1,227,000 $1,300,500 $1,290,000 $1,290,000 $853,000 $1,625,000 $1,253,000 $1,253,000 $1,162,500 $1,280,000 $1,280,000 $1,220,000 $1,220,000 $1,260,000 $860,000 $860,000 $935,000 $935,000 $660,000 $810,000 $810,000 $760,000 $760,000 $892,500 $840,000 $840,000 $1,115,000 $1,115,000 $968,000 $755,000 $755,000 $755,000 $755,000 $876,000 $995,450 $995,450 $1,052,500 $1,052,500 $745,000 $852,750 $852,750 $790,000 27,254 2,737 2,737 881 285 529 529 1,042 4,726 2,020 2,020 405 2,301 10,646 10,646 2,733 5,727 2,186 2,186 4,866 289 215 215 271 159 1,064 1,064 353 912 912 1,326 1,326 277 3,059 3,059 420 420 79 508 508 902 902 398 88 88 105 105 559 149 149 149 149 1,071 57 57 211 211 120 414 414 269 100% 99% 99% 98% 98% 100% 100% 98% 99% 99% 99% 97% 99% 100% 100% 99% 99% 104% 104% 102% 100% 100% 100% 99% 94% 107% 107% 102% 104% 104% 100% 100% 101% 102% 102% 104% 104% 96% 101% 101% 103% 103% 102% 98% 98% 98% 98% 102% 98% 98% 98% 98% 97% 96% 96% 98% 98% 97% 97% 97% 98% 22 23 23 26 24 17 17 23 22 21 21 30 22 23 23 26 24 19 19 21 16 24 24 27 42 18 18 18 20 20 23 23 22 16 16 13 13 30 19 19 16 16 17 31 31 20 20 13 25 25 25 25 28 45 45 21 21 28 34 34 23 32 33 33 36 38 25 25 33 33 31 31 45 33 34 34 37 35 28 28 30 23 32 32 36 61 24 24 26 31 31 33 33 30 24 24 19 19 42 28 28 24 24 24 43 43 33 33 18 40 40 40 40 38 49 49 33 33 39 48 48 30 Toronto Regional Real Estate Board SUMMARY OF EXISTING HOME TRANSACTIONS All Home Types, Year-to-Date 2023 Market Watch, March 2023 Copyright 2023 Toronto Regional Real Estate Board 5 ALL TRREB AREAS
- 6. Sales Dollar Volume Average Price Median Price New Listings Avg. SP/LP Avg. LDOM Avg. PDOM All TRREB Areas All TRREB Areas City of Toronto City of Toronto Toronto West Toronto W01 Toronto W02 Toronto W02 Toronto W03 Toronto W03 Toronto W04 Toronto W05 Toronto W06 Toronto W06 Toronto W07 Toronto W07 Toronto W08 Toronto W09 Toronto W10 Toronto W10 Toronto Central Toronto Central Toronto C01 Toronto C02 Toronto C03 Toronto C03 Toronto C04 Toronto C04 Toronto C06 Toronto C07 Toronto C08 Toronto C08 Toronto C09 Toronto C09 Toronto C10 Toronto C11 Toronto C12 Toronto C12 Toronto C13 Toronto C13 Toronto C14 Toronto C15 Toronto East Toronto East Toronto E01 Toronto E01 Toronto E02 Toronto E03 Toronto E04 Toronto E04 Toronto E05 Toronto E05 Toronto E06 Toronto E07 Toronto E08 Toronto E08 Toronto E09 Toronto E09 Toronto E10 Toronto E11 14,750 14,750 5,366 5,366 1,435 91 127 127 101 101 154 205 261 261 47 47 273 69 107 107 2,681 2,681 800 141 92 92 126 126 55 187 380 380 41 41 149 70 47 47 121 121 217 255 1,250 1,250 120 120 100 159 138 138 127 127 60 124 92 92 150 150 79 101 $16,074,825,214 $16,074,825,214 $5,616,357,464 $5,616,357,464 $1,403,435,061 $104,280,426 $153,443,714 $153,443,714 $97,517,604 $97,517,604 $132,993,901 $163,046,513 $235,100,713 $235,100,713 $74,801,999 $74,801,999 $291,524,923 $68,162,638 $82,562,630 $82,562,630 $2,969,084,724 $2,969,084,724 $691,431,911 $228,135,507 $121,285,328 $121,285,328 $264,182,162 $264,182,162 $59,103,311 $210,281,026 $304,226,033 $304,226,033 $82,294,300 $82,294,300 $150,255,295 $94,243,400 $136,669,500 $136,669,500 $136,173,169 $136,173,169 $232,481,855 $258,321,927 $1,243,837,679 $1,243,837,679 $140,351,985 $140,351,985 $130,734,020 $188,867,892 $119,284,385 $119,284,385 $112,996,764 $112,996,764 $66,858,679 $105,101,851 $89,601,110 $89,601,110 $125,105,057 $125,105,057 $81,544,800 $83,391,136 $1,089,819 $1,089,819 $1,046,656 $1,046,656 $978,004 $1,145,939 $1,208,218 $1,208,218 $965,521 $965,521 $863,597 $795,349 $900,769 $900,769 $1,591,532 $1,591,532 $1,067,857 $987,864 $771,613 $771,613 $1,107,454 $1,107,454 $864,290 $1,617,982 $1,318,319 $1,318,319 $2,096,684 $2,096,684 $1,074,606 $1,124,497 $800,595 $800,595 $2,007,178 $2,007,178 $1,008,425 $1,346,334 $2,907,862 $2,907,862 $1,125,398 $1,125,398 $1,071,345 $1,013,027 $995,070 $995,070 $1,169,600 $1,169,600 $1,307,340 $1,187,848 $864,380 $864,380 $889,738 $889,738 $1,114,311 $847,596 $973,925 $973,925 $834,034 $834,034 $1,032,213 $825,655 $940,000 $940,000 $838,888 $838,888 $862,500 $1,000,000 $1,120,000 $1,120,000 $950,000 $950,000 $840,000 $845,000 $800,000 $800,000 $1,322,000 $1,322,000 $725,000 $850,000 $770,000 $770,000 $780,000 $780,000 $716,000 $1,235,000 $994,000 $994,000 $1,866,088 $1,866,088 $729,000 $820,000 $690,000 $690,000 $1,350,000 $1,350,000 $755,000 $803,500 $1,780,000 $1,780,000 $820,000 $820,000 $775,000 $757,000 $950,000 $950,000 $1,089,250 $1,089,250 $1,240,000 $1,120,000 $867,500 $867,500 $749,000 $749,000 $1,000,000 $666,500 $862,500 $862,500 $733,500 $733,500 $1,035,000 $800,000 27,254 27,254 10,646 10,646 2,733 196 248 248 190 190 290 366 511 511 89 89 531 113 199 199 5,727 5,727 1,686 368 206 206 264 264 135 347 970 970 87 87 317 129 129 129 219 219 397 473 2,186 2,186 224 224 184 277 237 237 226 226 124 189 190 190 211 211 167 157 100% 100% 100% 100% 99% 101% 101% 101% 100% 100% 99% 98% 99% 99% 99% 99% 99% 97% 99% 99% 99% 99% 99% 96% 99% 99% 98% 98% 99% 99% 99% 99% 99% 99% 101% 100% 97% 97% 102% 102% 100% 100% 104% 104% 104% 104% 106% 105% 105% 105% 106% 106% 102% 106% 100% 100% 106% 106% 101% 102% 22 22 23 23 26 22 23 23 23 23 28 31 24 24 18 18 26 34 27 27 24 24 25 30 19 19 25 25 23 23 24 24 27 27 19 23 19 19 20 20 27 23 19 19 18 18 13 17 17 17 19 19 20 23 22 22 19 19 18 22 32 32 34 34 37 27 29 29 34 34 43 43 34 34 29 29 38 43 40 40 35 35 36 43 27 27 31 31 41 36 34 34 30 30 28 38 35 35 30 30 43 35 28 28 29 29 19 29 25 25 28 28 26 29 32 32 27 27 33 36 Toronto Regional Real Estate Board SUMMARY OF EXISTING HOME TRANSACTIONS All Home Types, Year-to-Date 2023 Market Watch, March 2023 Copyright 2023 Toronto Regional Real Estate Board 6 City of Toronto Municipal Breakdown
- 7. Sales Dollar Volume Average Price Median Price New Listings Active Listings Avg. SP/LP Avg. LDOM Abc Abc Abc Abc Abc Abc Abc Abc Abc Abc Abc Abc Abc Abc Abc Abc Abc Abc Abc Abc Abc Abc Abc Abc Abc Abc Abc Abc Abc Abc Abc Abc Abc Abc Abc Abc Abc Abc Abc Abc Abc All TRREB Areas Halton Region Halton Region Burlington Halton Hills Milton Milton Oakville Peel Region Brampton Brampton Caledon Mississauga City of Toronto City of Toronto Toronto West Toronto Central Toronto East Toronto East York Region Aurora East Gwillimbury East Gwillimbury Georgina King Markham Markham Newmarket Richmond Hill Richmond Hill Vaughan Vaughan Stouffville Durham Region Durham Region Ajax Ajax Brock Clarington Clarington Oshawa Oshawa Pickering Scugog Scugog Uxbridge Uxbridge Whitby Dufferin County Dufferin County Orangeville Orangeville Simcoe County Adjala-Tosorontio Adjala-Tosorontio Bradford Bradford Essa Innisfil Innisfil New Tecumseth 3,000 383 383 106 52 68 68 157 560 291 291 67 202 666 666 223 202 241 241 682 66 42 42 54 14 126 126 82 98 98 151 151 49 534 534 72 72 17 90 90 162 162 56 17 17 21 21 99 16 16 16 16 159 11 11 38 38 17 53 53 40 $4,405,951,530 $631,973,968 $631,973,968 $151,724,001 $62,937,299 $95,962,457 $95,962,457 $321,350,211 $771,663,309 $361,478,279 $361,478,279 $96,417,661 $313,767,369 $1,137,776,325 $1,137,776,325 $311,058,140 $507,069,294 $319,648,891 $319,648,891 $1,141,093,095 $108,704,476 $60,439,100 $60,439,100 $59,020,900 $33,935,000 $227,549,848 $227,549,848 $106,903,360 $194,314,388 $194,314,388 $277,811,900 $277,811,900 $72,414,123 $553,656,201 $553,656,201 $82,922,483 $82,922,483 $13,038,150 $81,265,277 $81,265,277 $147,022,799 $147,022,799 $71,521,369 $15,289,250 $15,289,250 $29,582,500 $29,582,500 $113,014,373 $14,104,500 $14,104,500 $14,104,500 $14,104,500 $155,684,133 $11,224,788 $11,224,788 $44,167,068 $44,167,068 $14,146,077 $48,182,700 $48,182,700 $37,963,500 $1,468,651 $1,650,063 $1,650,063 $1,431,359 $1,210,333 $1,411,213 $1,411,213 $2,046,817 $1,377,970 $1,242,193 $1,242,193 $1,439,070 $1,553,304 $1,708,373 $1,708,373 $1,394,880 $2,510,244 $1,326,344 $1,326,344 $1,673,157 $1,647,038 $1,439,026 $1,439,026 $1,092,980 $2,423,929 $1,805,951 $1,805,951 $1,303,700 $1,982,800 $1,982,800 $1,839,814 $1,839,814 $1,477,839 $1,036,809 $1,036,809 $1,151,701 $1,151,701 $766,950 $902,948 $902,948 $907,548 $907,548 $1,277,167 $899,368 $899,368 $1,408,690 $1,408,690 $1,141,559 $881,531 $881,531 $881,531 $881,531 $979,145 $1,020,435 $1,020,435 $1,162,291 $1,162,291 $832,122 $909,108 $909,108 $949,088 $1,300,000 $1,460,000 $1,460,000 $1,300,000 $1,100,000 $1,311,500 $1,311,500 $1,790,000 $1,300,000 $1,195,000 $1,195,000 $1,375,000 $1,375,000 $1,375,500 $1,375,500 $1,250,000 $2,100,000 $1,200,800 $1,200,800 $1,550,000 $1,613,750 $1,493,000 $1,493,000 $935,000 $2,437,500 $1,683,450 $1,683,450 $1,292,500 $1,823,000 $1,823,000 $1,671,000 $1,671,000 $1,400,000 $992,500 $992,500 $1,100,000 $1,100,000 $692,500 $900,000 $900,000 $863,000 $863,000 $1,247,500 $926,250 $926,250 $1,395,000 $1,395,000 $1,110,000 $863,750 $863,750 $863,750 $863,750 $930,000 $995,900 $995,900 $1,179,750 $1,179,750 $800,000 $882,500 $882,500 $905,000 4,972 579 579 160 86 108 108 225 936 447 447 128 361 1,126 1,126 347 384 395 395 1,105 87 75 75 106 62 203 203 94 180 180 223 223 75 844 844 109 109 28 148 148 253 253 79 26 26 39 39 162 35 35 35 35 347 19 19 61 61 51 136 136 80 4,379 541 541 156 92 85 85 208 825 357 357 153 315 1,001 1,001 321 422 258 258 1,016 61 74 74 105 96 156 156 52 181 181 217 217 74 542 542 55 55 33 94 94 142 142 51 31 31 34 34 102 39 39 39 39 415 34 34 64 64 56 175 175 86 101% 99% 99% 99% 98% 99% 99% 99% 99% 99% 99% 96% 99% 102% 102% 100% 100% 107% 107% 102% 100% 101% 101% 99% 96% 108% 108% 103% 104% 104% 99% 99% 101% 103% 103% 103% 103% 95% 103% 103% 106% 106% 102% 98% 98% 99% 99% 102% 99% 99% 99% 99% 98% 96% 96% 100% 100% 97% 99% 99% 97% 17 18 18 18 22 20 20 16 19 19 19 32 14 16 16 21 17 12 12 18 13 29 29 23 30 14 14 18 16 16 19 19 19 14 14 12 12 28 16 16 11 11 11 39 39 17 17 11 17 17 17 17 24 38 38 17 17 26 29 29 22 Toronto Regional Real Estate Board SUMMARY OF EXISTING HOME TRANSACTIONS Detached, March 2023 Market Watch, March 2023 Copyright 2023 Toronto Regional Real Estate Board 7 ALL TRREB AREAS
- 8. Sales Dollar Volume Average Price Median Price New Listings Active Listings Avg. SP/LP Avg. LDOM Abc Abc Abc Abc Abc Abc Abc Abc Abc Abc Abc Abc Abc Abc Abc Abc Abc Abc Abc Abc Abc Abc Abc Abc Abc Abc Abc Abc Abc Abc Abc Abc Abc Abc Abc Abc Abc Abc Abc Abc All TRREB Areas All TRREB Areas City of Toronto City of Toronto Toronto West Toronto W01 Toronto W02 Toronto W02 Toronto W03 Toronto W03 Toronto W04 Toronto W05 Toronto W06 Toronto W06 Toronto W07 Toronto W07 Toronto W08 Toronto W09 Toronto W10 Toronto W10 Toronto Central Toronto Central Toronto C01 Toronto C02 Toronto C03 Toronto C03 Toronto C04 Toronto C04 Toronto C06 Toronto C07 Toronto C08 Toronto C08 Toronto C09 Toronto C09 Toronto C10 Toronto C11 Toronto C12 Toronto C12 Toronto C13 Toronto C13 Toronto C14 Toronto C15 Toronto East Toronto East Toronto E01 Toronto E01 Toronto E02 Toronto E03 Toronto E04 Toronto E04 Toronto E05 Toronto E05 Toronto E06 Toronto E07 Toronto E08 Toronto E08 Toronto E09 Toronto E09 Toronto E10 Toronto E11 3,000 3,000 666 666 223 7 16 16 19 19 27 27 27 27 16 16 42 18 24 24 202 202 2 8 17 17 43 43 10 23 2 2 5 5 13 7 12 12 12 12 20 28 241 241 13 13 14 42 26 26 16 16 25 22 17 17 31 31 23 12 $4,405,951,530 $4,405,951,530 $1,137,776,325 $1,137,776,325 $311,058,140 $14,285,000 $26,151,380 $26,151,380 $22,338,016 $22,338,016 $31,203,618 $30,173,413 $36,107,434 $36,107,434 $30,858,499 $30,858,499 $67,529,600 $27,542,000 $24,869,180 $24,869,180 $507,069,294 $507,069,294 $3,627,000 $20,126,000 $29,354,500 $29,354,500 $116,080,220 $116,080,220 $20,109,018 $49,715,400 $5,800,000 $5,800,000 $16,225,000 $16,225,000 $26,924,000 $17,824,100 $67,096,000 $67,096,000 $25,795,550 $25,795,550 $51,868,506 $56,524,000 $319,648,891 $319,648,891 $21,557,553 $21,557,553 $26,110,499 $57,565,361 $30,345,100 $30,345,100 $22,008,000 $22,008,000 $27,311,387 $27,763,388 $27,474,410 $27,474,410 $34,937,193 $34,937,193 $29,762,000 $14,814,000 $1,468,651 $1,468,651 $1,708,373 $1,708,373 $1,394,880 $2,040,714 $1,634,461 $1,634,461 $1,175,685 $1,175,685 $1,155,690 $1,117,534 $1,337,312 $1,337,312 $1,928,656 $1,928,656 $1,607,848 $1,530,111 $1,036,216 $1,036,216 $2,510,244 $2,510,244 $1,813,500 $2,515,750 $1,726,735 $1,726,735 $2,699,540 $2,699,540 $2,010,902 $2,161,539 $2,900,000 $2,900,000 $3,245,000 $3,245,000 $2,071,077 $2,546,300 $5,591,333 $5,591,333 $2,149,629 $2,149,629 $2,593,425 $2,018,714 $1,326,344 $1,326,344 $1,658,273 $1,658,273 $1,865,036 $1,370,604 $1,167,119 $1,167,119 $1,375,500 $1,375,500 $1,092,455 $1,261,972 $1,616,142 $1,616,142 $1,127,006 $1,127,006 $1,294,000 $1,234,500 $1,300,000 $1,300,000 $1,375,500 $1,375,500 $1,250,000 $2,175,000 $1,390,500 $1,390,500 $1,100,000 $1,100,000 $1,100,000 $1,120,000 $1,215,000 $1,215,000 $1,536,750 $1,536,750 $1,426,500 $1,274,000 $987,500 $987,500 $2,100,000 $2,100,000 $1,813,500 $2,395,500 $1,750,000 $1,750,000 $2,425,000 $2,425,000 $1,600,000 $1,830,000 $2,900,000 $2,900,000 $3,605,000 $3,605,000 $1,925,000 $2,195,000 $4,946,500 $4,946,500 $1,774,000 $1,774,000 $2,350,009 $1,630,600 $1,200,800 $1,200,800 $1,617,000 $1,617,000 $1,678,000 $1,205,000 $1,074,000 $1,074,000 $1,377,500 $1,377,500 $1,075,000 $1,305,000 $1,450,000 $1,450,000 $1,135,000 $1,135,000 $1,236,000 $1,212,500 4,972 4,972 1,126 1,126 347 9 30 30 44 44 42 32 36 36 26 26 69 22 37 37 384 384 10 8 38 38 79 79 24 51 3 3 9 9 15 11 39 39 24 24 29 44 395 395 31 31 20 79 37 37 27 27 36 24 29 29 41 41 55 16 4,379 4,379 1,001 1,001 321 13 26 26 37 37 46 25 38 38 19 19 70 18 29 29 422 422 16 12 43 43 71 71 25 54 4 4 11 11 10 6 73 73 25 25 43 29 258 258 21 21 16 55 28 28 15 15 19 14 27 27 15 15 42 6 101% 101% 102% 102% 100% 100% 99% 99% 102% 102% 100% 98% 102% 102% 102% 102% 99% 98% 100% 100% 100% 100% 94% 100% 100% 100% 99% 99% 99% 98% 98% 98% 102% 102% 101% 101% 96% 96% 104% 104% 101% 101% 107% 107% 106% 106% 107% 108% 106% 106% 117% 117% 106% 110% 99% 99% 114% 114% 105% 105% 17 17 16 16 21 27 24 24 19 19 19 25 26 26 16 16 14 31 21 21 17 17 31 12 25 25 12 12 18 26 15 15 37 37 11 4 17 17 20 20 24 9 12 12 17 17 11 11 13 13 7 7 12 13 14 14 8 8 8 20 Toronto Regional Real Estate Board SUMMARY OF EXISTING HOME TRANSACTIONS Detached, March 2023 Market Watch, March 2023 Copyright 2023 Toronto Regional Real Estate Board 8 City of Toronto Municipal Breakdown
- 9. Sales Dollar Volume Average Price Median Price New Listings Active Listings Avg. SP/LP Avg. LDOM Abc Abc Abc Abc Abc Abc Abc Abc Abc Abc Abc Abc Abc Abc Abc Abc Abc Abc Abc Abc Abc Abc Abc Abc Abc Abc Abc Abc Abc Abc Abc Abc Abc Abc Abc Abc Abc Abc Abc Abc Abc All TRREB Areas Halton Region Halton Region Burlington Halton Hills Milton Milton Oakville Peel Region Brampton Brampton Caledon Mississauga City of Toronto City of Toronto Toronto West Toronto Central Toronto East Toronto East York Region Aurora East Gwillimbury East Gwillimbury Georgina King Markham Markham Newmarket Richmond Hill Richmond Hill Vaughan Vaughan Stouffville Durham Region Durham Region Ajax Ajax Brock Clarington Clarington Oshawa Oshawa Pickering Scugog Scugog Uxbridge Uxbridge Whitby Dufferin County Dufferin County Orangeville Orangeville Simcoe County Adjala-Tosorontio Adjala-Tosorontio Bradford Bradford Essa Innisfil Innisfil New Tecumseth 556 29 29 7 0 18 18 4 175 105 105 7 63 202 202 77 53 72 72 66 4 0 0 2 0 16 16 11 12 12 18 18 3 68 68 18 18 1 3 3 21 21 9 1 1 0 0 15 2 2 2 2 14 0 0 10 10 0 0 0 4 $604,885,564 $29,803,189 $29,803,189 $6,945,000 $18,140,089 $18,140,089 $4,718,100 $174,351,212 $100,457,904 $100,457,904 $7,299,000 $66,594,308 $255,050,976 $255,050,976 $86,189,566 $82,208,593 $86,652,817 $86,652,817 $75,653,477 $3,685,000 $1,422,000 $20,830,389 $20,830,389 $10,900,888 $14,670,200 $14,670,200 $21,055,000 $21,055,000 $3,090,000 $55,956,710 $55,956,710 $15,662,049 $15,662,049 $445,000 $2,223,200 $2,223,200 $14,933,657 $14,933,657 $8,229,400 $684,000 $684,000 $13,779,404 $1,385,000 $1,385,000 $1,385,000 $1,385,000 $12,685,000 $9,695,000 $9,695,000 $2,990,000 $1,087,924 $1,027,696 $1,027,696 $992,143 $1,007,783 $1,007,783 $1,179,525 $996,293 $956,742 $956,742 $1,042,714 $1,057,053 $1,262,629 $1,262,629 $1,119,345 $1,551,106 $1,203,511 $1,203,511 $1,146,265 $921,250 $711,000 $1,301,899 $1,301,899 $990,990 $1,222,517 $1,222,517 $1,169,722 $1,169,722 $1,030,000 $822,893 $822,893 $870,114 $870,114 $445,000 $741,067 $741,067 $711,127 $711,127 $914,378 $684,000 $684,000 $918,627 $692,500 $692,500 $692,500 $692,500 $906,071 $969,500 $969,500 $747,500 $1,040,000 $999,990 $999,990 $970,000 $999,995 $999,995 $1,235,050 $991,000 $951,000 $951,000 $1,042,000 $1,050,000 $1,166,111 $1,166,111 $1,040,000 $1,450,000 $1,150,000 $1,150,000 $1,170,000 $927,500 $711,000 $1,296,500 $1,296,500 $1,065,000 $1,276,900 $1,276,900 $1,171,000 $1,171,000 $1,020,000 $814,500 $814,500 $875,000 $875,000 $445,000 $790,000 $790,000 $715,000 $715,000 $915,500 $684,000 $684,000 $895,000 $692,500 $692,500 $692,500 $692,500 $960,000 $970,000 $970,000 $705,000 772 50 50 17 2 20 20 11 230 125 125 10 95 302 302 116 93 93 93 89 6 5 5 1 0 19 19 20 18 18 12 12 8 77 77 25 25 1 5 5 27 27 7 0 0 0 0 12 6 6 6 6 18 0 0 10 10 0 0 0 8 470 29 29 13 2 6 6 8 125 63 63 4 58 215 215 90 80 45 45 56 5 7 7 0 0 10 10 9 19 19 3 3 3 31 31 6 6 0 3 3 14 14 4 0 0 1 1 3 4 4 4 4 10 0 0 4 4 2 0 0 4 105% 101% 101% 101% 101% 101% 100% 102% 101% 101% 102% 104% 106% 106% 102% 104% 113% 113% 109% 101% 96% 117% 117% 108% 116% 116% 103% 103% 97% 107% 107% 109% 109% 97% 104% 104% 110% 110% 103% 99% 99% 105% 98% 98% 98% 98% 101% 100% 100% 103% 13 12 12 12 14 14 8 14 15 15 26 12 16 16 21 13 12 12 8 5 15 7 7 7 8 8 10 10 6 10 10 7 7 10 12 12 13 13 15 14 14 8 8 8 8 8 15 18 18 6 Toronto Regional Real Estate Board SUMMARY OF EXISTING HOME TRANSACTIONS Semi-Detached, March 2023 Market Watch, March 2023 Copyright 2023 Toronto Regional Real Estate Board 9 ALL TRREB AREAS
- 10. Sales Dollar Volume Average Price Median Price New Listings Active Listings Avg. SP/LP Avg. LDOM Abc Abc Abc Abc Abc Abc Abc Abc Abc Abc Abc Abc Abc Abc Abc Abc Abc Abc Abc Abc Abc Abc Abc Abc Abc Abc Abc Abc Abc Abc Abc Abc Abc Abc Abc Abc Abc Abc Abc Abc All TRREB Areas All TRREB Areas City of Toronto City of Toronto Toronto West Toronto W01 Toronto W02 Toronto W02 Toronto W03 Toronto W03 Toronto W04 Toronto W05 Toronto W06 Toronto W06 Toronto W07 Toronto W07 Toronto W08 Toronto W09 Toronto W10 Toronto W10 Toronto Central Toronto Central Toronto C01 Toronto C02 Toronto C03 Toronto C03 Toronto C04 Toronto C04 Toronto C06 Toronto C07 Toronto C08 Toronto C08 Toronto C09 Toronto C09 Toronto C10 Toronto C11 Toronto C12 Toronto C12 Toronto C13 Toronto C13 Toronto C14 Toronto C15 Toronto East Toronto East Toronto E01 Toronto E01 Toronto E02 Toronto E03 Toronto E04 Toronto E04 Toronto E05 Toronto E05 Toronto E06 Toronto E07 Toronto E08 Toronto E08 Toronto E09 Toronto E09 Toronto E10 Toronto E11 556 556 202 202 77 9 15 15 15 15 2 32 2 2 0 0 2 0 0 0 53 53 11 8 9 9 4 4 0 2 3 3 0 0 5 1 1 1 4 4 0 5 72 72 18 18 17 19 4 4 3 3 1 4 0 0 1 1 2 3 $604,885,564 $604,885,564 $255,050,976 $255,050,976 $86,189,566 $13,457,000 $18,688,866 $18,688,866 $16,919,800 $16,919,800 $1,840,000 $30,800,900 $2,258,000 $2,258,000 $2,225,000 $82,208,593 $82,208,593 $19,247,000 $12,548,071 $12,912,222 $12,912,222 $7,429,000 $7,429,000 $2,147,000 $5,310,000 $5,310,000 $9,226,000 $1,525,000 $1,391,000 $1,391,000 $4,562,000 $4,562,000 $5,911,300 $86,652,817 $86,652,817 $23,712,500 $23,712,500 $22,527,042 $21,961,587 $3,507,000 $3,507,000 $3,318,800 $3,318,800 $910,000 $4,641,888 $905,000 $905,000 $2,105,000 $3,064,000 $1,087,924 $1,087,924 $1,262,629 $1,262,629 $1,119,345 $1,495,222 $1,245,924 $1,245,924 $1,127,987 $1,127,987 $920,000 $962,528 $1,129,000 $1,129,000 $1,112,500 $1,551,106 $1,551,106 $1,749,727 $1,568,509 $1,434,691 $1,434,691 $1,857,250 $1,857,250 $1,073,500 $1,770,000 $1,770,000 $1,845,200 $1,525,000 $1,391,000 $1,391,000 $1,140,500 $1,140,500 $1,182,260 $1,203,511 $1,203,511 $1,317,361 $1,317,361 $1,325,120 $1,155,873 $876,750 $876,750 $1,106,267 $1,106,267 $910,000 $1,160,472 $905,000 $905,000 $1,052,500 $1,021,333 $1,040,000 $1,040,000 $1,166,111 $1,166,111 $1,040,000 $1,350,000 $1,231,000 $1,231,000 $1,115,000 $1,115,000 $920,000 $950,000 $1,129,000 $1,129,000 $1,112,500 $1,450,000 $1,450,000 $1,510,000 $1,471,500 $1,360,000 $1,360,000 $1,695,500 $1,695,500 $1,073,500 $1,810,000 $1,810,000 $1,710,000 $1,525,000 $1,391,000 $1,391,000 $1,104,000 $1,104,000 $1,159,000 $1,150,000 $1,150,000 $1,274,500 $1,274,500 $1,280,400 $1,121,600 $891,000 $891,000 $1,100,000 $1,100,000 $910,000 $1,154,000 $905,000 $905,000 $1,052,500 $995,000 772 772 302 302 116 13 19 19 20 20 9 46 6 6 0 0 2 1 0 0 93 93 36 16 10 10 3 3 0 1 7 7 0 0 4 2 0 0 9 9 0 5 93 93 25 25 23 17 7 7 5 5 3 3 0 0 2 2 4 4 470 470 215 215 90 10 17 17 15 15 8 29 6 6 1 1 1 1 2 2 80 80 34 14 6 6 2 2 2 3 6 6 3 3 2 1 0 0 4 4 0 3 45 45 9 9 13 5 3 3 2 2 3 2 0 0 2 2 2 4 105% 105% 106% 106% 102% 106% 102% 102% 103% 103% 99% 100% 95% 95% 99% 104% 104% 101% 101% 101% 101% 104% 104% 98% 103% 103% 106% 109% 117% 117% 108% 108% 117% 113% 113% 111% 111% 114% 113% 109% 109% 115% 115% 101% 117% 113% 113% 125% 107% 13 13 16 16 21 17 19 19 26 26 8 20 65 65 2 13 13 12 12 20 20 17 17 27 3 3 10 2 14 14 5 5 11 12 12 17 17 9 11 5 5 7 7 6 23 6 6 5 17 Toronto Regional Real Estate Board SUMMARY OF EXISTING HOME TRANSACTIONS Semi-Detached, March 2023 Market Watch, March 2023 Copyright 2023 Toronto Regional Real Estate Board 10 City of Toronto Municipal Breakdown
- 11. Sales Dollar Volume Average Price Median Price New Listings Active Listings Avg. SP/LP Avg. LDOM Abc Abc Abc Abc Abc Abc Abc Abc Abc Abc Abc Abc Abc Abc Abc Abc Abc Abc Abc Abc Abc Abc Abc Abc Abc Abc Abc Abc Abc Abc Abc Abc Abc Abc Abc Abc Abc Abc Abc Abc Abc All TRREB Areas Halton Region Halton Region Burlington Halton Hills Milton Milton Oakville Peel Region Brampton Brampton Caledon Mississauga City of Toronto City of Toronto Toronto West Toronto Central Toronto East Toronto East York Region Aurora East Gwillimbury East Gwillimbury Georgina King Markham Markham Newmarket Richmond Hill Richmond Hill Vaughan Vaughan Stouffville Durham Region Durham Region Ajax Ajax Brock Clarington Clarington Oshawa Oshawa Pickering Scugog Scugog Uxbridge Uxbridge Whitby Dufferin County Dufferin County Orangeville Orangeville Simcoe County Adjala-Tosorontio Adjala-Tosorontio Bradford Bradford Essa Innisfil Innisfil New Tecumseth 640 104 104 13 11 37 37 43 122 94 94 13 15 76 76 21 26 29 29 185 13 7 7 5 1 52 52 18 30 30 49 49 10 114 114 24 24 0 26 26 18 18 15 0 0 1 1 30 7 7 7 7 32 0 0 4 4 6 9 9 13 $663,405,630 $106,696,114 $106,696,114 $12,326,429 $9,799,100 $34,983,286 $34,983,286 $49,587,299 $113,851,745 $85,328,945 $85,328,945 $12,405,800 $16,117,000 $94,343,700 $94,343,700 $25,791,500 $38,036,200 $30,516,000 $30,516,000 $217,149,722 $13,908,500 $7,457,000 $7,457,000 $4,087,500 $1,170,000 $63,949,083 $63,949,083 $18,051,800 $38,265,488 $38,265,488 $59,378,543 $59,378,543 $10,881,808 $97,905,349 $97,905,349 $21,775,073 $21,775,073 $20,217,576 $20,217,576 $13,915,501 $13,915,501 $13,545,000 $1,250,000 $1,250,000 $27,202,199 $5,195,000 $5,195,000 $5,195,000 $5,195,000 $28,264,000 $3,662,000 $3,662,000 $3,875,000 $11,227,000 $11,227,000 $9,500,000 $1,036,571 $1,025,924 $1,025,924 $948,187 $890,827 $945,494 $945,494 $1,153,193 $933,211 $907,755 $907,755 $954,292 $1,074,467 $1,241,364 $1,241,364 $1,228,167 $1,462,931 $1,052,276 $1,052,276 $1,173,782 $1,069,885 $1,065,286 $1,065,286 $817,500 $1,170,000 $1,229,790 $1,229,790 $1,002,878 $1,275,516 $1,275,516 $1,211,807 $1,211,807 $1,088,181 $858,819 $858,819 $907,295 $907,295 $777,599 $777,599 $773,083 $773,083 $903,000 $1,250,000 $1,250,000 $906,740 $742,143 $742,143 $742,143 $742,143 $883,250 $915,500 $915,500 $645,833 $1,247,444 $1,247,444 $730,769 $985,000 $990,000 $990,000 $930,000 $865,000 $950,000 $950,000 $1,150,000 $934,000 $916,500 $916,500 $940,000 $1,025,000 $1,137,500 $1,137,500 $1,220,000 $1,429,850 $1,020,000 $1,020,000 $1,175,000 $1,062,500 $1,090,000 $1,090,000 $800,000 $1,170,000 $1,246,000 $1,246,000 $980,000 $1,276,900 $1,276,900 $1,210,000 $1,210,000 $1,097,000 $850,000 $850,000 $897,778 $897,778 $760,750 $760,750 $804,250 $804,250 $879,000 $1,250,000 $1,250,000 $922,500 $740,000 $740,000 $740,000 $740,000 $731,500 $894,500 $894,500 $650,000 $795,000 $795,000 $725,000 916 157 157 25 13 49 49 70 151 105 105 16 30 111 111 30 44 37 37 298 16 13 13 4 2 69 69 20 58 58 94 94 22 151 151 30 30 0 26 26 17 17 25 2 2 3 3 48 15 15 15 15 33 0 0 3 3 6 11 11 13 539 88 88 19 7 21 21 41 64 36 36 9 19 82 82 27 41 14 14 182 7 9 9 2 1 44 44 8 43 43 55 55 13 85 85 18 18 0 12 12 12 12 10 3 3 4 4 26 9 9 9 9 29 0 0 1 1 5 12 12 11 106% 104% 104% 102% 100% 103% 103% 107% 101% 101% 101% 102% 101% 105% 105% 103% 101% 111% 111% 110% 111% 116% 116% 97% 98% 113% 113% 102% 114% 114% 107% 107% 108% 107% 107% 109% 109% 108% 108% 105% 105% 108% 100% 100% 105% 98% 98% 98% 98% 98% 105% 105% 100% 95% 95% 98% 14 12 12 16 13 11 11 11 13 14 14 12 11 18 18 19 26 9 9 13 5 9 9 18 12 14 14 12 13 13 14 14 12 11 11 8 8 10 10 23 23 7 33 33 9 16 16 16 16 24 11 11 19 35 35 22 Toronto Regional Real Estate Board SUMMARY OF EXISTING HOME TRANSACTIONS Att/Row/Townhouse, March 2023 Market Watch, March 2023 Copyright 2023 Toronto Regional Real Estate Board 11 ALL TRREB AREAS
- 12. Sales Dollar Volume Average Price Median Price New Listings Active Listings Avg. SP/LP Avg. LDOM Abc Abc Abc Abc Abc Abc Abc Abc Abc Abc Abc Abc Abc Abc Abc Abc Abc Abc Abc Abc Abc Abc Abc Abc Abc Abc Abc Abc Abc Abc Abc Abc Abc Abc Abc Abc Abc Abc Abc Abc All TRREB Areas All TRREB Areas City of Toronto City of Toronto Toronto West Toronto W01 Toronto W02 Toronto W02 Toronto W03 Toronto W03 Toronto W04 Toronto W05 Toronto W06 Toronto W06 Toronto W07 Toronto W07 Toronto W08 Toronto W09 Toronto W10 Toronto W10 Toronto Central Toronto Central Toronto C01 Toronto C02 Toronto C03 Toronto C03 Toronto C04 Toronto C04 Toronto C06 Toronto C07 Toronto C08 Toronto C08 Toronto C09 Toronto C09 Toronto C10 Toronto C11 Toronto C12 Toronto C12 Toronto C13 Toronto C13 Toronto C14 Toronto C15 Toronto East Toronto East Toronto E01 Toronto E01 Toronto E02 Toronto E03 Toronto E04 Toronto E04 Toronto E05 Toronto E05 Toronto E06 Toronto E07 Toronto E08 Toronto E08 Toronto E09 Toronto E09 Toronto E10 Toronto E11 640 640 76 76 21 1 6 6 1 1 0 0 6 6 3 3 2 1 1 1 26 26 13 1 0 0 1 1 0 1 6 6 2 2 0 0 0 0 1 1 1 0 29 29 5 5 3 2 3 3 3 3 0 3 1 1 1 1 2 6 $663,405,630 $663,405,630 $94,343,700 $94,343,700 $25,791,500 $1,381,000 $7,869,500 $7,869,500 $640,000 $640,000 $7,263,000 $7,263,000 $3,919,000 $3,919,000 $2,326,500 $1,252,500 $1,140,000 $1,140,000 $38,036,200 $38,036,200 $17,608,700 $2,060,000 $1,090,000 $1,090,000 $1,341,000 $10,056,500 $10,056,500 $3,132,000 $3,132,000 $1,260,000 $1,260,000 $1,488,000 $30,516,000 $30,516,000 $6,043,600 $6,043,600 $3,446,000 $2,495,000 $2,960,000 $2,960,000 $3,133,900 $3,133,900 $3,112,000 $1,050,000 $1,050,000 $1,020,000 $1,020,000 $1,845,000 $5,410,500 $1,036,571 $1,036,571 $1,241,364 $1,241,364 $1,228,167 $1,381,000 $1,311,583 $1,311,583 $640,000 $640,000 $1,210,500 $1,210,500 $1,306,333 $1,306,333 $1,163,250 $1,252,500 $1,140,000 $1,140,000 $1,462,931 $1,462,931 $1,354,515 $2,060,000 $1,090,000 $1,090,000 $1,341,000 $1,676,083 $1,676,083 $1,566,000 $1,566,000 $1,260,000 $1,260,000 $1,488,000 $1,052,276 $1,052,276 $1,208,720 $1,208,720 $1,148,667 $1,247,500 $986,667 $986,667 $1,044,633 $1,044,633 $1,037,333 $1,050,000 $1,050,000 $1,020,000 $1,020,000 $922,500 $901,750 $985,000 $985,000 $1,137,500 $1,137,500 $1,220,000 $1,381,000 $1,260,500 $1,260,500 $640,000 $640,000 $1,210,000 $1,210,000 $1,325,000 $1,325,000 $1,163,250 $1,252,500 $1,140,000 $1,140,000 $1,429,850 $1,429,850 $1,434,700 $2,060,000 $1,090,000 $1,090,000 $1,341,000 $1,332,500 $1,332,500 $1,566,000 $1,566,000 $1,260,000 $1,260,000 $1,488,000 $1,020,000 $1,020,000 $1,260,000 $1,260,000 $1,136,000 $1,247,500 $1,030,000 $1,030,000 $1,050,000 $1,050,000 $1,011,000 $1,050,000 $1,050,000 $1,020,000 $1,020,000 $922,500 $908,500 916 916 111 111 30 2 6 6 5 5 2 4 7 7 2 2 0 1 1 1 44 44 16 5 0 0 0 0 0 0 11 11 2 2 0 0 0 0 3 3 7 0 37 37 9 9 4 2 3 3 4 4 0 4 3 3 1 1 2 5 539 539 82 82 27 2 3 3 1 1 3 6 4 4 1 1 2 2 3 3 41 41 11 6 1 1 0 0 1 1 14 14 0 0 0 0 0 0 2 2 5 0 14 14 7 7 1 0 1 1 0 0 0 2 0 0 0 0 1 2 106% 106% 105% 105% 103% 106% 105% 105% 107% 107% 105% 105% 100% 100% 98% 97% 98% 98% 101% 101% 100% 94% 109% 109% 99% 101% 101% 105% 105% 97% 97% 106% 111% 111% 117% 117% 107% 128% 104% 104% 112% 112% 120% 105% 105% 113% 113% 97% 107% 14 14 18 18 19 7 15 15 6 6 19 19 23 23 25 33 25 25 26 26 24 73 21 21 100 23 23 5 5 13 13 9 9 9 7 7 12 2 10 10 9 9 5 5 5 6 6 14 13 Toronto Regional Real Estate Board SUMMARY OF EXISTING HOME TRANSACTIONS Att/Row/Townhouse, March 2023 Market Watch, March 2023 Copyright 2023 Toronto Regional Real Estate Board 12 City of Toronto Municipal Breakdown
- 13. Sales Dollar Volume Average Price Median Price New Listings Active Listings Avg. SP/LP Avg. LDOM Abc Abc Abc Abc Abc Abc Abc Abc Abc Abc Abc Abc Abc Abc Abc Abc Abc Abc Abc Abc Abc Abc Abc Abc Abc Abc Abc Abc Abc Abc Abc Abc Abc Abc Abc Abc Abc Abc Abc Abc Abc All TRREB Areas Halton Region Halton Region Burlington Halton Hills Milton Milton Oakville Peel Region Brampton Brampton Caledon Mississauga City of Toronto City of Toronto Toronto West Toronto Central Toronto East Toronto East York Region Aurora East Gwillimbury East Gwillimbury Georgina King Markham Markham Newmarket Richmond Hill Richmond Hill Vaughan Vaughan Stouffville Durham Region Durham Region Ajax Ajax Brock Clarington Clarington Oshawa Oshawa Pickering Scugog Scugog Uxbridge Uxbridge Whitby Dufferin County Dufferin County Orangeville Orangeville Simcoe County Adjala-Tosorontio Adjala-Tosorontio Bradford Bradford Essa Innisfil Innisfil New Tecumseth 527 78 78 46 3 6 6 23 162 57 57 0 105 154 154 54 54 46 46 60 3 0 0 0 1 31 31 4 7 7 12 12 2 66 66 9 9 1 5 5 26 26 15 0 0 2 2 8 3 3 3 3 4 0 0 0 0 0 2 2 2 $428,469,923 $63,596,983 $63,596,983 $38,035,715 $1,972,900 $4,690,000 $4,690,000 $18,898,368 $128,501,951 $41,542,800 $41,542,800 $86,959,151 $129,648,230 $129,648,230 $40,954,100 $54,322,300 $34,371,830 $34,371,830 $56,662,207 $2,582,000 $991,000 $30,558,483 $30,558,483 $3,808,000 $6,001,277 $6,001,277 $11,234,447 $11,234,447 $1,487,000 $45,291,052 $45,291,052 $6,597,000 $6,597,000 $543,000 $3,360,000 $3,360,000 $16,656,352 $16,656,352 $10,643,700 $1,477,000 $1,477,000 $6,014,000 $1,630,000 $1,630,000 $1,630,000 $1,630,000 $3,139,500 $1,834,500 $1,834,500 $1,305,000 $813,036 $815,346 $815,346 $826,863 $657,633 $781,667 $781,667 $821,668 $793,222 $728,821 $728,821 $828,182 $841,872 $841,872 $758,409 $1,005,969 $747,214 $747,214 $944,370 $860,667 $991,000 $985,758 $985,758 $952,000 $857,325 $857,325 $936,204 $936,204 $743,500 $686,228 $686,228 $733,000 $733,000 $543,000 $672,000 $672,000 $640,629 $640,629 $709,580 $738,500 $738,500 $751,750 $543,333 $543,333 $543,333 $543,333 $784,875 $917,250 $917,250 $652,500 $773,000 $776,000 $776,000 $782,500 $633,000 $785,000 $785,000 $777,000 $776,250 $716,000 $716,000 $800,000 $790,000 $790,000 $730,400 $944,500 $752,500 $752,500 $897,500 $855,000 $991,000 $913,000 $913,000 $830,000 $825,000 $825,000 $869,500 $869,500 $743,500 $700,000 $700,000 $730,000 $730,000 $543,000 $710,000 $710,000 $647,500 $647,500 $700,000 $738,500 $738,500 $763,000 $560,000 $560,000 $560,000 $560,000 $662,500 $917,250 $917,250 $652,500 842 101 101 55 6 10 10 30 233 68 68 1 164 285 285 99 107 79 79 117 11 0 0 2 0 43 43 11 14 14 29 29 7 100 100 9 9 1 6 6 48 48 24 0 0 0 0 12 4 4 4 4 2 0 0 0 0 0 1 1 1 726 74 74 36 4 7 7 27 191 59 59 1 131 283 283 105 107 71 71 107 10 0 0 2 1 23 23 10 17 17 37 37 7 66 66 6 6 0 5 5 27 27 19 0 0 0 0 9 1 1 1 1 4 0 0 0 0 0 4 4 0 102% 100% 100% 99% 100% 105% 105% 101% 101% 101% 101% 101% 103% 103% 101% 103% 105% 105% 104% 105% 90% 105% 105% 104% 102% 102% 102% 102% 112% 104% 104% 106% 106% 97% 99% 99% 105% 105% 104% 97% 97% 106% 97% 97% 97% 97% 97% 95% 95% 99% 17 18 18 21 20 7 7 16 19 22 22 18 17 17 23 14 15 15 16 7 13 15 15 11 20 20 23 23 10 12 12 15 15 14 16 16 12 12 10 17 17 7 13 13 13 13 34 54 54 15 Toronto Regional Real Estate Board SUMMARY OF EXISTING HOME TRANSACTIONS Condo Townhouse, March 2023 Market Watch, March 2023 Copyright 2023 Toronto Regional Real Estate Board 13 ALL TRREB AREAS
- 14. Sales Dollar Volume Average Price Median Price New Listings Active Listings Avg. SP/LP Avg. LDOM Abc Abc Abc Abc Abc Abc Abc Abc Abc Abc Abc Abc Abc Abc Abc Abc Abc Abc Abc Abc Abc Abc Abc Abc Abc Abc Abc Abc Abc Abc Abc Abc Abc Abc Abc Abc Abc Abc Abc Abc All TRREB Areas All TRREB Areas City of Toronto City of Toronto Toronto West Toronto W01 Toronto W02 Toronto W02 Toronto W03 Toronto W03 Toronto W04 Toronto W05 Toronto W06 Toronto W06 Toronto W07 Toronto W07 Toronto W08 Toronto W09 Toronto W10 Toronto W10 Toronto Central Toronto Central Toronto C01 Toronto C02 Toronto C03 Toronto C03 Toronto C04 Toronto C04 Toronto C06 Toronto C07 Toronto C08 Toronto C08 Toronto C09 Toronto C09 Toronto C10 Toronto C11 Toronto C12 Toronto C12 Toronto C13 Toronto C13 Toronto C14 Toronto C15 Toronto East Toronto East Toronto E01 Toronto E01 Toronto E02 Toronto E03 Toronto E04 Toronto E04 Toronto E05 Toronto E05 Toronto E06 Toronto E07 Toronto E08 Toronto E08 Toronto E09 Toronto E09 Toronto E10 Toronto E11 527 527 154 154 54 5 4 4 0 0 9 14 10 10 0 0 8 0 4 4 54 54 13 2 0 0 0 0 0 2 0 0 0 0 2 0 5 5 5 5 12 13 46 46 2 2 1 1 4 4 13 13 0 4 1 1 6 6 4 10 $428,469,923 $428,469,923 $129,648,230 $129,648,230 $40,954,100 $4,351,000 $3,625,000 $3,625,000 $6,718,900 $8,938,800 $8,636,000 $8,636,000 $6,276,400 $2,408,000 $2,408,000 $54,322,300 $54,322,300 $11,577,000 $3,425,000 $1,521,000 $1,835,000 $6,293,000 $6,293,000 $4,728,000 $4,728,000 $12,747,500 $12,195,800 $34,371,830 $34,371,830 $2,177,880 $2,177,880 $710,000 $840,000 $2,827,900 $2,827,900 $9,967,688 $9,967,688 $3,479,688 $885,000 $885,000 $3,779,000 $3,779,000 $2,532,000 $7,172,674 $813,036 $813,036 $841,872 $841,872 $758,409 $870,200 $906,250 $906,250 $746,544 $638,486 $863,600 $863,600 $784,550 $602,000 $602,000 $1,005,969 $1,005,969 $890,538 $1,712,500 $760,500 $917,500 $1,258,600 $1,258,600 $945,600 $945,600 $1,062,292 $938,138 $747,214 $747,214 $1,088,940 $1,088,940 $710,000 $840,000 $706,975 $706,975 $766,745 $766,745 $869,922 $885,000 $885,000 $629,833 $629,833 $633,000 $717,267 $773,000 $773,000 $790,000 $790,000 $730,400 $775,000 $897,500 $897,500 $695,000 $660,000 $872,000 $872,000 $695,000 $602,000 $602,000 $944,500 $944,500 $795,000 $1,712,500 $760,500 $917,500 $1,235,000 $1,235,000 $915,000 $915,000 $1,059,500 $900,000 $752,500 $752,500 $1,088,940 $1,088,940 $710,000 $840,000 $740,000 $740,000 $780,000 $780,000 $878,400 $885,000 $885,000 $615,500 $615,500 $617,500 $742,500 842 842 285 285 99 5 7 7 3 3 15 23 18 18 0 0 17 1 10 10 107 107 17 8 0 0 2 2 4 11 4 4 2 2 4 0 12 12 9 9 15 19 79 79 4 4 1 1 10 10 15 15 1 10 8 8 4 4 8 17 726 726 283 283 105 3 5 5 5 5 20 29 13 13 0 0 17 1 12 12 107 107 11 14 0 0 5 5 6 14 6 6 3 3 5 0 8 8 6 6 12 17 71 71 4 4 1 0 8 8 10 10 3 8 13 13 3 3 8 13 102% 102% 103% 103% 101% 101% 102% 102% 100% 100% 102% 102% 103% 97% 97% 103% 103% 103% 100% 104% 108% 101% 101% 102% 102% 106% 102% 105% 105% 97% 97% 94% 99% 108% 108% 107% 107% 113% 118% 118% 103% 103% 96% 103% 17 17 17 17 23 14 19 19 19 28 7 7 44 22 22 14 14 11 20 13 7 14 14 11 11 23 11 15 15 9 9 33 8 10 10 12 12 9 8 8 16 16 24 18 Toronto Regional Real Estate Board SUMMARY OF EXISTING HOME TRANSACTIONS Condo Townhouse, March 2023 Market Watch, March 2023 Copyright 2023 Toronto Regional Real Estate Board 14 City of Toronto Municipal Breakdown
- 15. Sales Dollar Volume Average Price Median Price New Listings Active Listings Avg. SP/LP Avg. LDOM Abc Abc Abc Abc Abc Abc Abc Abc Abc Abc Abc Abc Abc Abc Abc Abc Abc Abc Abc Abc Abc Abc Abc Abc Abc Abc Abc Abc Abc Abc Abc Abc Abc Abc Abc Abc Abc Abc Abc Abc Abc All TRREB Areas Halton Region Halton Region Burlington Halton Hills Milton Milton Oakville Peel Region Brampton Brampton Caledon Mississauga City of Toronto City of Toronto Toronto West Toronto Central Toronto East Toronto East York Region Aurora East Gwillimbury East Gwillimbury Georgina King Markham Markham Newmarket Richmond Hill Richmond Hill Vaughan Vaughan Stouffville Durham Region Durham Region Ajax Ajax Brock Clarington Clarington Oshawa Oshawa Pickering Scugog Scugog Uxbridge Uxbridge Whitby Dufferin County Dufferin County Orangeville Orangeville Simcoe County Adjala-Tosorontio Adjala-Tosorontio Bradford Bradford Essa Innisfil Innisfil New Tecumseth 2,121 132 132 65 2 16 16 49 256 54 54 2 200 1,410 1,410 275 926 209 209 239 5 0 0 1 4 75 75 2 52 52 95 95 5 76 76 9 9 0 11 11 22 22 23 0 0 0 0 11 2 2 2 2 6 0 0 0 0 0 2 2 4 $1,492,263,353 $89,286,439 $89,286,439 $37,824,139 $1,035,000 $10,667,800 $10,667,800 $39,759,500 $155,176,576 $30,507,000 $30,507,000 $1,718,000 $122,951,576 $1,033,451,717 $1,033,451,717 $178,828,739 $728,479,103 $126,143,875 $126,143,875 $166,835,666 $3,278,900 $545,000 $2,551,500 $53,401,865 $53,401,865 $1,317,000 $35,464,476 $35,464,476 $66,088,925 $66,088,925 $4,188,000 $42,568,955 $42,568,955 $5,032,566 $5,032,566 $6,333,000 $6,333,000 $9,968,500 $9,968,500 $14,081,000 $7,153,889 $978,000 $978,000 $978,000 $978,000 $3,966,000 $1,633,000 $1,633,000 $2,333,000 $703,566 $676,412 $676,412 $581,910 $517,500 $666,738 $666,738 $811,418 $606,159 $564,944 $564,944 $859,000 $614,758 $732,944 $732,944 $650,286 $786,694 $603,559 $603,559 $698,057 $655,780 $545,000 $637,875 $712,025 $712,025 $658,500 $682,009 $682,009 $695,673 $695,673 $837,600 $560,118 $560,118 $559,174 $559,174 $575,727 $575,727 $453,114 $453,114 $612,217 $650,354 $489,000 $489,000 $489,000 $489,000 $661,000 $816,500 $816,500 $583,250 $638,000 $585,000 $585,000 $540,000 $517,500 $660,000 $660,000 $630,000 $590,000 $565,000 $565,000 $859,000 $595,500 $655,000 $655,000 $610,000 $698,750 $562,000 $562,000 $668,000 $640,000 $545,000 $577,250 $698,000 $698,000 $658,500 $656,500 $656,500 $665,000 $665,000 $905,000 $546,750 $546,750 $535,000 $535,000 $595,000 $595,000 $495,500 $495,500 $605,000 $640,000 $489,000 $489,000 $489,000 $489,000 $664,000 $816,500 $816,500 $585,000 3,600 194 194 77 4 24 24 89 396 64 64 2 330 2,469 2,469 493 1,639 337 337 396 8 0 0 3 5 112 112 5 81 81 168 168 14 121 121 11 11 0 39 39 28 28 25 0 0 0 0 18 5 5 5 5 19 0 0 1 1 0 12 12 6 3,930 259 259 104 5 27 27 123 408 74 74 2 332 2,675 2,675 535 1,830 310 310 419 9 0 0 5 5 101 101 14 85 85 181 181 19 124 124 6 6 0 41 41 37 37 22 0 0 2 2 16 9 9 9 9 36 0 0 2 2 0 27 27 7 99% 98% 98% 98% 101% 97% 97% 97% 99% 100% 100% 98% 99% 100% 100% 99% 100% 101% 101% 99% 97% 99% 97% 101% 101% 96% 98% 98% 99% 99% 101% 99% 99% 102% 102% 98% 98% 99% 99% 99% 100% 96% 96% 96% 96% 96% 93% 93% 98% 24 33 33 38 17 26 26 29 23 25 25 3 23 22 22 26 22 20 20 27 35 64 44 23 23 46 26 26 28 28 13 25 25 8 8 39 39 30 30 24 15 38 38 38 38 41 49 49 37 Toronto Regional Real Estate Board SUMMARY OF EXISTING HOME TRANSACTIONS Condo Apartment, March 2023 Market Watch, March 2023 Copyright 2023 Toronto Regional Real Estate Board 15 ALL TRREB AREAS
- 16. Sales Dollar Volume Average Price Median Price New Listings Active Listings Avg. SP/LP Avg. LDOM Abc Abc Abc Abc Abc Abc Abc Abc Abc Abc Abc Abc Abc Abc Abc Abc Abc Abc Abc Abc Abc Abc Abc Abc Abc Abc Abc Abc Abc Abc Abc Abc Abc Abc Abc Abc Abc Abc Abc Abc All TRREB Areas All TRREB Areas City of Toronto City of Toronto Toronto West Toronto W01 Toronto W02 Toronto W02 Toronto W03 Toronto W03 Toronto W04 Toronto W05 Toronto W06 Toronto W06 Toronto W07 Toronto W07 Toronto W08 Toronto W09 Toronto W10 Toronto W10 Toronto Central Toronto Central Toronto C01 Toronto C02 Toronto C03 Toronto C03 Toronto C04 Toronto C04 Toronto C06 Toronto C07 Toronto C08 Toronto C08 Toronto C09 Toronto C09 Toronto C10 Toronto C11 Toronto C12 Toronto C12 Toronto C13 Toronto C13 Toronto C14 Toronto C15 Toronto East Toronto East Toronto E01 Toronto E01 Toronto E02 Toronto E03 Toronto E04 Toronto E04 Toronto E05 Toronto E05 Toronto E06 Toronto E07 Toronto E08 Toronto E08 Toronto E09 Toronto E09 Toronto E10 Toronto E11 2,121 2,121 1,410 1,410 275 16 19 19 3 3 22 30 73 73 5 5 76 12 19 19 926 926 339 39 14 14 10 10 15 54 182 182 12 12 55 17 5 5 34 34 79 71 209 209 20 20 11 11 28 28 29 29 5 30 21 21 35 35 8 11 $1,492,263,353 $1,492,263,353 $1,033,451,717 $1,033,451,717 $178,828,739 $12,399,400 $13,935,250 $13,935,250 $1,660,000 $1,660,000 $12,447,800 $15,254,800 $54,891,277 $54,891,277 $3,225,000 $3,225,000 $48,288,512 $6,681,100 $10,045,600 $10,045,600 $728,479,103 $728,479,103 $263,650,169 $49,330,800 $9,704,008 $9,704,008 $11,234,000 $11,234,000 $8,989,900 $37,860,838 $140,637,028 $140,637,028 $13,440,000 $13,440,000 $43,643,398 $10,241,000 $8,856,000 $8,856,000 $24,363,007 $24,363,007 $55,983,948 $50,545,007 $126,143,875 $126,143,875 $15,208,899 $15,208,899 $9,888,000 $6,639,500 $14,956,500 $14,956,500 $17,944,800 $17,944,800 $3,362,000 $17,020,900 $11,433,700 $11,433,700 $20,221,788 $20,221,788 $3,562,900 $5,904,888 $703,566 $703,566 $732,944 $732,944 $650,286 $774,963 $733,434 $733,434 $553,333 $553,333 $565,809 $508,493 $751,935 $751,935 $645,000 $645,000 $635,375 $556,758 $528,716 $528,716 $786,694 $786,694 $777,729 $1,264,892 $693,143 $693,143 $1,123,400 $1,123,400 $599,327 $701,127 $772,731 $772,731 $1,120,000 $1,120,000 $793,516 $602,412 $1,771,200 $1,771,200 $716,559 $716,559 $708,658 $711,902 $603,559 $603,559 $760,445 $760,445 $898,909 $603,591 $534,161 $534,161 $618,786 $618,786 $672,400 $567,363 $544,462 $544,462 $577,765 $577,765 $445,363 $536,808 $638,000 $638,000 $655,000 $655,000 $610,000 $780,000 $705,000 $705,000 $500,000 $500,000 $577,500 $527,500 $699,900 $699,900 $673,000 $673,000 $605,000 $557,500 $525,000 $525,000 $698,750 $698,750 $712,000 $1,000,000 $737,450 $737,450 $952,500 $952,500 $570,000 $672,275 $694,250 $694,250 $950,000 $950,000 $708,000 $538,000 $1,151,000 $1,151,000 $661,500 $661,500 $679,000 $668,000 $562,000 $562,000 $773,750 $773,750 $775,000 $540,000 $535,500 $535,500 $615,000 $615,000 $645,000 $566,000 $520,000 $520,000 $560,000 $560,000 $425,000 $535,000 3,600 3,600 2,469 2,469 493 41 31 31 13 13 42 51 119 119 15 15 128 16 37 37 1,639 1,639 580 109 34 34 31 31 29 71 364 364 17 17 103 36 6 6 44 44 101 114 337 337 21 21 24 15 35 35 57 57 16 46 35 35 39 39 12 37 3,930 3,930 2,675 2,675 535 53 34 34 8 8 54 62 120 120 15 15 126 22 41 41 1,830 1,830 677 146 33 33 42 42 31 71 412 412 16 16 112 42 7 7 43 43 83 115 310 310 14 14 32 15 35 35 54 54 19 43 31 31 28 28 8 31 99% 99% 100% 100% 99% 99% 99% 99% 97% 97% 99% 99% 99% 99% 100% 100% 99% 98% 99% 99% 100% 100% 100% 97% 100% 100% 95% 95% 98% 101% 100% 100% 96% 96% 100% 101% 95% 95% 99% 99% 100% 101% 101% 101% 100% 100% 102% 101% 102% 102% 102% 102% 100% 102% 99% 99% 102% 102% 99% 100% 24 24 22 22 26 23 33 33 18 18 30 33 24 24 14 14 24 30 22 22 22 22 21 34 19 19 51 51 15 20 21 21 32 32 17 25 12 12 18 18 23 24 20 20 22 22 8 22 16 16 21 21 16 22 28 28 20 20 19 15 Toronto Regional Real Estate Board SUMMARY OF EXISTING HOME TRANSACTIONS Condo Apartment, March 2023 Market Watch, March 2023 Copyright 2023 Toronto Regional Real Estate Board 16 City of Toronto Municipal Breakdown
- 17. Sales Dollar Volume Average Price Median Price New Listings Active Listings Avg. SP/LP Avg. LDOM Abc Abc Abc Abc Abc Abc Abc Abc Abc Abc Abc Abc Abc Abc Abc Abc Abc Abc Abc Abc Abc Abc Abc Abc Abc Abc Abc Abc Abc Abc Abc Abc Abc Abc Abc Abc Abc Abc Abc Abc Abc All TRREB Areas Halton Region Halton Region Burlington Halton Hills Milton Milton Oakville Peel Region Brampton Brampton Caledon Mississauga City of Toronto City of Toronto Toronto West Toronto Central Toronto East Toronto East York Region Aurora East Gwillimbury East Gwillimbury Georgina King Markham Markham Newmarket Richmond Hill Richmond Hill Vaughan Vaughan Stouffville Durham Region Durham Region Ajax Ajax Brock Clarington Clarington Oshawa Oshawa Pickering Scugog Scugog Uxbridge Uxbridge Whitby Dufferin County Dufferin County Orangeville Orangeville Simcoe County Adjala-Tosorontio Adjala-Tosorontio Bradford Bradford Essa Innisfil Innisfil New Tecumseth 34 5 5 2 0 1 1 2 3 1 1 0 2 4 4 0 3 1 1 14 0 0 0 0 1 11 11 0 1 1 1 1 0 5 5 1 1 0 2 2 1 1 0 0 0 1 1 0 0 0 0 0 3 0 0 0 0 0 1 1 2 $38,105,853 $5,285,000 $5,285,000 $1,785,000 $1,005,000 $1,005,000 $2,495,000 $3,139,000 $840,000 $840,000 $2,299,000 $4,670,000 $4,670,000 $3,670,000 $1,000,000 $1,000,000 $18,522,853 $1,785,888 $14,090,965 $14,090,965 $1,115,000 $1,115,000 $1,531,000 $1,531,000 $4,208,000 $4,208,000 $875,000 $875,000 $1,458,000 $1,458,000 $940,000 $940,000 $935,000 $935,000 $2,281,000 $842,000 $842,000 $1,439,000 $1,120,760 $1,057,000 $1,057,000 $892,500 $1,005,000 $1,005,000 $1,247,500 $1,046,333 $840,000 $840,000 $1,149,500 $1,167,500 $1,167,500 $1,223,333 $1,000,000 $1,000,000 $1,323,061 $1,785,888 $1,280,997 $1,280,997 $1,115,000 $1,115,000 $1,531,000 $1,531,000 $841,600 $841,600 $875,000 $875,000 $729,000 $729,000 $940,000 $940,000 $935,000 $935,000 $760,333 $842,000 $842,000 $719,500 $1,070,000 $1,005,000 $1,005,000 $892,500 $1,005,000 $1,005,000 $1,247,500 $1,129,000 $840,000 $840,000 $1,149,500 $1,165,000 $1,165,000 $1,280,000 $1,000,000 $1,000,000 $1,357,500 $1,785,888 $1,345,000 $1,345,000 $1,115,000 $1,115,000 $1,531,000 $1,531,000 $875,000 $875,000 $875,000 $875,000 $729,000 $729,000 $940,000 $940,000 $935,000 $935,000 $740,000 $842,000 $842,000 $719,500 39 4 4 0 1 2 2 1 6 3 3 0 3 2 2 0 0 2 2 18 0 0 0 0 0 15 15 0 2 2 1 1 0 5 5 1 1 0 1 1 1 1 0 0 0 1 1 1 0 0 0 0 4 0 0 0 0 2 1 1 1 20 2 2 0 1 1 1 0 3 2 2 0 1 1 1 0 0 1 1 9 0 0 0 0 0 6 6 0 3 3 0 0 0 2 2 0 0 0 0 0 1 1 0 0 0 0 0 1 1 1 1 1 2 0 0 0 0 2 0 0 0 106% 98% 98% 97% 101% 101% 98% 111% 96% 96% 118% 98% 98% 98% 100% 100% 111% 98% 116% 116% 93% 93% 99% 99% 107% 107% 117% 117% 102% 102% 118% 118% 98% 98% 98% 97% 97% 98% 11 8 8 14 1 1 7 8 5 5 10 31 31 37 12 12 9 25 8 8 7 7 1 1 8 8 13 13 7 7 5 5 10 10 8 5 5 9 Toronto Regional Real Estate Board SUMMARY OF EXISTING HOME TRANSACTIONS Link, March 2023 Market Watch, March 2023 Copyright 2023 Toronto Regional Real Estate Board 17 ALL TRREB AREAS
- 18. Sales Dollar Volume Average Price Median Price New Listings Active Listings Avg. SP/LP Avg. LDOM Abc Abc Abc Abc Abc Abc Abc Abc Abc Abc Abc Abc Abc Abc Abc Abc Abc Abc Abc Abc Abc Abc Abc Abc Abc Abc Abc Abc Abc Abc Abc Abc Abc Abc Abc Abc Abc Abc Abc Abc All TRREB Areas All TRREB Areas City of Toronto City of Toronto Toronto West Toronto W01 Toronto W02 Toronto W02 Toronto W03 Toronto W03 Toronto W04 Toronto W05 Toronto W06 Toronto W06 Toronto W07 Toronto W07 Toronto W08 Toronto W09 Toronto W10 Toronto W10 Toronto Central Toronto Central Toronto C01 Toronto C02 Toronto C03 Toronto C03 Toronto C04 Toronto C04 Toronto C06 Toronto C07 Toronto C08 Toronto C08 Toronto C09 Toronto C09 Toronto C10 Toronto C11 Toronto C12 Toronto C12 Toronto C13 Toronto C13 Toronto C14 Toronto C15 Toronto East Toronto East Toronto E01 Toronto E01 Toronto E02 Toronto E03 Toronto E04 Toronto E04 Toronto E05 Toronto E05 Toronto E06 Toronto E07 Toronto E08 Toronto E08 Toronto E09 Toronto E09 Toronto E10 Toronto E11 34 34 4 4 0 0 0 0 0 0 0 0 0 0 0 0 0 0 0 0 3 3 0 0 0 0 0 0 0 1 0 0 0 0 0 0 0 0 0 0 0 2 1 1 0 0 0 0 0 0 0 0 0 0 0 0 0 0 0 1 $38,105,853 $38,105,853 $4,670,000 $4,670,000 $3,670,000 $3,670,000 $1,050,000 $2,620,000 $1,000,000 $1,000,000 $1,000,000 $1,120,760 $1,120,760 $1,167,500 $1,167,500 $1,223,333 $1,223,333 $1,050,000 $1,310,000 $1,000,000 $1,000,000 $1,000,000 $1,070,000 $1,070,000 $1,165,000 $1,165,000 $1,280,000 $1,280,000 $1,050,000 $1,310,000 $1,000,000 $1,000,000 $1,000,000 39 39 2 2 0 0 0 0 0 0 0 0 0 0 0 0 0 0 0 0 0 0 0 0 0 0 0 0 0 0 0 0 0 0 0 0 0 0 0 0 0 0 2 2 0 0 0 0 0 0 1 1 0 0 0 0 0 0 0 1 20 20 1 1 0 0 0 0 0 0 0 0 0 0 0 0 0 0 0 0 0 0 0 0 0 0 0 0 0 0 0 0 0 0 0 0 0 0 0 0 0 0 1 1 0 0 0 0 0 0 1 1 0 0 0 0 0 0 0 0 106% 106% 98% 98% 98% 98% 97% 98% 100% 100% 100% 11 11 31 31 37 37 37 37 12 12 12 Toronto Regional Real Estate Board SUMMARY OF EXISTING HOME TRANSACTIONS Link, March 2023 Market Watch, March 2023 Copyright 2023 Toronto Regional Real Estate Board 18 City of Toronto Municipal Breakdown
- 19. Sales Dollar Volume Average Price Median Price New Listings Active Listings Avg. SP/LP Avg. LDOM Abc Abc Abc Abc Abc Abc Abc Abc Abc Abc Abc Abc Abc Abc Abc Abc Abc Abc Abc Abc Abc Abc Abc Abc Abc Abc Abc Abc Abc Abc Abc Abc Abc Abc Abc Abc Abc Abc Abc Abc Abc All TRREB Areas Halton Region Halton Region Burlington Halton Hills Milton Milton Oakville Peel Region Brampton Brampton Caledon Mississauga City of Toronto City of Toronto Toronto West Toronto Central Toronto East Toronto East York Region Aurora East Gwillimbury East Gwillimbury Georgina King Markham Markham Newmarket Richmond Hill Richmond Hill Vaughan Vaughan Stouffville Durham Region Durham Region Ajax Ajax Brock Clarington Clarington Oshawa Oshawa Pickering Scugog Scugog Uxbridge Uxbridge Whitby Dufferin County Dufferin County Orangeville Orangeville Simcoe County Adjala-Tosorontio Adjala-Tosorontio Bradford Bradford Essa Innisfil Innisfil New Tecumseth 8 0 0 0 0 0 0 0 0 0 0 0 0 7 7 5 0 2 2 1 0 0 0 0 0 0 0 1 0 0 0 0 0 0 0 0 0 0 0 0 0 0 0 0 0 0 0 0 0 0 0 0 0 0 0 0 0 0 0 0 0 $3,430,500 $2,790,500 $2,790,500 $1,728,000 $1,062,500 $1,062,500 $640,000 $640,000 $428,813 $398,643 $398,643 $345,600 $531,250 $531,250 $640,000 $640,000 $350,000 $340,000 $340,000 $340,000 $531,250 $531,250 $640,000 $640,000 20 3 3 3 0 0 0 0 0 0 0 0 0 14 14 4 5 5 5 3 0 0 0 0 0 1 1 1 0 0 1 1 0 0 0 0 0 0 0 0 0 0 0 0 0 0 0 0 0 0 0 0 0 0 0 0 0 0 0 0 0 25 3 3 3 0 0 0 0 0 0 0 0 0 20 20 7 7 6 6 1 0 0 0 0 0 1 1 0 0 0 0 0 0 1 1 0 0 0 0 0 1 1 0 0 0 0 0 0 0 0 0 0 0 0 0 0 0 0 0 0 0 97% 96% 96% 94% 100% 100% 98% 98% 34 39 39 43 30 30 3 3 Toronto Regional Real Estate Board SUMMARY OF EXISTING HOME TRANSACTIONS Co-Op Apartment, March 2023 Market Watch, March 2023 Copyright 2023 Toronto Regional Real Estate Board 19 ALL TRREB AREAS
- 20. Sales Dollar Volume Average Price Median Price New Listings Active Listings Avg. SP/LP Avg. LDOM Abc Abc Abc Abc Abc Abc Abc Abc Abc Abc Abc Abc Abc Abc Abc Abc Abc Abc Abc Abc Abc Abc Abc Abc Abc Abc Abc Abc Abc Abc Abc Abc Abc Abc Abc Abc Abc Abc Abc Abc All TRREB Areas All TRREB Areas City of Toronto City of Toronto Toronto West Toronto W01 Toronto W02 Toronto W02 Toronto W03 Toronto W03 Toronto W04 Toronto W05 Toronto W06 Toronto W06 Toronto W07 Toronto W07 Toronto W08 Toronto W09 Toronto W10 Toronto W10 Toronto Central Toronto Central Toronto C01 Toronto C02 Toronto C03 Toronto C03 Toronto C04 Toronto C04 Toronto C06 Toronto C07 Toronto C08 Toronto C08 Toronto C09 Toronto C09 Toronto C10 Toronto C11 Toronto C12 Toronto C12 Toronto C13 Toronto C13 Toronto C14 Toronto C15 Toronto East Toronto East Toronto E01 Toronto E01 Toronto E02 Toronto E03 Toronto E04 Toronto E04 Toronto E05 Toronto E05 Toronto E06 Toronto E07 Toronto E08 Toronto E08 Toronto E09 Toronto E09 Toronto E10 Toronto E11 8 8 7 7 5 0 0 0 0 0 0 1 3 3 0 0 1 0 0 0 0 0 0 0 0 0 0 0 0 0 0 0 0 0 0 0 0 0 0 0 0 0 2 2 0 0 1 0 0 0 0 0 0 0 0 0 0 0 1 0 $3,430,500 $3,430,500 $2,790,500 $2,790,500 $1,728,000 $300,000 $1,008,000 $1,008,000 $420,000 $1,062,500 $1,062,500 $790,000 $272,500 $428,813 $428,813 $398,643 $398,643 $345,600 $300,000 $336,000 $336,000 $420,000 $531,250 $531,250 $790,000 $272,500 $350,000 $350,000 $340,000 $340,000 $340,000 $300,000 $340,000 $340,000 $420,000 $531,250 $531,250 $790,000 $272,500 20 20 14 14 4 0 1 1 0 0 0 1 2 2 0 0 0 0 0 0 5 5 0 0 1 1 1 1 0 0 0 0 3 3 0 0 0 0 0 0 0 0 5 5 0 0 0 0 0 0 0 0 0 1 0 0 0 0 4 0 25 25 20 20 7 0 1 1 0 0 0 0 4 4 0 0 2 0 0 0 7 7 0 0 1 1 1 1 0 0 0 0 5 5 0 0 0 0 0 0 0 0 6 6 0 0 0 0 0 0 0 0 0 1 0 0 0 0 5 0 97% 97% 96% 96% 94% 86% 96% 96% 96% 100% 100% 99% 103% 34 34 39 39 43 14 32 32 103 30 30 36 23 Toronto Regional Real Estate Board SUMMARY OF EXISTING HOME TRANSACTIONS Co-Op Apartment, March 2023 Market Watch, March 2023 Copyright 2023 Toronto Regional Real Estate Board 20 City of Toronto Municipal Breakdown
- 21. Sales Dollar Volume Average Price Median Price New Listings Active Listings Avg. SP/LP Avg. LDOM Abc Abc Abc Abc Abc Abc Abc Abc Abc Abc Abc Abc Abc Abc Abc Abc Abc Abc Abc Abc Abc Abc Abc Abc Abc Abc Abc Abc Abc Abc Abc Abc Abc Abc Abc Abc Abc Abc Abc Abc Abc All TRREB Areas Halton Region Halton Region Burlington Halton Hills Milton Milton Oakville Peel Region Brampton Brampton Caledon Mississauga City of Toronto City of Toronto Toronto West Toronto Central Toronto East Toronto East York Region Aurora East Gwillimbury East Gwillimbury Georgina King Markham Markham Newmarket Richmond Hill Richmond Hill Vaughan Vaughan Stouffville Durham Region Durham Region Ajax Ajax Brock Clarington Clarington Oshawa Oshawa Pickering Scugog Scugog Uxbridge Uxbridge Whitby Dufferin County Dufferin County Orangeville Orangeville Simcoe County Adjala-Tosorontio Adjala-Tosorontio Bradford Bradford Essa Innisfil Innisfil New Tecumseth 8 0 0 0 0 0 0 0 3 2 2 0 1 0 0 0 0 0 0 1 0 0 0 0 0 0 0 0 0 0 1 1 0 1 1 1 1 0 0 0 0 0 0 0 0 0 0 0 0 0 0 0 3 0 0 0 0 0 0 0 3 $7,611,450 $3,155,000 $2,350,000 $2,350,000 $805,000 $1,392,450 $1,392,450 $1,392,450 $600,000 $600,000 $600,000 $600,000 $2,464,000 $2,464,000 $951,431 $1,051,667 $1,175,000 $1,175,000 $805,000 $1,392,450 $1,392,450 $1,392,450 $600,000 $600,000 $600,000 $600,000 $821,333 $821,333 $952,500 $1,170,000 $1,175,000 $1,175,000 $805,000 $1,392,450 $1,392,450 $1,392,450 $600,000 $600,000 $600,000 $600,000 $747,000 $747,000 15 1 1 1 0 0 0 0 8 5 5 0 3 1 1 0 0 1 1 0 0 0 0 0 0 0 0 0 0 0 0 0 0 1 1 1 1 0 0 0 0 0 0 0 0 0 0 0 0 0 0 0 4 0 0 0 0 0 0 0 4 17 1 1 1 0 0 0 0 5 3 3 0 2 1 1 0 0 1 1 0 0 0 0 0 0 0 0 0 0 0 0 0 0 1 1 1 1 0 0 0 0 0 0 0 0 0 0 0 0 0 0 0 9 0 0 0 0 0 0 0 9 100% 108% 108% 108% 107% 91% 91% 91% 104% 104% 104% 104% 97% 97% 31 29 33 33 20 31 31 31 4 4 4 4 43 43 Toronto Regional Real Estate Board SUMMARY OF EXISTING HOME TRANSACTIONS Detached Condo, March 2023 Market Watch, March 2023 Copyright 2023 Toronto Regional Real Estate Board 21 ALL TRREB AREAS
- 22. Sales Dollar Volume Average Price Median Price New Listings Active Listings Avg. SP/LP Avg. LDOM Abc Abc Abc Abc Abc Abc Abc Abc Abc Abc Abc Abc Abc Abc Abc Abc Abc Abc Abc Abc Abc Abc Abc Abc Abc Abc Abc Abc Abc Abc Abc Abc Abc Abc Abc Abc Abc Abc Abc Abc All TRREB Areas All TRREB Areas City of Toronto City of Toronto Toronto West Toronto W01 Toronto W02 Toronto W02 Toronto W03 Toronto W03 Toronto W04 Toronto W05 Toronto W06 Toronto W06 Toronto W07 Toronto W07 Toronto W08 Toronto W09 Toronto W10 Toronto W10 Toronto Central Toronto Central Toronto C01 Toronto C02 Toronto C03 Toronto C03 Toronto C04 Toronto C04 Toronto C06 Toronto C07 Toronto C08 Toronto C08 Toronto C09 Toronto C09 Toronto C10 Toronto C11 Toronto C12 Toronto C12 Toronto C13 Toronto C13 Toronto C14 Toronto C15 Toronto East Toronto East Toronto E01 Toronto E01 Toronto E02 Toronto E03 Toronto E04 Toronto E04 Toronto E05 Toronto E05 Toronto E06 Toronto E07 Toronto E08 Toronto E08 Toronto E09 Toronto E09 Toronto E10 Toronto E11 8 8 0 0 0 0 0 0 0 0 0 0 0 0 0 0 0 0 0 0 0 0 0 0 0 0 0 0 0 0 0 0 0 0 0 0 0 0 0 0 0 0 0 0 0 0 0 0 0 0 0 0 0 0 0 0 0 0 0 0 $7,611,450 $7,611,450 $951,431 $951,431 $952,500 $952,500 15 15 1 1 0 0 0 0 0 0 0 0 0 0 0 0 0 0 0 0 0 0 0 0 0 0 0 0 0 0 0 0 0 0 0 0 0 0 0 0 0 0 1 1 0 0 0 0 0 0 0 0 0 0 1 1 0 0 0 0 17 17 1 1 0 0 0 0 0 0 0 0 0 0 0 0 0 0 0 0 0 0 0 0 0 0 0 0 0 0 0 0 0 0 0 0 0 0 0 0 0 0 1 1 0 0 0 0 0 0 0 0 0 0 1 1 0 0 0 0 100% 100% 31 31 Toronto Regional Real Estate Board SUMMARY OF EXISTING HOME TRANSACTIONS Detached Condo, March 2023 Market Watch, March 2023 Copyright 2023 Toronto Regional Real Estate Board 22 City of Toronto Municipal Breakdown
- 23. Sales Dollar Volume Average Price Median Price New Listings Active Listings Avg. SP/LP Avg. LDOM Abc Abc Abc Abc Abc Abc Abc Abc Abc Abc Abc Abc Abc Abc Abc Abc Abc Abc Abc Abc Abc Abc Abc Abc Abc Abc Abc Abc Abc Abc Abc Abc Abc Abc Abc Abc Abc Abc Abc Abc Abc All TRREB Areas Halton Region Halton Region Burlington Halton Hills Milton Milton Oakville Peel Region Brampton Brampton Caledon Mississauga City of Toronto City of Toronto Toronto West Toronto Central Toronto East Toronto East York Region Aurora East Gwillimbury East Gwillimbury Georgina King Markham Markham Newmarket Richmond Hill Richmond Hill Vaughan Vaughan Stouffville Durham Region Durham Region Ajax Ajax Brock Clarington Clarington Oshawa Oshawa Pickering Scugog Scugog Uxbridge Uxbridge Whitby Dufferin County Dufferin County Orangeville Orangeville Simcoe County Adjala-Tosorontio Adjala-Tosorontio Bradford Bradford Essa Innisfil Innisfil New Tecumseth 2 0 0 0 0 0 0 0 0 0 0 0 0 2 2 0 2 0 0 0 0 0 0 0 0 0 0 0 0 0 0 0 0 0 0 0 0 0 0 0 0 0 0 0 0 0 0 0 0 0 0 0 0 0 0 0 0 0 0 0 0 $822,000 $822,000 $822,000 $822,000 $411,000 $411,000 $411,000 $411,000 $411,000 $411,000 $411,000 $411,000 8 0 0 0 0 0 0 0 0 0 0 0 0 8 8 0 7 1 1 0 0 0 0 0 0 0 0 0 0 0 0 0 0 0 0 0 0 0 0 0 0 0 0 0 0 0 0 0 0 0 0 0 0 0 0 0 0 0 0 0 0 14 0 0 0 0 0 0 0 0 0 0 0 0 14 14 2 11 1 1 0 0 0 0 0 0 0 0 0 0 0 0 0 0 0 0 0 0 0 0 0 0 0 0 0 0 0 0 0 0 0 0 0 0 0 0 0 0 0 0 0 0 92% 92% 92% 92% 84 84 84 84 Toronto Regional Real Estate Board SUMMARY OF EXISTING HOME TRANSACTIONS Co-Ownership Apartment, March 2023 Market Watch, March 2023 Copyright 2023 Toronto Regional Real Estate Board 23 ALL TRREB AREAS
- 24. Sales Dollar Volume Average Price Median Price New Listings Active Listings Avg. SP/LP Avg. LDOM Abc Abc Abc Abc Abc Abc Abc Abc Abc Abc Abc Abc Abc Abc Abc Abc Abc Abc Abc Abc Abc Abc Abc Abc Abc Abc Abc Abc Abc Abc Abc Abc Abc Abc Abc Abc Abc Abc Abc Abc All TRREB Areas All TRREB Areas City of Toronto City of Toronto Toronto West Toronto W01 Toronto W02 Toronto W02 Toronto W03 Toronto W03 Toronto W04 Toronto W05 Toronto W06 Toronto W06 Toronto W07 Toronto W07 Toronto W08 Toronto W09 Toronto W10 Toronto W10 Toronto Central Toronto Central Toronto C01 Toronto C02 Toronto C03 Toronto C03 Toronto C04 Toronto C04 Toronto C06 Toronto C07 Toronto C08 Toronto C08 Toronto C09 Toronto C09 Toronto C10 Toronto C11 Toronto C12 Toronto C12 Toronto C13 Toronto C13 Toronto C14 Toronto C15 Toronto East Toronto East Toronto E01 Toronto E01 Toronto E02 Toronto E03 Toronto E04 Toronto E04 Toronto E05 Toronto E05 Toronto E06 Toronto E07 Toronto E08 Toronto E08 Toronto E09 Toronto E09 Toronto E10 Toronto E11 2 2 2 2 0 0 0 0 0 0 0 0 0 0 0 0 0 0 0 0 2 2 1 0 0 0 1 1 0 0 0 0 0 0 0 0 0 0 0 0 0 0 0 0 0 0 0 0 0 0 0 0 0 0 0 0 0 0 0 0 $822,000 $822,000 $822,000 $822,000 $822,000 $822,000 $312,000 $510,000 $510,000 $411,000 $411,000 $411,000 $411,000 $411,000 $411,000 $312,000 $510,000 $510,000 $411,000 $411,000 $411,000 $411,000 $411,000 $411,000 $312,000 $510,000 $510,000 8 8 8 8 0 0 0 0 0 0 0 0 0 0 0 0 0 0 0 0 7 7 2 0 0 0 0 0 0 0 0 0 0 0 0 0 0 0 1 1 4 0 1 1 0 0 1 0 0 0 0 0 0 0 0 0 0 0 0 0 14 14 14 14 2 0 0 0 0 0 0 2 0 0 0 0 0 0 0 0 11 11 2 0 0 0 1 1 0 0 0 0 0 0 0 0 0 0 1 1 7 0 1 1 0 0 1 0 0 0 0 0 0 0 0 0 0 0 0 0 92% 92% 92% 92% 92% 92% 92% 93% 93% 84 84 84 84 84 84 37 131 131 Toronto Regional Real Estate Board SUMMARY OF EXISTING HOME TRANSACTIONS Co-Ownership Apartment, March 2023 Market Watch, March 2023 Copyright 2023 Toronto Regional Real Estate Board 24 City of Toronto Municipal Breakdown
- 25. Index Benchmark Yr./Yr. % Chg. Index Benchmark Yr./Yr. % Chg. Index Benchmark Yr./Yr. % Chg. Index Benchmark Yr./Yr. % Chg. Index Benchmark Yr./Yr. % Chg. 353.5 $1,118,500 -16.21% 364.2 $1,424,500 -17.04% 382.4 $1,084,900 -16.54% 382.5 $818,500 -14.94% 353.6 $703,700 -13.38% 372.6 $1,191,100 -16.44% 394.4 $1,521,100 -16.03% 413.2 $1,044,900 -16.78% 405.7 $834,200 -13.61% 357.2 $609,400 -18.35% 370.8 $1,041,200 -15.36% 411.4 $1,362,100 -14.59% 418.4 $999,500 -14.70% 411.6 $792,000 -14.09% 385.8 $579,100 -18.19% 391.7 $1,161,700 -20.31% 373.3 $1,235,500 -20.57% 404.3 $909,700 -19.32% 457.7 $715,400 -13.31% 343.0 $638,700 -20.07% 332.4 $1,094,700 -18.39% 332.9 $1,419,500 -18.11% 408.0 $985,400 -18.40% 429.7 $810,800 -13.80% 328.9 $618,900 -18.71% 383.6 $1,410,000 -15.38% 404.1 $1,824,400 -14.71% 426.6 $1,181,700 -15.22% 377.7 $914,400 -13.39% 354.7 $650,200 -18.33% 408.6 $1,061,500 -19.63% 370.5 $1,356,300 -20.29% 372.1 $992,700 -20.15% 374.8 $792,600 -17.43% 358.8 $614,700 -17.00% 378.0 $1,038,300 -20.75% 375.1 $1,228,500 -20.98% 391.4 $959,700 -20.69% 386.4 $723,800 -19.38% 388.0 $570,700 -19.83% 373.9 $1,350,900 -23.88% 372.3 $1,445,000 -23.74% 399.5 $995,600 -22.56% 392.3 $920,000 -23.24% 419.9 $1,051,500 -18.12% 370.7 $1,505,700 -19.06% 366.4 $1,049,100 -19.13% 386.8 $822,000 -16.46% 352.2 $623,100 -16.50% 302.3 $1,101,600 -13.21% 378.2 $1,689,500 -14.14% 379.5 $1,286,500 -14.22% 371.2 $877,200 -10.51% 357.2 $741,200 -11.82% 367.5 $1,350,700 -14.08% 373.2 $1,643,700 -14.62% 392.0 $1,182,300 -13.47% 359.3 $918,300 -15.14% 321.1 $676,300 -15.08% 419.9 $1,390,600 -14.38% 393.4 $1,650,800 -14.79% 425.4 $1,105,600 -16.49% 338.0 $929,800 -14.54% 334.9 $639,300 -14.17% 358.6 $1,333,800 -16.97% 354.6 $1,385,600 -17.09% 377.4 $887,700 -16.84% 402.8 $831,800 -17.56% 408.9 $840,300 -17.26% 402.7 $712,700 -18.56% 391.6 $1,870,100 -14.83% 392.9 $2,078,700 -14.83% 337.4 $974,500 -13.18% 314.0 $734,800 -13.76% 381.4 $1,370,100 -13.65% 411.9 $1,827,300 -14.10% 418.0 $1,287,000 -13.24% 362.0 $932,600 -16.46% 314.6 $694,000 -14.53% 376.2 $1,235,700 -15.27% 366.9 $1,366,000 -15.64% 364.9 $1,006,300 -15.88% 405.2 $845,700 -13.84% 326.6 $585,600 -14.05% 367.5 $1,450,500 -12.60% 380.8 $1,910,600 -13.18% 376.0 $1,235,400 -12.48% 331.1 $896,200 -14.51% 326.6 $636,200 -15.89% 335.6 $1,348,400 -13.71% 363.4 $1,745,800 -13.91% 377.1 $1,200,600 -12.10% 359.1 $946,700 -13.93% 310.5 $694,900 -15.51% 359.1 $1,435,800 -15.80% 346.3 $1,599,400 -15.99% 423.0 $1,090,900 -14.09% 460.7 $898,300 -14.45% 330.5 $654,100 -15.04% 393.9 $947,300 -21.75% 385.1 $1,030,200 -21.85% 414.6 $820,500 -21.60% 426.5 $661,000 -20.74% 345.2 $578,500 -20.42% 393.5 $1,016,000 -22.54% 388.6 $1,123,500 -22.51% 389.8 $903,200 -22.24% 396.1 $701,900 -21.00% 340.5 $562,800 -20.46% 345.6 $673,900 -17.68% 347.4 $673,300 -17.62% -100.00% 383.5 $872,400 -18.87% 389.7 $959,100 -18.93% 416.4 $745,400 -16.37% 434.6 $661,900 -23.97% 306.6 $557,100 -19.68% 431.9 $839,600 -22.56% 411.3 $896,700 -22.67% 444.5 $713,400 -22.19% 464.5 $620,600 -22.17% 403.0 $503,800 -20.67% 372.1 $1,036,700 -22.24% 374.2 $1,236,800 -22.30% 386.0 $906,600 -22.27% 397.2 $688,700 -20.99% 333.3 $624,600 -20.00% 343.9 $937,000 -19.67% 341.7 $946,100 -19.86% 351.5 $676,700 -20.58% 369.8 $1,216,200 -18.33% 350.3 $1,265,000 -18.48% 339.7 $884,900 -17.87% 449.7 $707,000 -20.35% 301.7 $727,800 -20.19% 400.3 $1,054,100 -22.36% 393.4 $1,151,500 -23.00% 413.4 $878,100 -22.22% 423.3 $673,500 -13.47% 354.2 $606,700 -20.33% 373.2 $782,900 -21.38% 369.4 $894,300 -20.90% 389.7 $698,800 -19.85% 415.9 $581,900 -21.28% 384.3 $518,000 -19.03% 373.2 $782,900 -21.38% 369.4 $894,300 -20.90% 389.7 $698,800 -19.85% 415.9 $581,900 -21.28% 384.3 $518,000 -19.03% 326.2 $883,800 -18.59% 330.7 $935,600 -18.20% 344.2 $752,100 -17.52% 414.2 $618,000 -23.89% 376.9 $609,400 -14.20% 415.8 $1,168,400 -14.90% 416.3 $1,169,700 -14.88% 398.2 $1,109,300 -15.55% 399.1 $1,170,700 -15.66% 402.5 $901,900 -15.35% 391.2 $628,200 -24.48% 342.0 $582,000 -14.20% 366.2 $771,900 -20.01% 361.6 $825,900 -19.45% 420.7 $670,100 -19.68% 456.5 $614,500 -23.08% 419.3 $805,100 -20.24% 425.6 $817,500 -19.68% 403.2 $650,400 -22.52% 326.4 $300,600 -19.07% 330.1 $634,200 -15.08% 368.8 $844,100 -19.62% 369.7 $954,300 -19.19% 386.7 $694,100 -19.10% 380.3 $688,700 -24.09% 402.2 $598,400 -14.04% Toronto Regional Real Estate Board FOCUS ON THE MLS HOME PRICE INDEX Index and Benchmark Price, March 2023 Market Watch, March 2023 Copyright 2023 Toronto Regional Real Estate Board 25 ALL TRREB AREAS Single Family Detached Single Family Attached Composite Townhouse Apartment ® All TRREB Areas Halton Region Burlington Halton Hills Milton Oakville Peel Region Brampton Caledon Mississauga City of Toronto York Region Aurora East Gwillimbury Georgina King Markham Newmarket Richmond Hill Vaughan Stouffville Durham Region Ajax Brock Clarington Oshawa Pickering Scugog Uxbridge Whitby Dufferin County Orangeville Simcoe County Adjala-Tosorontio Bradford Essa Innisfil New Tecumseth
- 26. Index Benchmark Yr./Yr. % Chg. Index Benchmark Yr./Yr. % Chg. Index Benchmark Yr./Yr. % Chg. Index Benchmark Yr./Yr. % Chg. Index Benchmark Yr./Yr. % Chg. 353.5 $1,118,500 -16.212% 364.2 $1,424,500 -17.04% 382.4 $1,084,900 -16.54% 382.5 $818,500 -14.94% 353.6 $703,700 -13.38% 302.3 $1,101,600 -13.207% 378.2 $1,689,500 -14.14% 379.5 $1,286,500 -14.22% 371.2 $877,200 -10.51% 357.2 $741,200 -11.82% 258.0 $1,101,000 -18.277% 330.5 $1,866,900 -22.29% 324.0 $1,334,400 -24.25% 307.3 $911,600 -12.07% 315.6 $670,900 -13.75% 357.4 $1,241,200 -16.980% 375.8 $1,675,900 -18.13% 414.0 $1,277,700 -17.17% 369.9 $1,065,000 -11.25% 362.7 $742,000 -14.09% 396.6 $972,400 -16.347% 387.8 $1,039,800 -16.78% 399.1 $1,011,600 -16.61% 374.1 $890,800 -7.79% 369.5 $583,100 -15.27% 364.1 $923,100 -13.144% 353.9 $1,205,600 -14.41% 339.5 $922,800 -17.56% 315.0 $733,900 -9.59% 479.7 $608,700 -11.67% 375.7 $841,200 -15.706% 325.0 $1,189,700 -18.59% 319.4 $957,000 -17.74% 365.5 $687,800 -1.98% 504.2 $563,200 -16.73% 340.0 $969,800 -11.366% 399.6 $1,331,800 -13.24% 387.7 $1,217,700 -9.82% 374.2 $1,025,600 -9.15% 311.9 $767,900 -11.82% 315.1 $1,556,200 -13.386% 336.0 $1,783,600 -13.82% 328.9 $1,339,800 -11.70% 405.6 $1,101,900 -9.81% 135.7 $793,100 -10.55% 258.7 $1,115,900 -11.827% 317.1 $1,886,900 -11.77% 333.0 $1,336,600 -11.83% 320.9 $722,700 -7.39% 295.4 $617,000 -12.24% 353.1 $1,010,600 -8.736% 340.0 $1,416,600 -7.66% 361.5 $967,400 -9.15% 300.2 $873,800 -9.11% 386.7 $484,200 -14.67% 360.8 $764,200 -18.610% 330.1 $999,900 -20.55% 332.3 $895,000 -20.18% 411.4 $701,400 -14.91% 457.7 $543,300 -15.97% 335.6 $884,300 -11.428% 411.8 $1,744,800 -11.76% 380.5 $1,493,800 -12.51% 363.4 $902,700 -11.26% 359.2 $809,000 -11.40% 330.9 $1,483,900 -11.971% 342.8 $2,818,500 -9.93% 365.6 $2,137,900 -11.33% 272.9 $1,386,500 -17.35% 290.2 $931,900 -13.55% 285.0 $1,599,400 -11.710% 303.7 $2,045,700 -9.61% 423.8 $1,297,300 -12.35% 292.4 $863,600 -14.25% 308.8 $2,216,900 -13.501% 334.7 $2,775,000 -12.50% 367.4 $1,669,400 -15.07% 304.4 $784,800 -12.63% 281.1 $1,128,500 -15.509% 410.6 $1,656,700 -15.60% 317.9 $1,173,000 -14.08% 319.4 $845,800 -10.63% 385.8 $667,800 -14.85% 296.2 $1,233,500 -11.291% 481.1 $2,043,300 -12.72% 344.9 $1,240,800 -9.02% 298.8 $825,900 -9.89% 335.2 $803,700 -10.78% 319.7 $854,500 -10.373% 353.1 $2,211,800 -12.71% 374.2 $1,599,900 -12.24% 374.8 $1,193,000 -6.70% 351.2 $793,600 -9.86% 272.6 $2,224,200 -14.866% 250.4 $3,812,300 -17.50% 268.7 $2,546,200 -17.70% 283.5 $1,861,700 -15.70% 320.9 $1,191,300 -7.17% 293.4 $1,132,400 -13.528% 359.1 $2,349,800 -11.03% 347.9 $1,699,700 -9.28% 260.3 $1,074,800 -12.39% 300.5 $763,900 -14.46% 336.9 $1,253,300 -16.774% 300.6 $2,455,300 -19.13% 310.8 $1,484,100 -18.79% 460.6 $761,400 -2.79% 365.0 $537,700 -12.20% 339.2 $2,968,400 -14.881% 326.0 $3,886,600 -16.71% 317.0 $1,682,500 -11.99% 353.5 $1,473,900 -5.20% 374.2 $1,298,100 -15.22% 302.6 $1,275,900 -14.229% 346.8 $2,080,500 -13.97% 344.0 $1,084,400 -12.96% 408.1 $944,000 -9.27% 300.2 $728,800 -15.10% 367.7 $1,166,400 -8.714% 375.8 $2,533,300 -8.48% 331.5 $1,661,900 -7.09% 386.0 $859,900 -8.70% 355.4 $809,900 -12.01% 306.2 $996,300 -10.310% 410.1 $2,030,900 -13.10% 327.7 $1,188,200 -9.10% 377.5 $842,200 -14.26% 340.0 $659,300 -8.68% 421.8 $1,242,600 -12.689% 452.0 $1,568,600 -12.64% 440.9 $1,348,700 -13.33% 550.8 $1,048,700 -5.26% 388.0 $848,600 -11.25% 413.8 $1,404,500 -13.738% 420.5 $1,798,300 -14.03% 414.8 $1,355,100 -14.14% 438.6 $1,143,400 -7.08% 358.6 $898,000 -10.26% 380.5 $1,221,000 -13.680% 355.8 $1,391,000 -13.47% 385.3 $1,288,900 -14.85% 407.2 $625,000 -8.04% 427.1 $909,400 -15.892% 403.9 $1,145,600 -16.60% 383.3 $967,900 -18.67% 383.9 $838,500 -14.42% 432.6 $546,000 -14.42% 342.6 $981,800 -16.500% 386.6 $1,415,900 -16.10% 376.9 $1,064,400 -16.21% 355.9 $792,300 -18.80% 349.9 $622,800 -13.97% 391.6 $1,161,400 -16.645% 407.0 $1,275,500 -17.99% 400.4 $1,025,500 -18.54% 395.0 $820,900 -13.59% 393.6 $743,100 -10.12% 370.2 $959,500 -16.263% 384.4 $1,341,400 -16.81% 388.4 $1,051,500 -17.57% 395.9 $841,700 -17.86% 385.4 $639,300 -16.00% 362.0 $980,200 -16.513% 358.1 $1,273,800 -16.91% 346.6 $967,700 -17.20% 385.6 $734,200 -12.82% 387.2 $574,600 -16.80% 441.5 $880,300 -14.138% 417.6 $1,143,400 -15.47% 379.0 $938,800 -16.54% 414.7 $722,000 -6.16% 436.5 $592,700 -13.91% 370.2 $1,092,000 -13.666% 378.0 $1,320,600 -14.90% 360.0 $984,200 -16.69% 422.9 $716,900 -4.26% 299.0 $532,500 -15.35% 384.7 $843,700 -15.339% 376.6 $1,137,600 -15.67% 416.9 $946,400 -16.60% 435.4 $771,900 -13.28% 447.3 $505,900 -13.18% Toronto Regional Real Estate Board FOCUS ON THE MLS HOME PRICE INDEX Index and Benchmark Price, March 2023 Market Watch, March 2023 Copyright 2023 Toronto Regional Real Estate Board 26 CITY OF TORONTO Single Family Detached Single Family Attached Composite Townhouse Apartment ® All TRREB Areas City of Toronto Toronto W01 Toronto W02 Toronto W03 Toronto W04 Toronto W05 Toronto W06 Toronto W07 Toronto W08 Toronto W09 Toronto W10 Toronto C01 Toronto C02 Toronto C03 Toronto C04 Toronto C06 Toronto C07 Toronto C08 Toronto C09 Toronto C10 Toronto C11 Toronto C12 Toronto C13 Toronto C14 Toronto C15 Toronto E01 Toronto E02 Toronto E03 Toronto E04 Toronto E05 Toronto E06 Toronto E07 Toronto E08 Toronto E09 Toronto E10 Toronto E11
- 27. Bradford West Gwillimbury Whitchurch-Stouûville Adjala-Tosorontio East Gwillimbury Richmond Hill Toronto W06 Toronto W09 Toronto W05 Toronto E09 Toronto E06 Toronto E07 Halton Hills Orangeville Burlington Clarington Brampton Markham Georgina Pickering Vaughan Oshawa Caledon Oakville Scugog Innisûl Milton Brock Essa King Toronto Regional Real Estate Board Historic Annual Statistics Market Watch, March 2023 Copyright 2023 Toronto Regional Real Estate Board 27 Monthly Statistics 2023 Monthly Statistics 2022 Year Sales Average Price 2010 2011 2012 2013 2014 2015 2016 2017 2018 2019 2020 2021 $1,095,475 $929,636 $819,153 $787,842 $822,510 $729,824 $622,116 $566,611 $522,951 $497,073 $464,989 $431,262 121,712 95,066 87,747 78,017 92,340 113,040 101,213 92,776 87,047 85,488 89,110 85,860 January February March April May June July August September October November December Annual $1,189,915 $1,050,663 $1,079,648 $1,090,528 $1,086,560 $1,078,941 $1,073,316 $1,145,848 $1,210,372 $1,250,704 $1,298,666 $1,334,062 $1,242,407 75,071 3,099 4,510 4,933 5,001 5,586 4,870 6,422 7,226 7,940 10,862 9,028 5,594 January February March April May June July August September October November December Year to Date $1,089,819 $1,108,606 $1,096,519 $1,037,542 14,750 6,896 4,765 3,089 Notes 1. Sales, dollar volume, average sale prices and median sale prices are based on firm transactions entered into the TRREB MLS® System between the first and last day of the month/period being reported. 2. New listings entered into the TRREB MLS® System between the first and last day of the month/period being reported. 3. Active listings at the end of the last day of the month/period being reported. 4. Ratio of the average selling price to the average listing price for firm transactions entered into the TRREB MLS® System between the first and last day of the month/period being reported. 5. Average Listing Days on Market (Avg. LDOM) refers to the average number of days sold listings were on the market. Average Property Days on Market (Avg. PDOM) refers to the average number of days a property was on the market before selling, irrespective of whether the property was listed more than once by the same combination of seller and brokerage during the original listing contract period. 6. Active Listings at the end of the last day of the month/period being reported. 7. Past monthly and year-to-date figures are revised on a monthly basis. 8. SNLR = Sales-to-New-Listings Ratio. Calculated using a 12 month moving average (sales/new listings). 9. Mos. Inv. = Months of Inventory. Calculated using a 12 month moving average (active listings/sales). 10. "Bradford West Gwillimbury" is referred to as "Bradford" and "Whitchurch-Stouffville" is referred to as "Stouffville" in the report. Dufferin Durham Halton Peel Simcoe Toronto York For historical annual sales and average price data over a longer time frame, go to: https://trreb.ca/files/market-stats/market-watch/historic.pdf