Recommended

Recommended
More Related Content
Similar to Who Did It Better
Similar to Who Did It Better (20)
Recently uploaded
Recently uploaded (20)
Who Did It Better
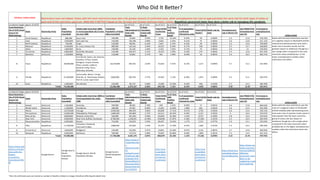
- 1. Lockdowns began approx 3/14/20 As of 5/13 As of 5/13 As of 5/13 As of 5/13 As of 5/13 As of 5/13 As of 5/13 Least Restrictive (As of 5/4) Check Source for Methodology State Governing Party State Population (rounded) Citie(s) with more than 200K, or most populated city if none are over 200k Combined Population of listed cities (rounded) Tests Administered in State with Reuslts % State Population Tested with Results Total COVID Confirmed Cases % of Tests with Positive Result % of population confirmed infected by state Total COVID Deaths* Death rate by state Unemployment rate in March (%) July PROJECTED Unemployment rate (%) % Increase in unemployment rate 1 South Dakota Republican 880,000 Sioux Falls 190,000 25,844 2.94% 3,732 14.44% 0.42% 39 0.004% 3.3 15.8 478.79% 2 Utah Republican 3,200,000 Salt Lake City 210,000 156,786 4.90% 6,620 4.22% 0.21% 75 0.002% 3.6 14.8 411.11% 3 North Dakota Republican 750,000 Fargo 130,000 48,945 6.53% 1,647 3.37% 0.22% 40 0.005% 2.2 15.6 709.09% 4 Missouri Republican 6,100,000 St. Louis, Kansas City 800,000 124,142 2.04% 10,355 8.34% 0.17% 548 0.009% 4.5 15.7 348.89% 5 Idaho Republican 1,800,000 Boise 230,000 33,128 1.84% 2,324 7.02% 0.13% 70 0.004% 2.6 14 538.46% 6 Tennessee Republican 6,800,000 Nashville, Memphis 132,000 292,917 4.31% 16,370 5.59% 0.24% 273 0.004% 3.5 15.8 451.43% 7 Montana Democrat 1,100,000 Billings 110,000 23,852 2.17% 462 1.94% 0.04% 16 0.001% 3.5 16.3 465.71% 8 Texas Republican 29,000,000 Fort Worth, Dallas, San Antonio, Houston, El Paso, Austin, Arlington, Corpus Christie, Plano, Laredo, Lubbock, Garland, Irving, Frisco, Mckinney, Amarillo 10,570,000 587,431 2.03% 43,502 7.41% 0.15% 1,217 0.004% 4.7 15.2 323.40% 9 Florida Republican 21,500,000 Jacksonville, Miami, Tampa, Orlando, St. Petersburg, Hialeah, Port St. Lucie, Cape Coral 3,000,000 594,763 2.77% 42,402 7.13% 0.20% 1,875 0.009% 4.3 15.5 360.47% 10 Iowa Republican 3,200,000 Des Moines 210,000 85,719 2.68% 13,289 15.50% 0.42% 306 0.010% 3.7 14.2 383.78% 74,330,000 15,582,000 1,973,527 2.66% 140,703 7.13% 0.19% 4,459 0.006% 3.59 15.29 425.91% Lockdowns began approx 3/14/20 As of 5/13 As of 5/13 As of 5/13 As of 5/13 As of 5/13 As of 5/13 As of 5/13 Most Restrictive (As of 5/4) Check Source for Methodology State Governing Party State Population (rounded) Citie(s) with more than 200K or most populated city under 100k Combined Population of listed cities (rounded) Tests Administered in State with Reuslts % State Population Tested with Results Total COVID Confirmed Cases % of Tests with Positive Result % of population confirmed infected by state Total COVID Deaths* Death rate by state Unemployment rate in March (%) July PROJECTED Unemployment rate (%) % Increase in unemployment rate 1 Hawaii Democrat 1,420,000 Honolulu 340,000 38,365 2.70% 640 1.67% 0.05% 17 0.001% 2.6 17.8 684.62% 2 Rhode Island Democrat 1,100,000 Providence 180,000 97,922 8.90% 11,835 12.09% 1.08% 462 0.042% 4.6 15.4 334.78% 3 Illinois Democrat 12,670,000 Chicago 2,690,000 489,359 3.86% 84,698 17.31% 0.67% 3,792 0.030% 4.6 15.6 339.13% 4 Pennsylvania Democrat 12,800,000 Philadelphia, Pittsburgh 1,880,000 302,869 2.37% 62,213 20.54% 0.49% 4,147 0.032% 6 16.6 276.67% 5 New Jersey Democrat 8,900,000 Newark, Jersey City 550,000 441,450 4.96% 142,861 32.36% 1.61% 9,727 0.109% 3.8 15.6 410.53% 6 New York Democrat 8,400,000 New York, Buffalo, Rochester 8,780,000 1,258,907 14.99% 350,848 27.87% 4.18% 27,290 0.325% 4.5 16.4 364.44% 7 Massachusettes Republican 6,900,000 Boston 710,000 410,032 5.94% 80,497 19.63% 1.17% 5,315 0.077% 2.9 15.1 520.69% 8 Ohio Republican 11,700,000 Columbus, Cleveland, Cincinnati,Toldeo 1,880,000 225,854 1.93% 25,729 11.39% 0.22% 1,485 0.013% 5.5 16.4 298.18% 9 Connecticut Democrat 3,600,000 Bridgeport 140,000 142,943 3.97% 34,855 24.38% 0.97% 3,125 0.087% 3.7 14.8 400.00% 10 Maryland Republican 6,000,000 Baltimore 590,000 173,574 2.89% 35,903 20.68% 0.60% 1,866 0.031% 3.3 13.9 421.21% 73,490,000 17,740,000 3,581,275 4.87% 830,079 23.18% 1.13% 57,226 0.078% 4.15 15.76 379.76% https://www.wall ethub.com/edu/s tates-with-the- fewest- coronavirus- restrictions/7381 8/ Google Search Google Search, World Population Review Google Search, World Population Review Google Search, World Population Review https://www.kf f.org/other/stat e- indicator/covid- 19- testing/?current Timeframe=0&s ortModel=%7B %22colId%22:% 22Location%22, %22sort%22:%2 2asc%22%7D https://ww w.worldom eters.info/c oronavirus/ country/us/ https://ww w.worldom eters.info/c oronavirus/ country/us/ https://www.bls.g ov/web/laus/laum strk.htm#laumstrk. f.p https://www.usa today.com/story /money/2020/05 /08/state- economies-most- likely-to-be- crippled-by-covid- 19/111645576/ *Not all confirmed cases are closed so number of deaths is likely to change, therefore affecting the death rate. CONCLUSION CONCLUSION Restrictions have not helped. States with the most restrictions have seen a far greater amount of confirmed cases, while unemployment has risen at approximately the same rate for both types of states at each end of the restriction spectrum. WHO DID IT BETTER? Based on the 10 most and 10 least restricive states, mostly, Republican goverened states have done a better job at managing this pandemic. OVERALL CONCLUSION States with the most restrictions saw the most of a negative impact to life/health (COVID related) while administering more tests and a rate of positive results nearly 4 times greater than the least restrictive group of states, but less impact to livelihood, though by a slim margin when compared to the least restrictive states probably due to the higher unemployment numbers when the restrictions went into effect. Totals Totals States with the least restrictions saw less of a negative impact to life/health (COVID related) and admistered less tests with a lower rate of positive results, but the greatest impact to livelihood, though by a slim margin when compared to the most restrictive states probably due to the lower unemployment numbers when restrictions into effect. Who Did It Better?