**Tableau Basics Cheat Sheet**
*Introduction:*
Tableau is a powerful data visualization and business intelligence tool that allows users to easily analyze and present data in a visually compelling way. This Tableau Basics Cheat Sheet serves as a quick reference guide to help beginners get started with Tableau and perform common tasks efficiently.
*1. Data Connection:*
- Connect to data sources like Excel, CSV, databases, etc.
- Drag and drop data fields onto the "Rows" and "Columns" shelves to create a basic view.
*2. Visualizations:*
- Create various visualizations like bar charts, line graphs, scatter plots, maps, etc.
- Double-click on a field to create a basic visualization or drag fields onto the "Marks" shelf to customize.
*3. Filters:*
- Apply filters to focus on specific data subsets.
- Right-click on a field or drag it onto the "Filters" shelf to create a filter.
*4. Sorting:*
- Sort data based on specific fields.
- Right-click on a field or use the sort icon in the toolbar to sort data.
*5. Calculated Fields:*
- Create custom calculations using existing fields.
- Go to "Analysis" > "Create Calculated Field" to define formulas.
*6. Groups & Hierarchies:*
- Group data by combining individual data points.
- Create hierarchies to organize data into drill-down levels.
*7. Aggregation:*
- Aggregate data using functions like SUM, AVG, COUNT, etc.
- Drag fields to the "Measure Values" shelf to apply aggregation.
*8. Dual-Axis Charts:*
- Combine two different chart types on the same axes to compare data.
- Right-click on a axis and select "Dual-Axis" to enable this feature.
*9. Dashboard Creation:*
- Combine multiple visualizations into a single dashboard.
- Drag sheets onto the dashboard canvas and arrange as desired.
*10. Parameters:*
- Use parameters to create interactive dashboards.
- Right-click in the data pane and select "Create Parameter" to get started.
*11. Data Blending:*
- Blend data from multiple sources for comprehensive analysis.
- Go to "Data" > "Edit Relationships" to define data blending.
*12. Publishing:*
- Share your Tableau workbooks with others by publishing to Tableau Server or Tableau Public.
- Go to "Server" > "Publish Workbook" to share your insights.
*13. Formatting:*
- Customize the appearance of visualizations and dashboards.
- Use the "Format" options and "Dashboard" menu to fine-tune the design.
*14. Interactivity:*
- Add filters, actions, and tooltips to make visualizations interactive.
- Explore the "Dashboard" menu for interaction options.
*15. Exporting:*
- Export visualizations as images, PDFs, or data files.
- Use the "File" menu to access export options.
Remember, this Tableau Basics Cheat Sheet provides just a glimpse of Tableau's capabilities. As you gain more experience, you can explore advanced features and create more sophisticated data visualizations and insights to drive better decision-making. Happy data analyzing with Tableau!
Call Girls Hsr Layout Just Call 👗 7737669865 👗 Top Class Call Girl Service Ba...
Data camp - Tableau basics cheat sheet.pdf
1. > Why use Tableau?
> Tableau Versions
Learn Data Skills Online at www.DataCamp.com
> Getting started with Tableau
> Visualizing Your First Dataset
> Creating dashboards with Tableau
The Canvas
Upload a dataset to Tableau
Launch Tablea
In the Connect section, under To a File, press on the file format of your choice
For selecting an Excel file, select .xlsx or .xlsx
Creating your first visualization
Once your file is uploaded, open a Worksheet and click on the Data pane on the left-hand sid
Drag and drop at least one field into the Columns section, and one field into the Rows section at the top
of the canva
To add more detail, drag and drop a dimension into the Marks card (e.g. drag a dimension over the color square
in the marks card to color visualization components by that dimension
To a summary insight like a trendline, click on the Analytics pane and drag the trend line into your visualization
You can change the type of visualization for your data by clicking on the Show Me button on the top right
Dashboards are an excellent way to consolidate visualizations and present data to a variety of stakeholders. Here is a
step by step process you can follow to create a dashboard.
When working with Tableau, you will work with Workbooks. Workbooks contain sheets, dashboards, and stories.
Similar to Microsoft Excel, a Workbook can contain multiple sheets. A sheet can be any of the following and can be
accessed on the bottom left of a workbook
Worksheet
A worksheet is a single
view in a workbook. You
can add shelves, cards,
legends, visualizations,
and more in a worksheet
Dashboard
A collection of multiple
worksheets used to
display multiple views
simultaneously
story
A story is a collection of
multiple dashboards and/
or sheets that describe a
data story
There are two main versions of Tableau
Tableau Public
A free version of Tableau that lets you connect to limited
data sources, create visualizations and dashboards, and
publish dashboards online
Tableau Desktop
A paid version of tableau which lets you connect to
all types of data sources, allows you to save work
locally, and unlimited data sizes
> Data Visualizations in Tableau
Tableau provides a wide range of data visualizations to use. Here is a list of the most useful visualizations you
have in Tableau
Launch Tablea
In the Connect section under To A File, press on your desired file typ
Select your fil
Click the New Sheet at the bottom to create a new shee
Create a visualization in the sheet by following the steps in the previous sections of this cheat shee
Repeat steps 4 and 5 untill you have created all the visualizations you want to include in your dashboar
Click the New Dashboard at the bottom of the scree
On the left-hand side, you will see all your created sheets. Drag sheets into the dashboar
Adjust the layout of your sheets by dragging and dropping your visualizations
> Creating stories with Tableau
A story is a collection of multiple dashboards and/or sheets that describe a data story
Click the New Story at the bottom of the scree
Change the size of the story to the desired size in the bottom left-hand corner of the screen under Siz
Edit the title of the story by renaming the story. To do this, right-click on the story sheet at the bottom
and press Renam
A story is made of story points, which lets you cycle through different visualizations and dashboard
To begin adding to the story, add a story point from the left-hand side. You can add a blank story poin
To add a summary text to the story, click Add a caption and summarize the story poin
Add as many story points as you would like to finalize your data story
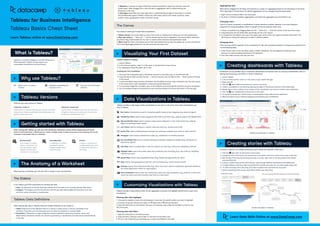
Bar Charts: Horizontal bars used for comparing specific values across categories (e.g. sales by region)
Stacked Bar Chart: Used to show categorical data within a bar chart (e.g., sales by region and department)
Side-by-Side Bar Chart: Used to compare values across categories in a bar chart format (e.g., sales by
region comparing product types)
Line Charts: Used for looking at a numeric value over time (e.g., revenue over time)
Scatter Plot: Used to identify patterns between two continuous variables (e.g., profit vs. sales volume)
The canvas is where you’ll create data visualizations
Histogram: Used to show a distribution of data (e.g., Distribution of monthly revenue)
Box-and-Whisker Plot: Used to compare distributions between categorical variables (e.g., distribution of
revenue by region)
Heat Map: Used to visualize data in rows and columns as colors (e.g., revenue by marketing channel)
Highlight Table: Used to show data values with conditional color formatting (e.g., site-traffic by marketing
channel and year)
Symbol Map: Used to show geographical data (e.g., Market size opportunity by state)
Map: Used to show geographical data with color formatting (e.g., Covid cases by state)
Treemap: Used to show hierarchical data (e.g., Show how much revenue subdivisions generate relative to
the whole department within an organization)
Dual Combination: Used to show two visualizations within the same visualization (e.g., profit for a store each
month as a bar chart with inventory over time as a line chart)
What is Tableau?
Tableau is a business intelligence tool that allows you to
effectively report insights through easy-to-use
customizable visualizations and dashboards
Easy to use—no coding
involved
Integrates seamlessly with
any data source
Fast and can handle large
datasets
Tableau Basics Cheat Sheet
Tableau for Business Intelligence
Learn Tableau online at www.DataCamp.com
In the sidebar, you’ll find useful panes for working with dat
Data: The data pane on the left-hand side contains all of the fields in the currently selected data sourc
Analytics: The analytics pane on the left-hand side lets you add useful insights like trend lines, error bars,
and other useful summaries to visualizations
When opening a worksheet, you will work with a variety of tools and interfaces
Tableau provides a deep ability to filter, format, aggregate, customize, and highlight specific parts of your data
visualizations
The Sidebar
Tableau Data Definitions
>
>
The Anatomy of a Worksheet
Customizing Visualizations with Tableau
When working with data in Tableau, there are multiple definitions to be mindful o
Fields: Fields are all of the different columns or values in a data source or that are calculated in the
workbook. They show up in the data pane and can either be dimension or measure field
Dimensions: A dimension is a type of field that contains qualitative values (e.g. locations, names, and
departments). Dimensions dictate the amount of granularity in visualizations and help reveal nuanced details
in the data
1. Tableau Canvas: The canvas takes up most of the screen on Tableau and is where you can add visualizations
2. Rows and columns: Rows and columns dictate how the data is displayed in the canvas. When dimensions
are placed, they create headers for the rows or columns while measures add quantitative values
3. Marks card: The marks card allows users to add visual details such as color, size, labels, etc. to rows and columns.
This is done by dragging fields from the data pane into the marks card
Once you’ve created a visual, click and drag your mouse over the specific portion you want to highlight
Filtering data with highlights
Right-click on a measure field in the Data pan
Go down to Default properties, Aggregation, and select the aggregation you would like to use
In the Format menu on the top ribbon, press on Select Workbook. This will replace the Data pane and
allow you to make formatting decisions for the Workboo
From here, select the font, font size, and color
Create a visualization by dragging fields into the Rows and Columns section at the top of the scree
Drag dimensions into the Marks field, specifically into the Color squar
To change from the default colors, go to the upper-right corner of the color legend and select Edit Colors. This
will bring up a dialog that allows you to select a different palette
Aggregating data
Changing colors
When data is dragged into the Rows and Columns on a sheet, it is aggregated based on the dimensions in the sheet.
This is typically a summed value. The default aggregation can be changed using the steps below:
Color is a critical component of visualizations. It draws attention to details. Attention is the most important
component of strong storytelling. Colors in a graph can be set using the marks card.
Changing fonts
Fonts can help with the aesthetic of the visualization or help with consistent branding. To change the workbook’s font,
use the following steps
Stories examples in Tableau
Dashboard examples in Tableau
2. Once you let go, you will have the option to Keep Only or Exclude the data
3. Open the Data pane on the side bar. Then, you can drag-and-drop a field into the fitlers card just to the
left of the pane.
Open the Data pane on the left-hand-sid
Drag-and-drop a field you want to filter on and add it to the Filters car
Fill out in the modal how you would like your visuals to be filtered on the data
Filtering data with filters
3. Measures: A measure is a type of field that contains quantitative values (e.g. revenue, costs, and
market sizes). When dragged into a view, this data is aggregated, which is determined by the
dimensions in the view
4. Data types: Every field has a data type which is determined by the type of information it contains.
The available data types in Tableau include text, date values, date & time values, numerical values,
boolean values, geographical values, and cluster groups